


See these two stories in the Patriot Post:
Satellite Data Defies NOAA and NASA Claims
See more on the Coldest February and January to March in the entire record back to 1895 in the Northeast (10 states and DC) here.
It was also the snowiest February in parts of the northeast.
--------------
Guest Post by Bob Tisdale
Dr. Roy Spencer introduced the updated and much corrected UAH atmospheric temperature data in his blog post Version 6.0 of the UAH Temperature Dataset Released: New LT Trend = +0.11 C/decade. The new temperature anomaly data for the lower troposphere, mid troposphere and lower stratosphere are presently in beta form for comment. That is, they’re not official...yet. I suspect the update will not go over well with the catastrophic-anthropogenic-global-warming crowd. Links to the version 6.0 beta data are at the bottom of Roy’s post, which also contains a detailed discussion of the updates. So if you have questions, please ask them at Roy Spencer’s blog through the above link. This post is a simple data presentation.
The version 6.0 beta temperature anomaly data for the lower troposphere used in this post are here.
In this post, we’ll take a quick look at the new UAH version 6.0 beta lower troposphere temperature anomaly data, comparing it to: (1) the current UAH version 5.6 data and (2) the RSS lower troposphere temperature data.
But first…
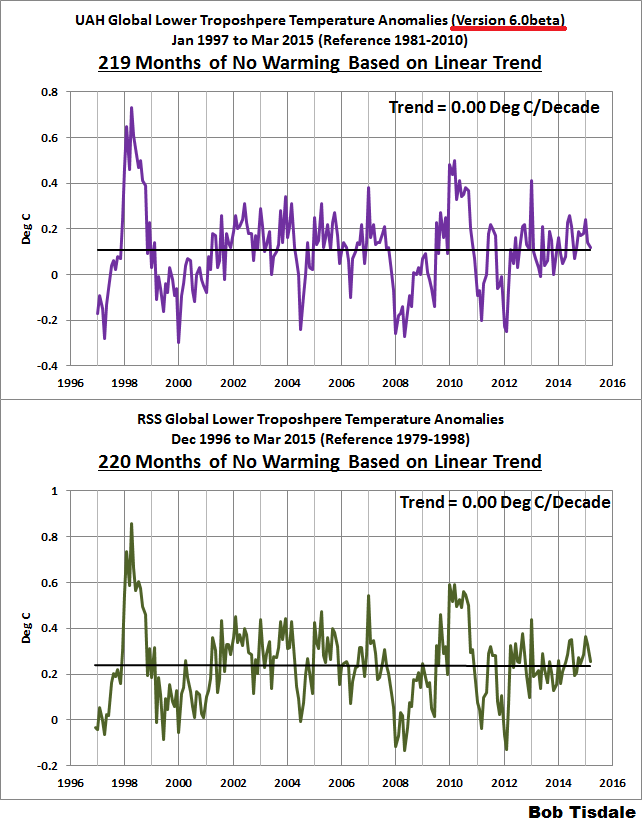
BASED ON LINEAR TRENDS, THE NEW UAH LOWER TROPOSPHERE TEMPERATURE DATA SHOW NO WARMING FOR 18+ YEARS, LIKE RSS
For Figure 1, I’ve extended the new UAH version 6.0 beta and the RSS lower troposphere temperature anomaly data as far back in time as they could go while showing no warming based on their linear trends. The new UAH data show no warming for 219 months, and for the RSS data, it’s 220 months.

Figure 1 Enlarged
A QUICK OVERVIEW OF LOWER TROPOSPHERE TEMPERATURE DATA
The following is a reprint of the initial discussion of lower troposphere temperature data from the monthly updates. The most recent update is here.
Special sensors (microwave sounding units) aboard satellites have orbited the Earth since the late 1970s, allowing scientists to calculate the temperatures of the atmosphere at various heights above sea level. The level nearest to the surface of the Earth is the lower troposphere. The lower troposphere temperature data include the altitudes of zero to about 12,500 meters, but are most heavily weighted to the altitudes of less than 3000 meters.
See the left-hand cell of the illustration here. The lower troposphere temperature data are calculated from a series of satellites with overlapping operation periods, not from a single satellite. The monthly UAH lower troposphere temperature data is the product of the Earth System Science Center of the University of Alabama in Huntsville (UAH). UAH provides the data broken down into numerous subsets. See the webpage here [version 5.6 data]. The UAH lower troposphere temperature data are supported by Christy et al. (2000) MSU Tropospheric Temperatures: Dataset Construction and Radiosonde Comparisons. Additionally, Dr. Roy Spencer of UAH presents at his blog the monthly UAH TLT data updates a few days before the release at the UAH website. UAH uses the base years of 1981-2010 for anomalies. The UAH lower troposphere temperature data are for the latitudes of 85S to 85N, which represent more than 99% of the surface of the globe.
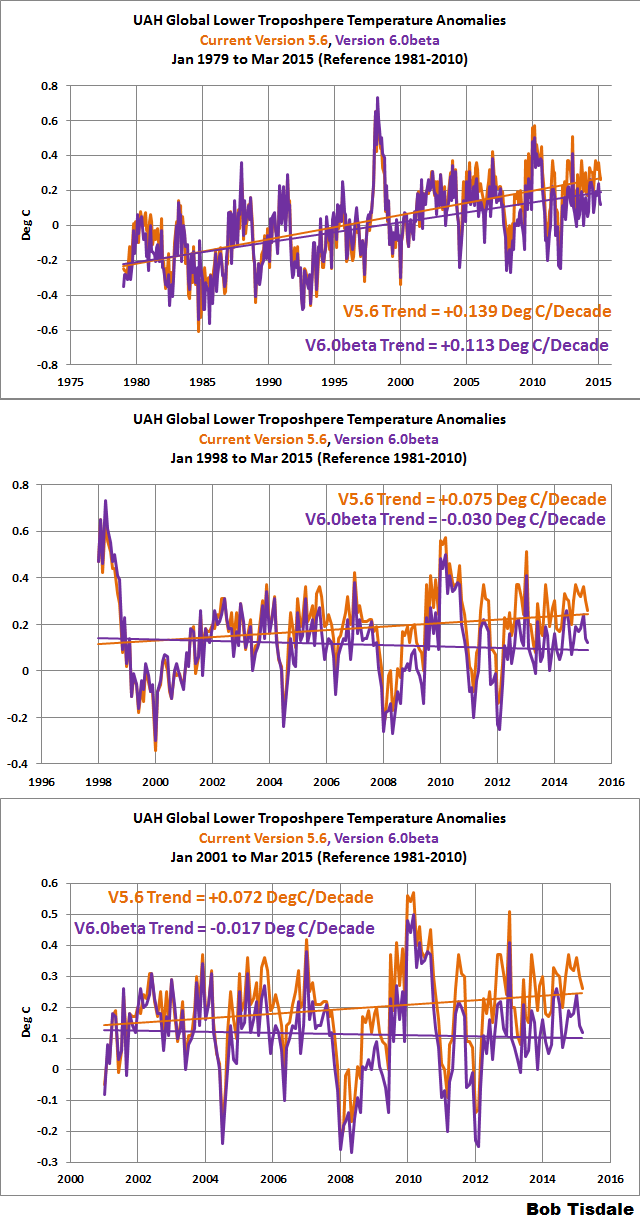
UAH VERSION 5.6 VERSUS UAH VERSION 6.0 BETA
Figure 2 compares the current version 5.6 UAH lower troposphere temperature anomaly data to the recently released version 6.0 beta. The comparisons start in the Januarys of 1979, 1998 and 2001 and run through March 2015. The first full year of the UAH lower troposphere temperature data is 1979, while 1998 and 2001 are commonly used as start years during discussions of the recent slowdown in global surface and global lower troposphere temperatures. They are the same time periods we present in the monthly surface and lower troposphere temperature anomaly updates. See the most recent update here.

Figure 2 Enlarged
Since 1979, the new version (v6.0 beta) of the UAH lower troposphere temperature data show a noticeably lower warming rate than current version 5.6 data. For the periods starting in 1998 and 2001, the new beta version data show cooling of the lower troposphere based on the linear trends, while the current 5.6 version data show warming.
RSS VERSUS UAH VERSION 6.0 BETA
The warming rate since 1979 for the new UAH data is slightly less than (basically the same as) the lower troposphere temperature anomaly data from RSS. The shorter term cooling rates since 1998 and 2001 are also comparable. See the graphs in Figure 3.
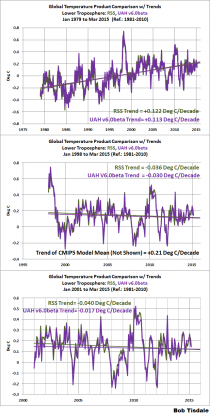
Figure 3 Enlarged
CLOSING
The RSS lower troposphere temperature data used to be an outlier, showing much lower trends than the surface temperature data and the UAH lower troposphere data. That will no longer be the case with the new UAH version 6.0 data.
SOURCES
The UAH version 6.0 beta lower troposphere temperature anomaly data are here.
The UAH version 5.6 lower troposphere temperature anomaly data are here.
The RSS lower troposphere temperature anomaly data are here.