


By Joseph D’Aleo
See also SPPI’s Extreme Weather - The Blame Game by Dennis Ambler here. See more on extremes in this Steve Goddard post on WUWT here.
We have had some extreme conditions the last few years - of cold, heat, snow and rain. Detailed summaries on the cold last winter can be found here and on the hot summer here and here. Both were memorable seasons indeed. Though the second author did an excellent job detailing the summer records and did mention the amplified and frozen jet stream, he went on to say man made global warming contributed to it.
Whereas the media and alarmists like to portray extremes (Holdren has called it “Climate Disruption") as the result of or greatly amplified by man made greenhouse gases, natural factors can be shown as the cause (with some contribution from urban warming and bad data). Too many scientists and media ‘enviro’ bloggers have stated “it must be man-made - what else could it be?”.
In short, the last few years, a combination of low solar, high latitude volcanism and record high latitude blocking, and strong ENSO events (both La Nina and El Nino) are acting to increase PERSISTENCE within seasons, which leads to larger seasonal extremes and greater local extremes within seasons. For this post, we will focus on temperatures last winter and this summer and touch on a few causes.
THE ROLE OF THE SUN
The sun is the major driver for climate. The variations in the sun including irradiance, ultraviolet warming through ozone chemistry, galactic cosmic ray diffusion through the solar wind cause variations in the earths atmospheric and surface temperatures, changes in the jet stream and affect the tendency for blocking events. The sun is a factor probably through its effect on blocking also in how persistent patterns are which leads to anomalies to build for the seasons. The directional anomalies vary year to year with other factors such as ENSO and the state of the ocean multidecadal cycles - PDO and AMO.
As New Scientist magazine recently reported “Mike Lockwood at the University of Reading, and Joanna Haigh of Imperial College London have found that although the sun’s brightness does not change much during solar maxima and minima, the type of radiation it emits does. During maxima the sun emits more ultraviolet radiation, which is absorbed by the stratosphere. This warms up, generating high-altitude winds...a stronger jet stream. The reverse is true in solar minima, and the effect is particularly evident in Europe, where minima increase the chances of extreme weather. Indeed, this year’s cold winter and the Russian heat wave in July have been linked to the sun’s current lull, which froze weather systems in place for longer than normal.”
Indeed Baldwin and Dunkerton (2004) showed though solar irradiance varies only 0.1% over the 11 year cycle, radiation at longer UV wavelengths are known to increase by 6 to 8 percent with still larger changes (factor of two or more) at extremely short UV and X-ray wavelengths. Labitzke has shown statistically significant differences of temperatures in the lower stratosphere into the middle troposphere with the 11 year solar cycle (warmest at max). Shindell (1999) showed results from a global climate model including ozone and UV found UV induced stratospheric ozone changes and generated heat that penetrates into the troposphere, in effect confirming Labitzke’s findings.
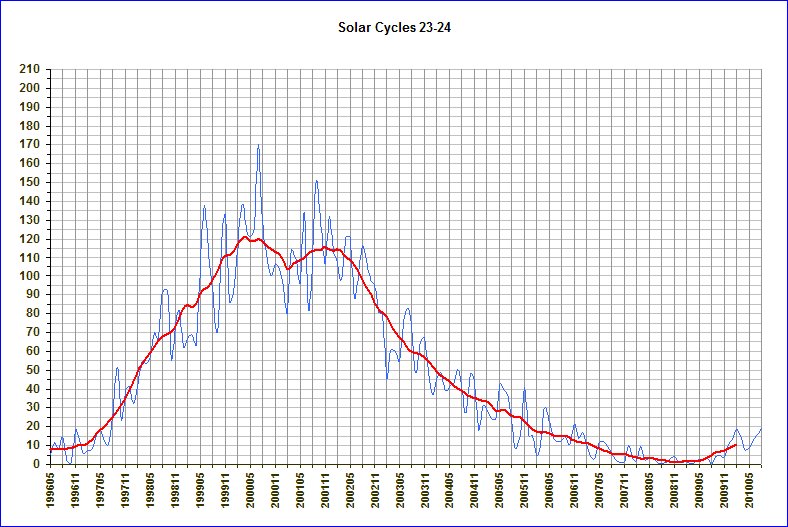
The winters and summers have been very “locked in” the last few years as the sun has been quieter, longer than anytime in at least 100 and very possibly 200 or more years (below, enlarged here).
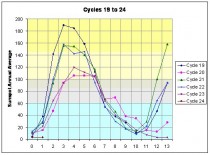
The bottom of cycle 23 was reached in December 2008 and this month may be the first month was a sunspot number of 20 in cycle 24. Compare that to recent cycles - cycle 19 21 months after the minimum reached a monthly number of 124, cycle 20 had touched 57, cycle 21 had reached 94, cycle 22 had climbed to 113, cycle 22 to 55 (below, enlarged here).
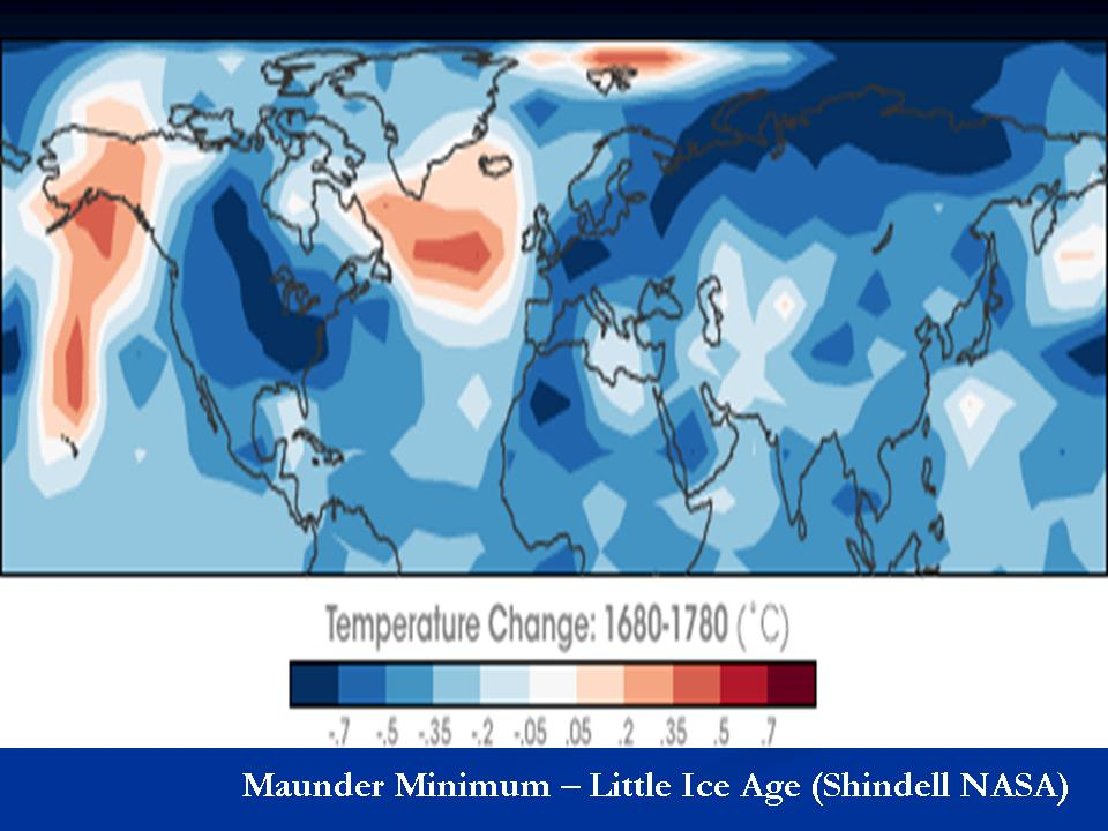
This has led numerous solar scientists to project that this could be the start of a Dalton or even Maunder Minimum. Drew Shindell of NASA GISS, a programmer for James Hansen showed in a paper in 1999 how the increased ultraviolet in active solar years causes warming of the highest atmosphere through ozone chemistry. He then included the chemistry and ultraviolet radiation variations in a climate model. He showed he had better results depicting the variance over the various cycles at maxima and minima. He also showed in a NASA Earth observatory how this factor could have explained the Little Ice Age of the Maunder Minimum.
Their model showed when the sun was quiet in 1680, it was much colder than when it became active again one hundred years later. “During this period, very few sunspots appeared on the surface of the Sun, and the overall brightness of the Sun decreased slightly. Already in the midst of a colder-than-average period called the Little Ice Age, Europe and North America went into a deep freeze: alpine glaciers extended over valley farmland; sea ice crept south from the Arctic; and the famous canals in the Netherlands froze regularly - an event that is rare today.” (below, enlarged here).

This chart shows the model derived difference between 1680 in the heart of the Maunder Minimum and 1780, when the sun had become active again.
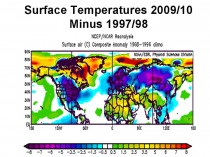
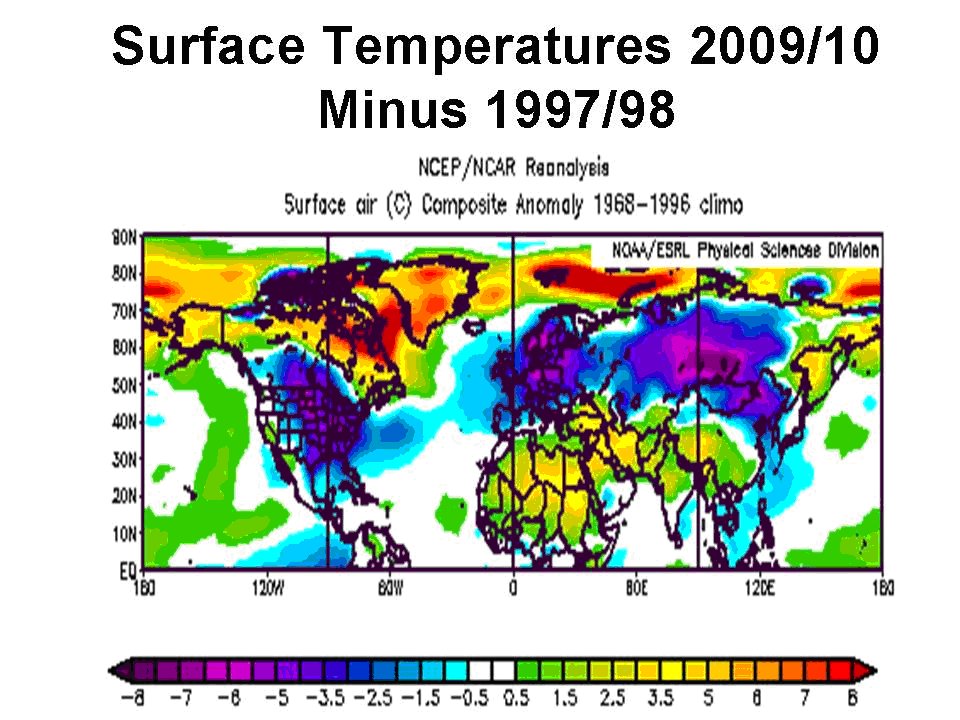
I did a similar winter hemispheric temperature difference between the two strongest El Ninos of the last dozen years 2009/10 and 1997/98. It yielded similar results. You can see how much more “Maunder-like” this El Nino was compared to the one in 1997/98! (below, enlarged here). (more on winter in the full PDF).
SUMMER 2010
Summer 2010 was again characterized by vey stable and amplified pattern which led to strong anomalies and extremes. La Nina came on strongly after a strong El Nino winter. When that has happened in the past usually it meant a hot summer - recent examples include 1966, 1988, 1995, 1999. Madhav Khandekar has shown here how the Pakistan floods are not uncommon and historically have occurred in years when a La Nina summer came on after an El Nino winter. This time remember the sun is struggling to emerge from a long slumber. Blocking continued this summer though the strongest mid-latitude ridging set up over eastern Europe/western Russia and the eastern United States and troughing in a chilly west coast of North America and a very wet Pakistan and India.
GLOBAL HEAT RECORDS AND PAST SOLAR ACTIVITY
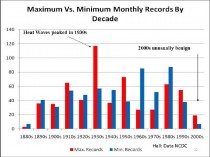
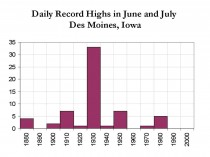
Let’s look at all-time heat records relative to past solar cycles for the continents. We see that they were all in the 1880s and early 1900s. Most were at very low solar monthly sunspot numbers (average of 19 relative to long term average of 55 and peak of over 250). The North American and Oceanic (Philippines) both occurred in the sunspotless years in 1912/1913 most similar to 2008 and 2009. So it appears not only is a quiet sun a time when cold extremes occur but also warm extremes.
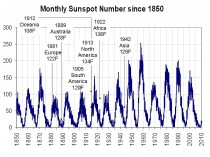
Monthly sunspot number and the continental all-time record high temperatures (enlarged here).
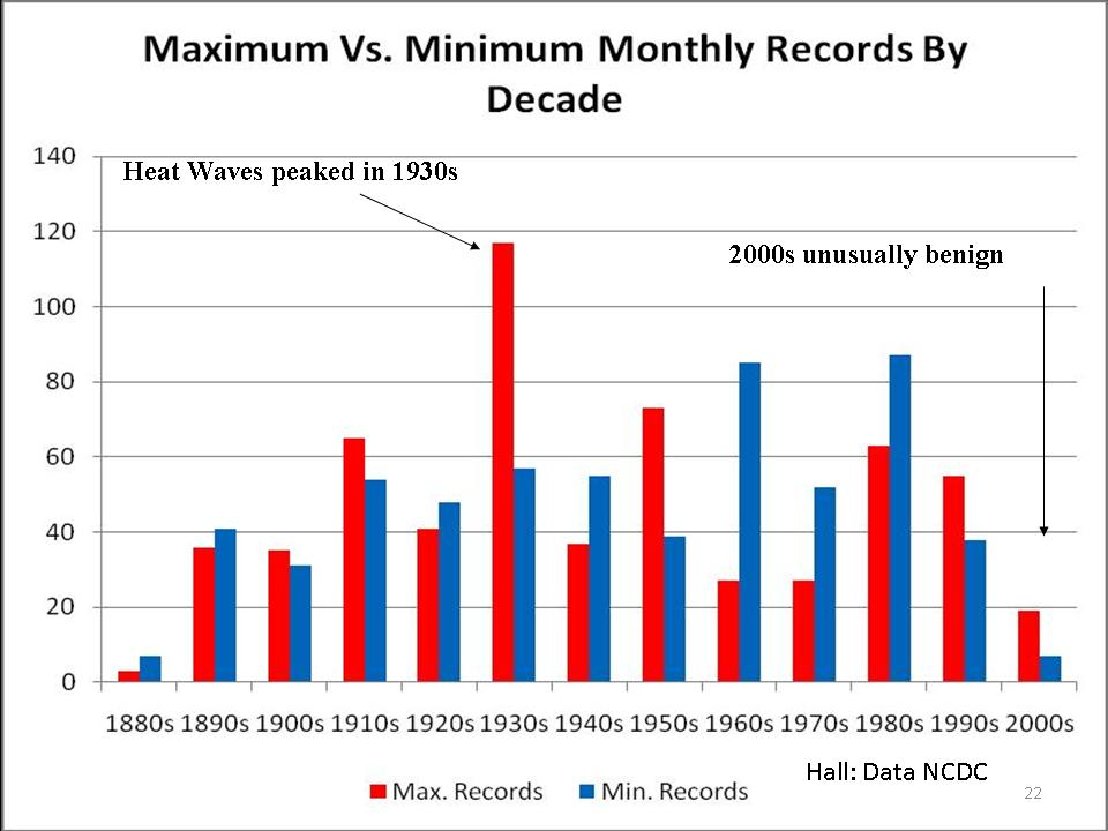
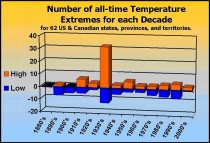
Most of the state records in the United States and Provincial records in Canada came at the end of the quiet sun period in the 1930s (below, enlarged here and here).
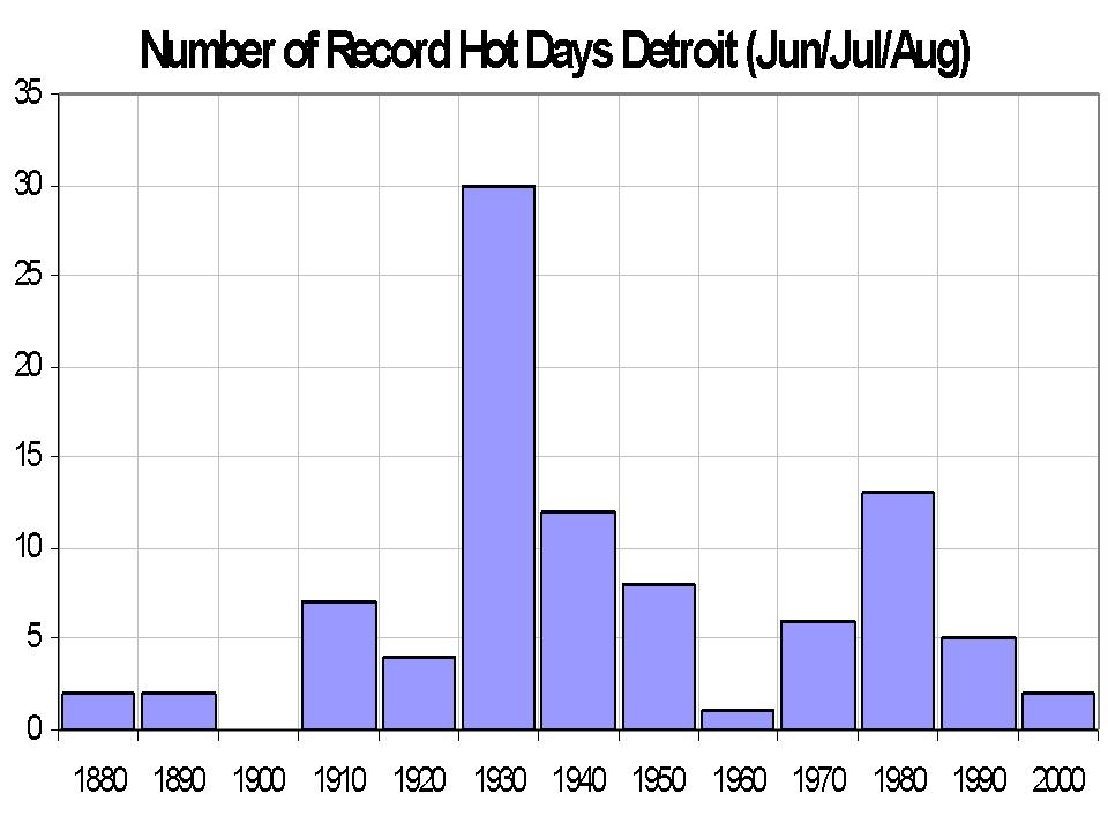
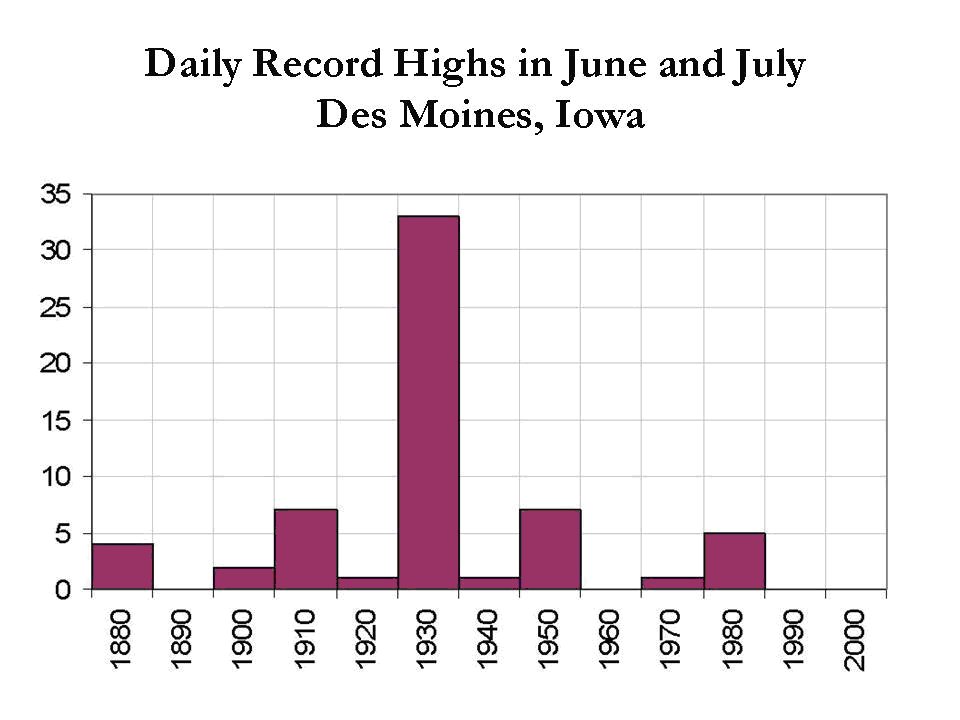
You can see another run off after the min solar slump to the 1960s and 1970s (cycle 20) gave way to strong cycle 21. That is visible in the city records (below, enlarged here and here).

PDO and AMO
I have shown here and in a paper with Dr. Easterbrook here how the PDO and AMO relate to the temperatures in the United States
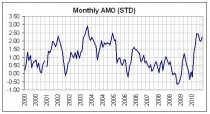
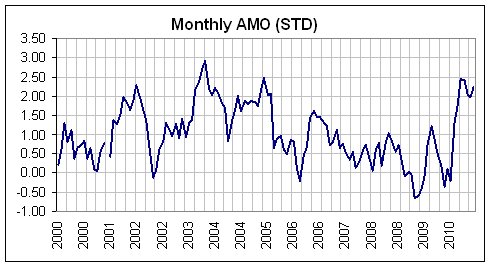
Though the PDO has turned negative (suggesting more La Ninas and a cooling period ahead), the AMO which had peaked in 2004 and 2005 and dropped to slightly negative a couple of years ago jumped to high positive levels this year. This was in part due to lack of tropical activity in the El Nino summer of 2009 which left the tropical Atlantic warmer than normal (hurricane activity serves to remove heat from the tropics and move it to the higher latitudes).
This last winter the suppression of the jet stream well south of normal by the high latitude blocking led to weaker winds and fewer clouds over the subtropics, allowing the warmth to build further. In high latitudes, blocking high pressure replaced normal North Atlantic storms which stir up the water. This has allowed the waters there too to be warmer than normal (below, enlarged here).
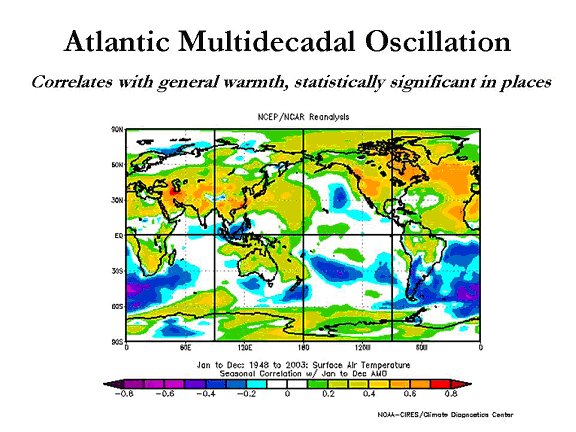
The active tropical season this year is removing ocean heat this year and as they track to the north increase the mixing there. AMO should drop in upcoming months. A positive AMO correlates with warm hemispheric temperatures, a negative with cold (below, enlarged here).

See an excellent AMO analysis here.
See PDF on this post here.