


By Joseph D’Aleo, CCM
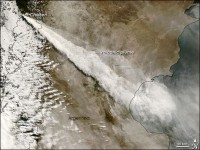
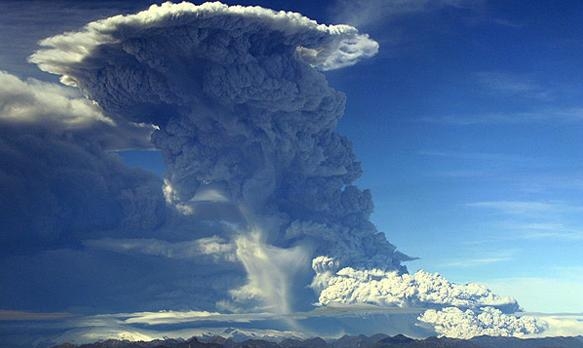
The news is reporting a relatively large and long lasting volcanic eruption in Chile. According to the AP, the Chaiten volcano spewed lava and blasted ash 20 miles (105,000 feet) into the sky on Tuesday the largest ruption to date since the volcano came back to life last week, prompting a total evacuation of the provincial capital and other settlements. The volcano’s long lasting eruption has sent a thick column of ash into the stratosphere, streaming across Patagonia to the Atlantic.
In earlier stories, we noted that there are usually 8 to 12 volcanic eruptions on-going at almost all times. Most are the small guys which emit just lava or if eruptive have their ash and gas clouds only reaching thousands to a few tens of thousands of feet in the air, remaining within the troposphere where the ash and gases quickly falls or gets rained out within a few days or weeks.
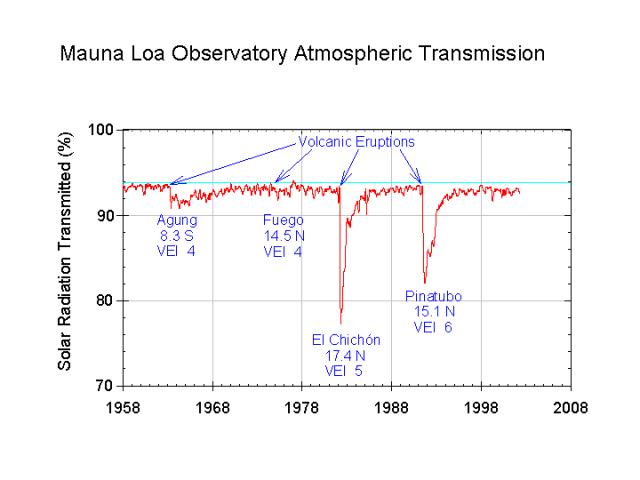
It is the bigger eruptions that reach above this tropospheric layer into the more stable stratosphere that can have long lasting (up to several years) and extent effects (global). Pinatubo in 1991 reached over 110,000 feet and El Chichon 105,000 feet in 1982. Both Mt. St. Helens in 1980 and Cerro Hudson in 1991 reached around or just over 60,000 feet. The activity has not ceased and it is still possible a larger eruption will follow. The long lasting (5 days plus) nature of this eruption adds to the likelihood of an effect. But so far according to Simon Carn, a University of Maryland-Baltimore volcanologist who uses satellites to measure volcanic gases, Caiten had so far only emitted a few thousand tons of sulfur dioxide, small by comparison to Pinatubo which emitted 20 million tons. According to Alan Robock, a Rutger’s volcanologist at least a million tons must be emitted to really make a difference. He also noted that because of it high latitude location, any affect may be mainly limited to the Southern Hemisphere.
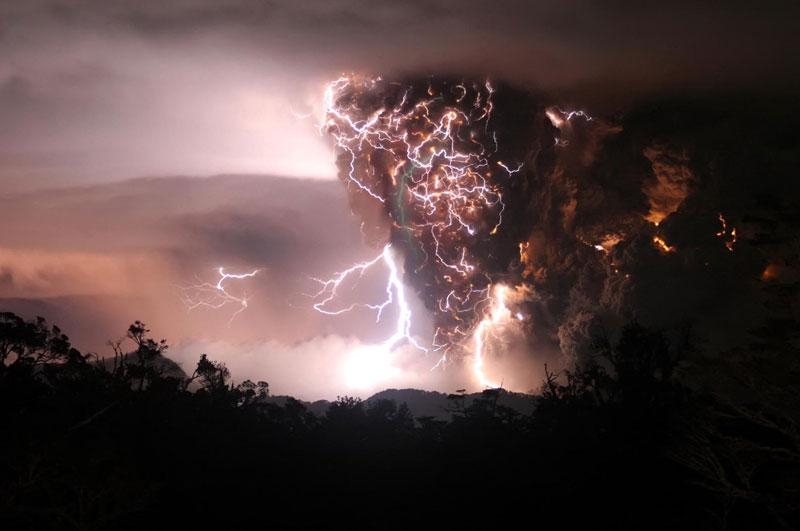
See larger image here. See video of the eruption here. See some amazing photographs here and here.
Note how much a major eruption can reduce incoming solar energy. This would add to the global cooling from the ocean flips and the a super long cycle 23 and possibly quiet solar cycle 24.
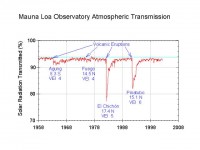
See larger graph here.
We have written on volcanic potential effects here and here.
One other note, back over a decade ago, there was some speculation that volcanic activity led to El Nino development as the ash reduced the thermal and thus pressure gradients and through them the equatorial easterlies, reducing cold water upwelliing in the eastern Pacific and favoring the sloshing east of warm water from the western Pacific. Anecdotally the super El Nino of 1982/83 followed El Chichon and the El Ninos of 1991/92 and 1992/93 followed Pinatubo and Cerro Hudson. Stay tuned as additional assessments are made of how much Chaiten may play a role on what’s ahead.
Testing The WatersInvestor’s Business Daily
Proving the advantage of actual observations, German researchers say Earth will stop warming for at least a decade. It seems ocean currents, not SUVs, help determine the temperature of Earth.
When the United Nations World Meteorological Organization recently reported that global temperatures had not risen since 1998, the explanation given by WMO Secretary-General Michel Jarraud was that the cool spell was the effect of the Pacific Ocean’s La Nina current, “part of what we call ‘variability.’ “ Well, oops, the Earth will do it again. According to a report by German researchers published in Thursday’s issue of the journal Nature, shifting Atlantic ocean currents will cool parts of North America and Europe over the next decade as well.
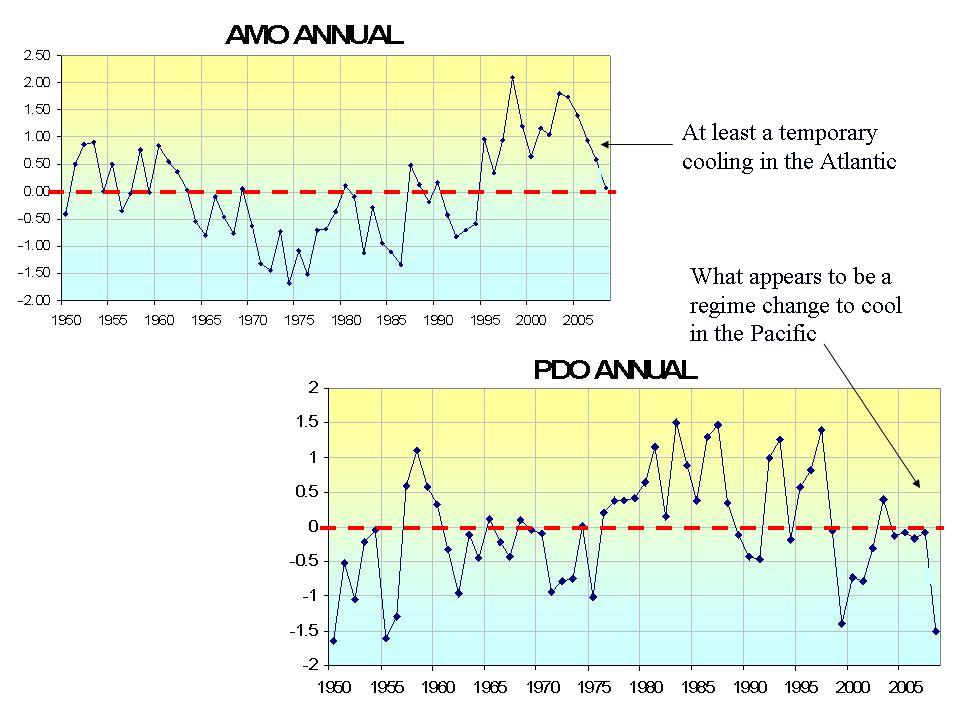
Noel Keenlyside of the Leibnitz Institute of Marine Science at Germany’s Kiel University says “in the short term, you can see changes in the global mean temperature that you might not expect given the reports of the Intergovernmental Panel on Climate Change.” The key to the Kiel team’s prediction is the natural cycle of ocean currents called the Atlantic Multidecadal Oscillation, or AMO for those who aren’t oceanographers or don’t play Scrabble. The AMO is closely related to the warm currents that bring heat from the tropics to the coasts of Europe and North America. The cycle is not well understood, but is believed to repeat every 60 to 70 years.
Understanding the ocean’s effect on climate took a quantum leap forward in 2003 when the first of 3,000 new automated ocean buoys were deployed, a significant improvement over earlier buoys that took their measurements mostly at the ocean’s surface. Understanding the ocean’s effect on climate took a quantum leap forward in 2003 when the first of 3,000 new automated ocean buoys were deployed, a significant improvement over earlier buoys that took their measurements mostly at the ocean’s surface. The Argos buoys have disappointed global warming alarmists in that they have failed to detect any signs of imminent climate change. As Dr. Josh Willis noted in an interview with National Public Radio, “there has been a very slight cooling” over the buoy’s five years of observation.
Actual observations trump computer models and as we learn more about the Earth we start to realize how puny and irrelevant man’s contribution to climate change really is. While irresponsible environmentalists panic over warming, the Earth cools and goes with the ocean flow. Read this full story here.
Scroll down in COLD STORAGE to see more stories on the PDO and AMO and their importance to weather and climate.
By Joseph D’Aleo, CCM
In part I of a four part series on Intellicast.com (here) on the importance of the oceans to climate and weather, I discussed the Pacific Decadal Oscillation (PDO) and its impact on the frequency of El Ninos and La Ninas, which have an effect on the position of global troughs and ridges and through them global patterns of temperatures and precipitation. In Part 2, this week, I addressed the Atlantic Multidecadal Oscillation and its effects on hurricanes and through the NAO on winter cold and snow and how it works together with the PDO to modulate temperatures.
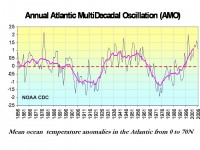
The Atlantic also has a multidecadal oscillation called the Atlantic Multidecadal Oscillation or AMO which has a period of about 30 to 35 years per phase (a cycle length of around 70 years). The UN IPCC concludes the oscillations of the Atlantic Multidecadal Oscillation (AMO) is likely due to changes in the strength of the thermohaline circulation. Dr. William Gray of Colorado State University has talked about this for years and continues to do so in his seasonal outlooks and presentations.
See full size image here
The IPCC AR4 even discussed how Walter and Graf (2002) related the AMO with the NAO (North Atlantic Oscillation) a better known more variable atmospheric flip flop in the central and eastern North Atlantic. This relationship was shown to be strongly negative during the cool (negative) phase of the AMO but weaker with the warm (positive) phase. When the NAO is negative, it often means cold and snow for parts of western Europe and the eastern united States in winter. A positive AMO in summer often means warmer temperatures and more and stronger Atlantic basin hurrricanes.
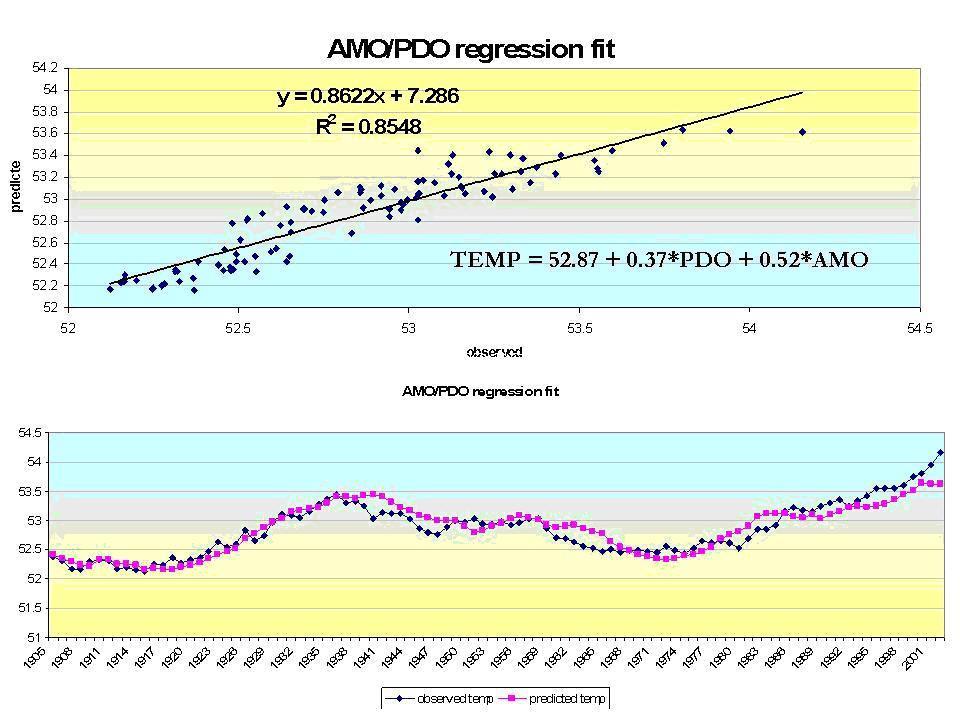
I showed how when regressed AMO and PDO with temperatures, it helped to explain much of the multidecadal variability in temperatures we find in the United States. With the PDO now negative and the AMO diminishing, this would suggest cooling as the story shows it appears has started.
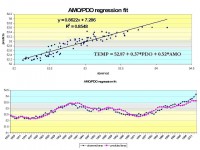
See full size image here. See image of latest PDO and AMO trends here
See the full Intellicast story here.
Part 3 May 11th will look at how the PDO and AMO correlate well with both Greenland and Arctic temperatures and explain the decadal changes in ice cover. Recent stories in the media are predicting another big melt. We will show how that is not at at unprecedented (happens predictably every 60 years of so) and entirely natural. Part 4 on May 17th will focus on what the PDO and AMO states mean for landfalling hurricane threats.
By Joseph D’Aleo, Intellicast.com, April 28, 2008
In this version of the weekly Dr. Dewpoint series on Intellicast, the El Nino dominance since the late 1970s is explained.
John McLean in a paper here reported Australia’s CSIRO and Bureau of Meteorology (Power and Smith 2007) wrote about a period of unprecedented El Nino dominance the last 30 years, which they blamed on human activity. Vecchi (2006, 2007) speculated there was a just 1% probability that this was due to natural events.
McLean’s paper and the following discussion will show how the change had precious little to do with anthropogenic factors but was the result of a natural large scale cyclical climate flip-flop known now as the Pacific Decadal Oscillation.
The first hint of a basin wide cycle was a recognition of a major regime change in the Pacific in 1977 among climatologists that became known as the Great Pacific Climate Shift. Later on this shift was shown to be part of a cyclical regime change given the name Pacific Decadal Oscillation by Mantua (1997). This followed research first showing decadal like ENSO variability by Zhang in 1993.
Mantua found the Pacific Ocean temperature regime and overlying pressure patterns tended to persist in one mode (in terms of ocean temperature anomalies and overlying pressure and wind patterns) for two or three decades and then flip to very nearly the opposite mode for a similar period. The IPCC in their latest report (2007) also showed how during the positive phase of the PDO, the sea surface temperature pattern suggested more warmth in the eastern tropical Pacific (thus more El Ninos).
HAVE WE EXPERIENCED GREAT PACIFIC CLIMATE SHIFT II - A REGIME CHANGE IN PDO?
The PDO appears to have changed back to the cold mode in 1998 following the Super El Nino of 1997/98. Three straight years of La Nina followed. PDO bounced some during the early 2000s but this year dropped off dramatically again this past year as a strong La Nina developed. Since it is 30 years since the last climate shift, it appears likely this negative mode should continue.
See the full size graph here. See the full image filled blog describing how the PDO influences ENSO frequency and global temperatures here.
By Deroy Murdock, Scripps Howard News Service
“Disconcerting as it may be to true believers in global warming, the average temperature on Earth has remained steady or slowly declined during the past decade, despite the continued increase in the atmospheric concentration of carbon dioxide, and now the global temperature is falling precipitously.” Dr. Phil Chapman wrote in The Australian on April 23. “All those urging action to curb global warming need to take off the blinkers and give some thought to what we should do if we are facing global cooling instead.” Chapman neither can be caricatured as a greedy oil-company lobbyist nor dismissed as a flat-Earther. He was a Massachusetts Institute of Technology staff physicist, NASA’s first Australian-born astronaut, and Apollo 14’s Mission Scientist. Chapman believes reduced sunspot activity is curbing temperatures. As he elaborates, “there is a close correlation between variations on the sunspot cycle and Earth’s climate.”
Anecdotally, last winter brought record cold to Florida, Mexico, and Greece, and rare snow to Jerusalem, Damascus, and Baghdad. China endured brutal ice and snow. NASA satellites found that last winter’s Arctic Sea ice covered 2 million square kilometers (772,000 square miles) more than the last three years’ average. It also was 10 to 20 centimeters (about 4-8 inches) thicker than in 2007. The ice between Canada and southwest Greenland also spread dramatically. “We have to go back 15 years to find ice expansion so far south,” Denmark’s Meteorological Institute stated. “Snows Return to Mount Kilimanjaro,” cheered a January 21 International Herald Tribune headline, as Africa also defies the “warming” narrative.
While neither anecdotes nor one year’s statistics confirm global cooling, a decade of data contradicts the “melting planet” rhetoric that heats Capitol Hill and America’s newsrooms.
AccuWeather’s Expert Senior Forecaster Joe Bastardi has stated: “People are concerned that 50 years from now, it will be warm beyond a point of no return. My concern is almost opposite, that it’s cold and getting colder.” And on Wednesday, the respected journal, Nature, indicated that Earth’s climactic cycles have stopped global warming through 2015.
If nothing else, all this obliterates the rampant lie that “the scientific debate on global warming is over.” That debate rages on. Assuming that the very serious scientists cited here are correct, the “inconvenient truth” about global-warming is inconveniently false. If so, mankind should chill out and turn our thinking right side up. Read more here.
Nature News
Antarctica’s deep ocean waters are getting colder after years of warming, say researchers who have just returned from a Southern Ocean voyage aboard the German research vessel Polarstern.
Samples from previous expeditions showed that water at a depth of 4,500 metres in the Weddell Sea warmed by a tenth of a degree Celsius between 1989 and 2005, although the warming trend may have begun earlier. The latest work, by researchers from the Alfred Wegener Institute for Polar and Marine Research in Bremerhaven, found that temperatures have cooled slightly since 2005, suggesting that more cold surface water is reaching the deep ocean, perhaps as a result of changes in sea-ice coverage and atmospheric conditions. The team plans to revisit the region during the summer of 2010–11. See story here.
Alfred Wegener for Polar and Marine Research
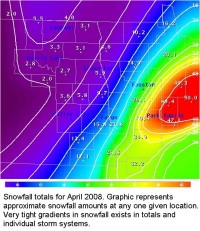
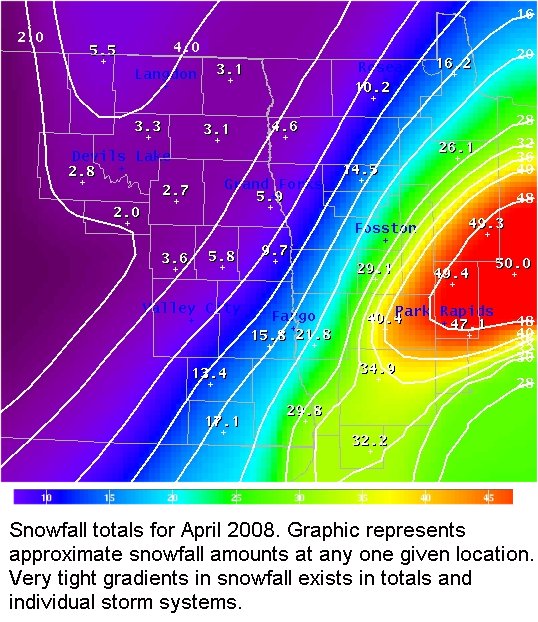
Record April Snowfall
A series of early spring snow storms have dropped unusually heavy snowfall across a large portion of the Red River Valley and Minnesota lakes country. This has resulted in record or near record snow totals for the month of April. See some amazing April totals (up to 50 inches near Park Rapids, MN) here. Thanks to Daryl Ritchison
WDAY/Z Meteorologist for the tip.
See full size image here
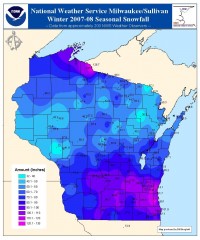
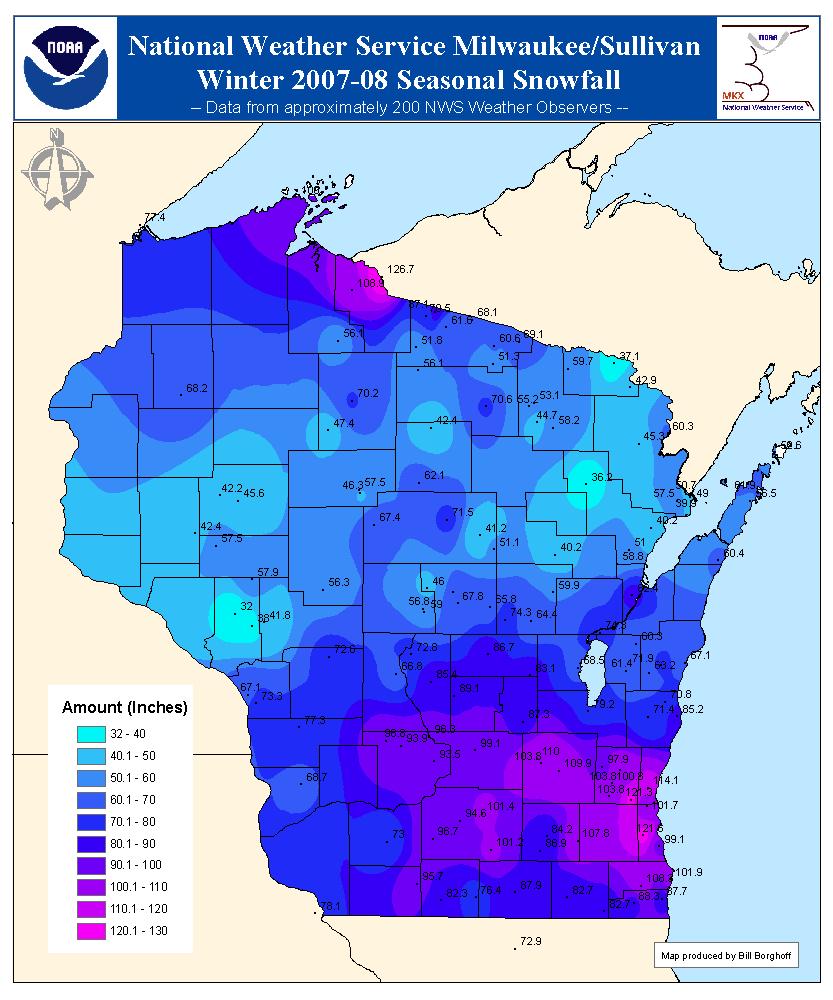
On this Milwaukee, WI NWS site, see that up to 120 inches fell in southeast Wisconsin with many all time records.
See full size image here
In this Australian Broadcasting Corporation story, Australian ski resorts are bracing themselves for a bumper season, after freak snowfalls dumped around 20 centimetres of snow. “May is more usual, and then definitely through the winter months, but at the end of April is still a bit of a surprise.”
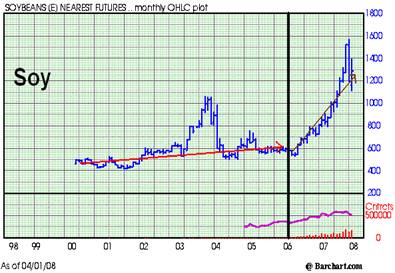
The 2005 Energy bill mandated that 4 billion gallons of renewable fuel (mostly corn-based ethanol) must be added to the gasoline supply in 2006. That amount rises to 4.7 billion gallons in 2007 and 7.5 billion in 2012. This still represents a small fraction of the estimated 140 billion gallons of gasoline the US consumes every year. But it is the subsidies and tax credits that have made this ethanol market what it is - without government interference, consumer-driven demand would be nothing and the ethanol market would be SIGNIFICANTLY SMALLER.
Look at the monthly charts for corn, wheat, and soy (soy shown below) - the line denoting the start of 2006. Notice that all of the commodities were increasing gradually from 2000-2005, but from the beginning of 2006 until the present, these commodities have sky-rocketed. This coincides exactly with the beginning of the ethanol mandate on gasoline.

See larger image here.
To be fair, we can also see that the number of contracts traded rose significantly in early 2006 and have gone up steadily ever since. Prior to 2006, not many people traded or invested in the grains markets - however, this has changed drastically over the past couple of years. This is contributing to the higher prices as well, because more buyers lead to higher prices (not many are shorting these commodities). Also, there has been tremendous index buying the past couple of years (Goldman-Sach’s/S&P Commodity Index, Dow Jones-AIG commodity index, for example), which is contributing to the high volume and higher prices - these index funds have allowed the general population to “safely” invest in commodities now, a market that used to be only for the brave, bold, and informed. It is clear to see that these two things came together just at the right time to push grains through the roof the past couple of years. However, this would not be what it is, were it not for the government-forced ethanol mandate. read full post and see all three grain charts here.
By Eric Berger, Houston Chronicle
By pioneering the science of seasonal hurricane forecasting and teaching 70 graduate students who now populate the National Hurricane Center and other research outposts, William Gray turned a city far from the stormy seas into a hurricane research mecca. But now the institution in Fort Collins, Colo., where he has worked for nearly half a century, has told Gray it may end its support of his seasonal forecasting.
As he enters his 25th year of predicting hurricane season activity, Colorado State University officials say handling media inquiries related to Gray’s forecasting requires too much time and detracts from efforts to promote other professors’ work. But Gray, a highly visible and sometimes acerbic skeptic of climate change, says that’s a “flimsy excuse” for the real motivation - a desire to push him aside because of his global warming criticism. Among other comments, Gray has said global warming scientists are “brainwashing our children.”
Not only does this internal dispute reveal a bit of acrimony at the end of Gray’s long career at CSU; it highlights the politically charged atmosphere that surrounds global warming in the United States. “Bill Gray has come under a lot of fire for his views,” said Channel 11 meteorologist Neil Frank, a former director of the National Hurricane Center and a friend of Gray’s. “If, indeed, this is happening, it would be really sad that Colorado State is trying to rein in Bill Gray.” CSU officials insist that is not the case.
Gray has been highly critical of a former student, Greg Holland, who is among the most visible U.S. scientists arguing about the dangers posed by global warming. Gray’s comments about Holland include referring to him as a member of a “Gang of Five” that is interested in using scare tactics to increase research funding. His views on the climate - he says Earth is warming naturally and soon will begin cooling - have been applauded by some scientists, particularly meteorologists such as Frank. But they are out of step with mainstream climate science. Read more here.
Sherwood, Keith and Craig Idso, CO2 Science
In the introduction to their illuminating paper, the authors (Zhang, etal 2007) say they previously studied “a long span of Chinese history and found that the number of war outbreaks and population collapses in China is significantly correlated with Northern Hemisphere temperature variations and that all of the periods of nationwide unrest, population collapse, and drastic change occurred in the cold phases of this period.” In their current study, they write that they “extend the earlier study to the global and continental levels between AD 1400 and AD 1900.” This they do by using high-resolution paleoclimate data to explore “at a macroscale” the effects of climate change on the outbreak of war and population decline in the pre-industrial era as discerned by analyses of historical socioeconomic and demographic data.
In describing their findings, the five scientists say their newest analyses, like their earlier ones, show that “cooling impeded agricultural production, which brought about a series of serious social problems, including price inflation, then successively war outbreak, famine, and population decline.” And they suggest, as they put it, that “worldwide and synchronistic war-peace, population, and price cycles in recent centuries have been driven mainly by long-term climate change,” wherein warm periods were supportive of good times and cooling led to bad times, some of which (in our opinion) could arguably be described as a descent into hell.
Interestingly, after having presented an essentially ironclad case for their finding that warmer periods throughout human history have almost always been more conducive to good times than bad times throughout the majority of the Northern Hemisphere, Zhang et al. conclude their paper by suggesting just the opposite, i.e., that bad times would likely follow any future global warming that might occur, throwing all of their findings to the wind and listing as their reason for doing so the usual litany of unduly-catastrophic consequences that climate alarmists insist will follow any temperature increase that might occur, while stating that “the current high global average temperature (which has never been experienced in the last two millennia) is continuing to rise at an accelerated speed.”
Apparently, Zhang et al. are not aware of the fact that the projected consequences of projected global warming (among which they list negative impacts on agriculture, sea level, tropical diseases, extreme weather and ice sheet status) are way overblown, as may be readily verified by perusing the various materials archived on our website that pertain to these subjects. And they are apparently equally unaware of the fact that the current global average temperature is not the highest of the last two millennia (see, for example, our Medieval Warm Period Project) and that earth’s mean global temperature is not rising “at an accelerated speed.” In fact, mean global temperature has not risen perceptibly over the entire past decade! Clearly, Zhang et al.’s primary findings are right on the mark, but their abandonment of them in their concluding discussion in an attempt to remain politically correct should be an affront to all serious-minded people, as should their uncritical acceptance of standard climate-alarmist extremism and their two important factual errors. Read full review here.
Encouraging news reported by Anthony Watts who visited Asheville’s National Climate Data Center this week and presented his surface station findings to NCDC and heard about NCDC’s plans to modernize and fix the issues that are making climate change assesssment an impossible task. This press release was issued on the 24th by NOAA. Of course it will be years or even decades before we have critical mass to benefit from the new data although we can hopefully use it sooner to quality check the other sources.
NOAA today announced it will install the last nine of the 114 stations as part of its new, high-tech climate monitoring network. The stations track national average changes in temperature and precipitation trends. The U.S. climate Reference Network (CRN) is on schedule to activate these final stations by the end of the summer.
NOAA also is modernizing 1,000 stations in the Historical Climatology Network (HCN), a regional system of ground-based observing sites that collect climate, weather and water measurements. NOAA’s goal is to have both networks work in tandem to feed consistently accurate, high-quality data to scientists studying climate trends. The CRN is helping to pinpoint the shifts in America’s changing, often unpredictable, climate. “We’re entering a new age of understanding climate change, by adding more sound, reliable data about what’s really happening in the atmosphere and on the ground, “ said Dr. Tom Karl, director of NOAA’s National Climatic Data Center in Asheville, N.C. Karl, one of the world’s leading experts on climate change, helped spearhead the new climate network’s development.
“Very high accuracy in the data collected is the key to getting a feel for the national trend. That’s what the Climate Reference Network is doing.” Karl said the placement of each CRN station is crucial to obtaining accurate information on current - and likely future - conditions. “All the stations are strategically placed in rural environments away from the influences of nearby urban areas that would confound the interpretation of any changes observed,” he said. See the complete press release.
See Anthony Watts accounts of the two day visit here and here.
By Bill Steffen on WOOD-TV Blog
Across almost all of North America, this has been the best, or one of the best seasons ever for those who love snow. Practically every ski are from Alaska across Canada in the Western U.S. - the Midwest and New England saw plenty of snow; some places reporting all-time record snow. Michael Berry, President of the National Ski Areas Assn. told the AP that “This could very well be a record year”. Pictured is the Brundage Ski Area in Idaho. They just received another 10 inches of snow and they’ll be open a THIRD bonus weekend into early May. This is the first time they have ever had lift service into May. This has been their 2nd snowiest winter ever with 422” so far.
Alyeska, Alaska has picked up 826” of snow this winter! On the summit, they still have 198” of snow on the ground. Timberline in Oregon plans on skiing through the summer on Mt. Hood. They are taking ski camp reservations for early August! They’ve had 780” of snow this winter and still have 237” of snow on the ground at the lodge, where the AM temperature is 20 degrees F. Whistler-Blackcomb in British Columbia is offering skiing into June. They’ve had 389” of snow this winter with a base of 94”. The Alta Ski Area in Utah has had 673” of snow this season. The Snowbird Resort in Utah says they’ll be open “through Memorial Day and maybe beyond!”.
Aspen Highlands in Colorado reports over 400” of snowfall since Nov. 30 (the state of Colorado reported over 25% more snow than average this winter. They are expecting the most runoff from snowmelt in the Colorado River Basin in at least 10 years. The Killington Ski Area in Vermont reported a whopping 282” of snow this winter. Last year and this year were the best back-to-back years for snow there since 1995-97. You may have heard that because of global warming we weren’t going to have any more snow. I can tell you as a meteorologist, first, that ain’t happenin’ now, and second that there will likely be plenty of snow in the coming years for those who want to get your skis on and enjoy winter on the slopes. Oh if you haven’t had enough winter, you might want to go here. See more here.
Update: Note from this story that 8 Colorado ski resorts set new records this season. Snowmass, (450 inches), Beaver Creek (430 inches), Crested Butte (422 inches), Monarch Mountain (482 inches), Powderhorn (320 inches), Silverton (550 inches), Steamboat (489 inches) and Telluride (353 inches).
By Tyler Olsen - Vernon, BC Morning Star
At any charity run or walk, weather can play havoc with the plans of organizers. But in the second half of April, the possibility of snow is, justifiably, confined to those certain scenarios so seemingly implausible as to not warrant a second thought. Not this year indeed. According to Environment Canada, chilly weekend temperatures shattered weather records dating back prior to the Great Depression.
The temperature only reached 2 degrees Saturday, besting (although that word may be inappropriate) the previous April 19 record low-high of 4.4 degrees, set in 1927. A similar record, one dating back to 1923, was put on ice Sunday, with a maximum high of just 6.2 degrees. And that night’s teeth chattering low of -6 degrees beat the old April 20 record of -4.4 recorded in both 1909 and 1957. While no firm data exists, the 10 millimetres of precipitation recorded at an automatic station was likely 10 centimetres of snow and probably set an April record, beating 7.6 centimetres recorded April 4, 1903.
At Environment Canada, Doug Lundquist was busy looking at record after record that had fallen to the nasty April weather. “I’ve looked at all sorts of records from across Southern B.C. and everywhere I look (records) are just falling like flies,” he said. However, Lundquist wasn’t ready to say global warming - or a lack thereof - played a role in the chilly weekend, instead attributing the frigid temperatures and snow to an Arctic front that got shuttled south by a upper low from the north. Read more here.
Also to the south, cold night in northern California are hitting vineyards throughout the region hard. After a long string of unseasonably low nighttime temperatures, officials estimate as much as 10 to 15 percent of Sonoma County’s $400 million crop has been lost to frost damage. The cold weather is also hurting vineyards in Mendocino and Lake counties, where damage to the crop is expected to be about 20 percent. In Napa County, a spokesman for Napa Valley Vintners says there has been little damage because most growers have adequate frost protection. See story here.
Icecap Note: That arctic trough will make its way into the central and eastern United States by next week putting to an end unusual warmth being enjoyed by many especially in the north central and far northeast where snow and cold dominated the long winter. Expect to see records fall and even some unusually late night-time snows as late as May 1 in some of the northern areas and higher elevations further south.
By Joseph D’Aleo, CCM
Tom Peterson of NCDC in the next Bulletin of the AMS will be co-authoring a paper Study: Global cooling a 1970s myth. In it he tries to downplay the cooling and the coverage and hype it received. Why the efforts to downplay the cooling? Like the Medieval warm period and Little Ice Age, the mid-20th century cold period has been a thorn in the side of alarmists because it implies natural factors at play. And remember a lot of the cooling came during the post World War II boom.
Mann did his best to do away with the Medieval Warm Period and his band of merry men are still trying to find proof it didn’t exist despite the steady stream of peer review papers that suggest it did and was not confined to Europe but was worldwide. CO2Science has done an excellent job collating those studies here while World Climate Report has done due diligence finding evidence not only that the Little Ice Age was real but was global (see latest here).
DATA CENTERS CONSISTENTLY ADJUST OLD DATA YET DOWNPLAY URBAN AND LOCAL FACTORS
In 2007, NCDC announced their latest “upgrade” to their USHCN data base that eliminates the Karl (1988) urban adjustment in the first version in favor of a change point algorithm that is supposed to detect changes in siting and urbanization. It is totally unclear how this method which looks for inflection points (sudden changes) in data trends would be able to detect and adjust for a town or city which slowly grows to expand its heat island to the airport often built on the outskirts of a town. Their new algorithms warmed the early 1900s, cooled slightly the middle 1900s and warmed the last decade. The result of this is that the peak in 2000 is higher relative to the peak in 1930 in the initial analysis. The changes made the US data look more like the global data with less of a dip down in the mid century and more recent warming. A little while back, NASA, announced that 2007 was the second warmest year on record tied with 1998 based on alterations to their adjustments (a very regular process it appears based on attempted analyses by Steve McIntyre) and their increased emphasis on polar regions compared to other data sets. Other data centers and the satellite data sets suggested it ranked much lower.
The national centers with their GISS, GHCN and CRU data bases do little to adjust for urbanization and local factors. The IPCC has bought into this despite the fact their have been numerous peer-reviewed papers that suggested contamination by urbanization, land use changes, station dropout (2/3rds of the world’s stations, mostly rural), missing data (again smaller stations), changes in siting, poor siting (a bigger problem than anyone imagined based on the good work of Anthony Watts and his volunteers) may be responsible for 30-50% of the warming of the last century. Tom Peterson’s 2003 work is responsible for most of the data centers downplaying urbanization. This study concluded: “Contrary to generally accepted wisdom, no statistically significant impact of urbanization could be found in annual temperatures.” It along with papers by Hadley’s David Parker in 2004 and 2006, which stated “globally, temperatures over land have risen as much on windy nights as on calm nights, indicating that the observed overall warming is not a consequence of urban development” were highly influential in the IPCC’s attribution analysis and modeling in AR4 and the decisions on how to handle urban data by NCDC (GHCN, USHCN), NASA (GISS) and Hadley CRU).
In this analysis in August 2007 by Steve McIntyre on Climate Audit, he accessed and worked with the data Peterson used in his analysis to show how urban differs markedly from rural data and is undoubtedly contaminating attempts to determine climate trends.

See full size image here
Read much more on this issue including more detail on Steve McIntyre’s analysis, a post by Roger Pielke Sr. on this same issue with a focus on Parker’s work and additional thoughts and comments and charts in this PDF here.
By William Yeatman, Times Dispatch Columnist
Seventeen years ago, post-Soviet Russia was a geopolitical doormat, too poor and weak to exert much influence beyond its borders. This month, at an international summit in Romania, Russia intimidated Western Europe into scuttling a proposal for NATO expansion. Historically, only war has caused rapid, profound shifts in the European balance of power. Russia’s rise, however, has a less malignant, if more bizarre, origin: German environmentalism.
Two decades of the world’s most stringent environmental regulations have made Germany, Europe’s largest economy, increasingly energy dependent on Russia, the world’s largest exporter of natural gas. That’s how Russian President Vladimir Putin persuaded a coalition of West European nations to oppose a proposal that would have expanded NATO, despite the fact that Russia isn’t even a member of the trans-Atlantic military alliance. In the aftermath of the Soviet Union’s collapse, Germany’s electricity sector enjoyed energy independence, thanks to extensive coal reserves and a large nuclear industry.
In the time since, coal and nuclear power have fallen afoul of the environmental movement, their regulatory burden has increased, and they have gone into decline. Coal has been targeted because its combustion releases the most greenhouse gas of any fossil fuel and Germany is a global leader in the rush to “do something” about climate change. In 1995, it passed sweeping emissions reductions into law, and the German legislature adopted the Kyoto Protocol in 2002. In this regulatory environment, investment in new coal-fired power plants is unthinkable. Nuclear power emits zero greenhouse gas, but most environmentalists oppose it because the waste it produces is difficult to store. In 2000, they prevailed upon the German government to issue a moratorium on new nuclear power plants. By 2022, nuclear will have been phased out.
Coal and nuclear power may have become unfashionable, but Germans still needed electricity. Like every nation, Germany aspires to economic growth, which requires ever more energy. In fact, Germany could have supplied much of its own natural gas needs with domestic reserves from the northwestern state of Niedersachsen, home to 9 trillion cubic feet of gas. However, this energy is off-limits because environmental regulations have curtailed the complete exploration and development of the area. Instead, Germany has met its growing demand with natural gas imports from Gazprom, a state-owned enterprise that has a legal monopoly on all natural gas exports from Russia. Imports have skyrocketed since the Cold War, and Russia now supplies more than 40 percent of German gas consumption. Read more here.
William Yeatman is an energy policy analyst at the Competitive Enterprise Institute.
On the topic of Russian Energy see the book By Michael Economides and Donna D’Aleo (my daughter) “From Soviet to Putin and Back, The Dominance of Energy in Today’s Russia” here.