


By Anthony Watts, Watts Up With That
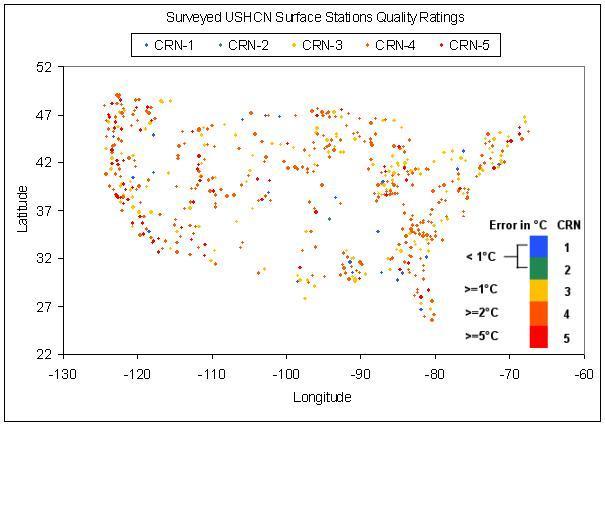
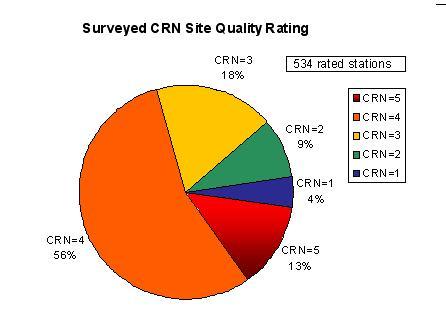
I’ve recently updated the http://www.surfacestations.org website with the latest surveys and numbers. We have 534 stations surveyed. Here is where we stand now with USHCN station surveys:
See full size map here

See full size pie chart here
Ratings in chart based on Climate Reference Network Rating Guide - adopted from NCDC Climate Reference Network Handbook, 2002, specifications for siting (section 2.2.1) of NOAA’s new Climate Reference Network. CRN categories 4 and 5 which total 69% of stations sited, have errors greater than 2C. See more here.
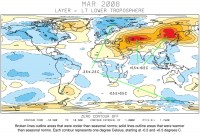
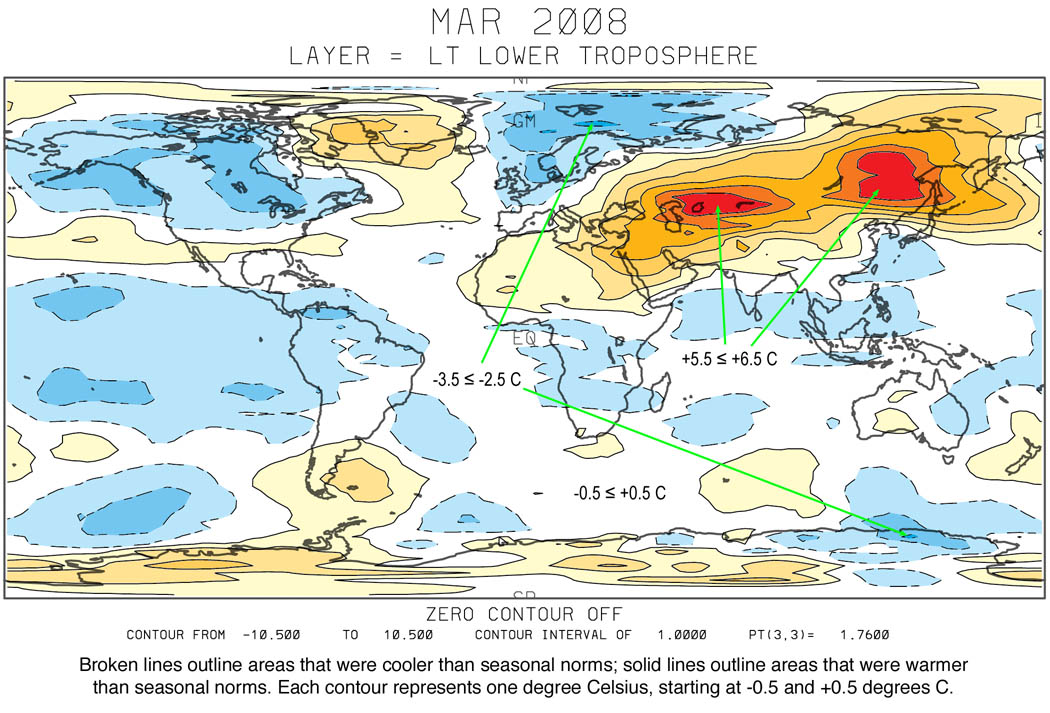
Global Temperature Report - March 2008By The University of Alabama in Huntsville
The La Nina cooling of the tropical atmosphere continued in March, with temperatures in the tropics falling to their coldest seasonally-adjusted temperature (-0.49 C below the 20-year average for March) since the La Nina of March 1989, according to Dr. John Christy, a professor of atmospheric science and director of the Earth System Science Center (ESSC) at The University of Alabama in Huntsville (UAH). Tropical temperatures in March 1989 dropped -0.72 C (1.3 degrees Fahrenheit) below seasonal norms.
March temperatures (preliminary):
Global composite temp.: +0.09 C (about 0.16 degrees Fahrenheit) above 20-year average for March.
Northern Hemisphere: +0.43 C (about 0.77 degrees Fahrenheit) above 20-year average for March.
Southern Hemisphere: - 0.25 C (about 0.45 degrees Fahrenheit) below 20-year average for March.
See the data here.
See full size image here
Icecap Note: See the warmth in Asia where extreme cold spread unusually far south this winter with heavy snow, leaving northern areas with less snow and cold. Snowmelt came early north and south. Anomalies this month are nearer normal there with very cold weather in Siberia and warm in central China. Note the cold North America temperatures where snowpack persisted. NOAA noted for the United States, the average temperature in March 2008 was 42.2 F. This was -0.4 F cooler than the 1901-2000 (20th century) average, the 52nd coolest March in 114 years.
By Patrick Michaels, Wall Street Journal
President George W. Bush has just announced his goal to stabilize greenhouse-gas emissions by 2025. To get there, he proposes new fuel-economy standards for autos, and lower emissions from power plants built in the next 10 to 15 years. Pending legislation in the Senate from Joe Lieberman and John Warner would cut emissions even further – by 66% by 2050. No one has a clue how to do this. Because there is no substitute technology to achieve these massive reductions, we’ll just have to get by with less energy.
The earth’s paltry warming trend, 0.31 degrees Fahrenheit per decade since the mid-1970s, isn’t enough to scare people into poverty. And even that 0.31 degree figure is suspect.
For years, records from surface thermometers showed a global warming trend beginning in the late 1970s. But temperatures sensed by satellites and weather balloons displayed no concurrent warming. These records have been revised a number of times, and I examined the two major revisions of these three records. They are the surface record from the United Nations’ Intergovernmental Panel on Climate Change (IPCC), the satellite-sensed temperatures originally published by University of Alabama’s John Christy, and the weather-balloon records originally published by James Angell of the U.S. Commerce Department.
The two revisions of the IPCC surface record each successively lowered temperatures in the 1950s and the 1960s. The result? Obviously more warming – from largely the same data. The balloon temperatures got a similar treatment. While these originally showed no warming since the late 1970s, inclusion of all the data beginning in 1958 resulted in a slight warming trend. In 2003, some tropical balloon data, largely from poor countries, were removed because their records seemed to vary too much from year to year. This change also resulted in an increased warming trend. Another check for quality control in 2005 created further warming, doubling the initial overall rate. There have been six major revisions in the warming figures in recent years, all in the same direction. Read much more here.
By Joseph D’Aleo
This month marks the first anniversary for Icecap. We have been growing steadily, almost exponentially. We had 500,000 hits in 2007 and 2,000,000 already in 2008. Unlike the alarmist blogs with blank checks from large environmental public relations corporations and foundations to spread the Gospel according to Gore, the climate realist blogs depend on small contributions from their readers. We received a large enough contribution from one private investor to get the site off the ground last year and incorporate. Since then we have been counting on donations from you our readers. Thanks to all of you who have donated over the last year.
It is for the most part a one man show like most blogs. I have to pay the bills so must do other projects, consulting, forecast and business development but try and put a few hours each day into keeping Icecap updated. Hopefully the site will continue to grow and donations will allow me to spend more and more time on writing blogs, and upgrade the site and I believe importantly, involve more of our experts on our site and support their efforts in the community on getting the truth heard.
Al Gore has his trained robots out there spreading his flawed message. Unfortunately his movie and many of our schools are indoctrinating and frankly frightening students into believing life as we know it is in jeopardy from this warming (never mind it stopped 10 years ago). Already the minor unneccesary steps taken have driven oil and food prices up to record levels (food prices reported to show the greatest increases in 17 years). Some of the proposed legislation in congress and steps taken or planned in the states threaten to put millions our of work and drive the costs of energy and food up sky high affecting the people who can least afford it the most. Suggestions how to best fight these actions are always welcomed. We will do our best to get the true story to you.
Our members and guest bloggers all acknowledge man plays a role in the climate through urbanization (population grew from 1.5 to 6.5 billion since 1900), land use changes like deforestation and to a small degree through our addition of gases and aerosols). We don’t trust the surface station data where siting of the majority of stations has been shown by Anthony Watts and his team of volunteers and Roger Pielke Sr. to be poor or very poor with a significant warm bias. We don’t trust the ever hanging adjustments made to the raw data by NOAA, GISS and Hadley. Thankfully we have satellite and buoy data as ground truth. They will show us when Hansen is out of line. We think and have shown the sun and oceans play a far more important role that is intentionally ignored because we can’t control or regulate them and make money from those efforts.
The $5 billion spent on global warming research and climate modeling should be spent instead on trying to understand the various ways the sun and oceans change and affect our climates. Understanding these factors will help us do a better job forecasting where climate really will be heading. NOAA’s Climate Prediction Center years ago decided climate models were the way to go and could be relied on to forecast the climate many months into the future, Over time, they recognized that the statistical models based on ENSO and other factors verified better because these climate models had issues forecasting the ocean changes (and solar influences) and they changed their focus to those statistical models, downplaying their climate models. I firmly believe statistical approaches using the PDO, AMO and solar cycles can do a better job in predicting future decades than the climate models. Also a better understanding of the sun’s real forcing and ocean processes at work would make the climate models in time more reliable.
The science is not settled, there is no consensus. As Michael Crichton said it so well “Historically the claim of consensus has been the first refuge of scoundrels: it is a way to claim to avoid debate by claiming the matter is already settled.” George Orwell said “In a time of universal deceit, telling the truth become revolutionary”. Revolution anyone?
Please help support Icecap and the other blogs often linked to here who are presenting the other side of the story the mainstream media refuses to report on so you can make informed decisions.
By William M. Gray and Philip J. Klotzbach, Colorado State University
In case, you missed it, Dr. Gray’s and Dr. Klotzbach’s 2008 April Hurricane Season Forecast is now available on-line. Please see the full April technical discusssion and forecast here. See the U.S. Landfalling Probability home page here. Here is a brief excerpt:
Information obtained through March 2008 indicates that the 2008 Atlantic hurricane season will be much more active than the average 1950-2000 season. We estimate that 2008 will have about 8 hurricanes (average is 5.9), 15 named storms (average is 9.6), 80 named storm days (average is 49.1), 40 hurricane days (average is 24.5), 4 intense (Category 3-4-5) hurricanes (average is 2.3) and 9 intense hurricane days (average is 5.0). The probability of U.S. major hurricane landfall is estimated to be about 135 percent of the long-period average. We expect Atlantic basin Net Tropical Cyclone (NTC) activity in 2008 to be approximately 160 percent of the long-term average. We have increased our seasonal forecast from early December. We forecast a probability of U.S. landfall at 95% (climatology is 84%), Gulf Coast 77% (climatology is 60%) and East Coast from Florida North 78% (climatology 61%).
This is the 25th year in which the CSU Tropical Meteorology Project has made forecasts of the upcoming season’s Atlantic basin hurricane activity. Our research team has shown that a sizable portion of the year-to-year variability of Atlantic tropical cyclone (TC) activity can be hindcast with skill exceeding climatology. These forecasts are based on a statistical methodology derived from 58 years of past data and a separate study of analog years which have similar precursor circulation features to the current season. We believe that seasonal forecasts must be based on methods that show significant hindcast skill in application to long periods of prior data. It is only through hindcast skill that one can demonstrate that seasonal forecast skill is possible. This is a valid methodology provided that the atmosphere continues to behave in the future as it has in the past.
Dr. Gray spoke at the Weather Conference in thr Bahamas as he does each year on hurrricanes and touched on global warming. Each year, there is some alarmist also present to counter Bill and all the other hurricane experts who agree with him. This year it was Tom Knutsen. See his arrogant and frankly weak dismissal of Dr. Gray’s compelling arguments that the variances of the thermohaline circulations are the primary control of the climate cycles and that we can not properly model the climate with all the complexities and greatly overstate the importance of CO2 (Bill’s full presentation soon to be visible on the Heartland ICCC conference web site) and defense of the climate models here.
By Art Horn, The Art of Weather
Things are really getting strange out there. Here’s how it all started. Last year the Supreme Court of the United States ruled that carbon dioxide is a dangerous pollutant. This was an amazingly stupid ruling. In doing so they gave the EPA (Environmental Protection Agency) the legal power to control it’s emission into the atmosphere from cars, trucks and you name it probably lawn mowers, charcoal grills and cigarettes. Now the Attorney General of the State of Connecticut Richard Blumenthal is suing the EPA to make them regulate the emission of carbon dioxide from Connecticut vehicles. Actually it’s Connecticut and about 17 other states that are doing this, of course the movement started in Massachusetts where Michael Dukakis learned that dirty water can lose you a presidential election a few years back.
The crazy part of all of this is that the Supreme Court made such a terrible ruling about CO2 in the first place. Carbon dioxide is NOT A POLLUTANT! Al Gore will tell you it is but he got a D and a C in the only intro science classes he took at Harvard so he is hardly the one to listen to. Besides he has a company in England, Generation Investment Management that makes money by scaring people about global warming. By the way do you know what a nursery will do to increase plant growth in their green houses? They pump it full of carbon dioxide, three times the levels that exist in the atmosphere. How can something that makes things grow be “a dangerous pollutant”. The answer is it can’t! Carbon dioxide is essential for life on our planet. Carbon dioxide gives and makes life possible. If carbon dioxide levels drop below 200 parts per million things stop growing. Carbon dioxide is plant food not poison, unbelievable. So something that makes life possible on our planet is now pollution apparently because it comes out of an exhaust of a car or some other motor that burns fossil fuels.
Well guess what else comes out of the exhaust of a car, yup water vapor. Oh it’s not very much, just a small amount but it’s still there. So what are we to do, I know lets call that pollution too! After all it makes things grow just like carbon dioxide. It’s at the root of all life on Earth just like carbon dioxide so what the hell let’s get water on the pollution list as well. We can regulate water with government laws made by attorney “generals” that circumvent the legislature with lawsuits so they can make their own laws. This is how much sense the Supreme Courts ruling makes. If you’re going to call carbon dioxide pollution apparently you must add water vapor to the list as well if not now then somewhere in the future. This is the twisted logic the Supreme Court of the United States has given us. We are dealing with a brave new world of global warming hysteria that defies historical common sense. Is this what they warned us about when the stories years ago talked about the dumbing down of America? Love that dirty water. Remember the song from the 60s? It was written about the Charles River in Massachusetts where it all began. See the pdf here
How Not to Measure Temperature Part 57By Anthony Watts
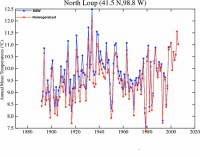
One of the surfacestations.org intrepid traveling volunteers, Eric Gamberg, has been traveling through Nebraska as of late, picking up stations as he goes. He recently visited the USHCN station of record in North Loup, NE. Records describe this station as being in a rural area, which is true. Notice all the shadows and the trees? Unlike many stations I’ve pointed out in the past, this station has an uncertain cooling bias from all the shade around it. The bias is variable, with seasons, with tree growth, tree pruning, and with windstorms that may remove leaves or whole branches from the trees. Other angles of this station are visible in the surfacestations.org gallery for this USHCN station.
One of the pictures caught my eye. It was a single picture of a Stevenson Screen at the neighbors location, which also has a significant shading issue with trees around the station. Since it appeared from that description that the station had been moved, I wondered if NOAA had logged the change, so I consulted the NOAA MMS database. The station map showed only two locations as being recorded for this station even though data goes back to 1892 and is used by GISS in their data plots.
I thought maybe I’d try looking at the GISTEMP record to see if I could find any obvious shifts in the data that might provide clues for a relocation. While it might look like there’s a jump coinciding with relocation, other stations in the area, within 100 KM had similar jumps around that time. So it appears the jump was natural, likely due to our rising El Nino year peaking in 1998, or we have another one of those data splicing errors like what was found back in August of 2007.
As a final check, I decided to look at the GISS Homogenized data plot for the North Loup station, and here is where the surprise came, the scales of the two graphs didn’t match. There was a .5 degree C difference in the Y scale. The Raw GISS plot topped at 12.5C while the Homogenized GISS plot topped at 12.0C. This was perplexing, so I thought I’d try a data overlay to see what had changed, and what I found was another one of those counter-intuitive downward homogenization adjustments which used the present as a hinge point and made the past cooler:
 \
\
See full size here
So this begs the question: Why is a station that is classified as rural, with an apparent cooling bias due to tree cover, with a long history containing only a few moves, in a small agricultural town with little growth in the last century get an adjustment like this that causes the past to get colder, and create an artificially enhanced positive slope of temperature trend? The nearest “large” city is Grand Island, NE, over 40 miles away. There is nothing but farmland all around North Loup, NE. I don’t care how you try to reason it, an adjustment for a station of this type wouldn’t need to be done for UHI. So what’s going on? Is this another one of those situation where other stations that have UHI that are within a larger radius are affecting this station and forcing an adjustment?
This is why I have trouble trusting GISS data. We keep finding instances like this one where the historical temperature record has been adjusted for no discernible or apparently logical reason. Cedarville, CA, which I previously highlighted is another prime example of a rural station with a long history, little growth, no UHI, but with an artificially enhanced positive temperature trend . This question needs to be answered. See full story here.
By Joseph D’Aleo, CCM
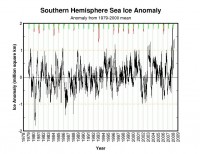
Last month, reports about the Wilkins Ice Sheet break-up were exaggerated in the media with headlines like “Bye-Bye Antarctica”. We posted several blogs in a reality-check response here, here and here. This week we posted a story where Roger Pielke Sr. reported on Climate Science on a paper in EOS that showed the melting this past summer was 40% below the average for the past 20 years.
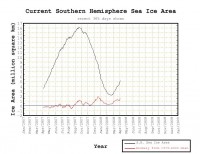
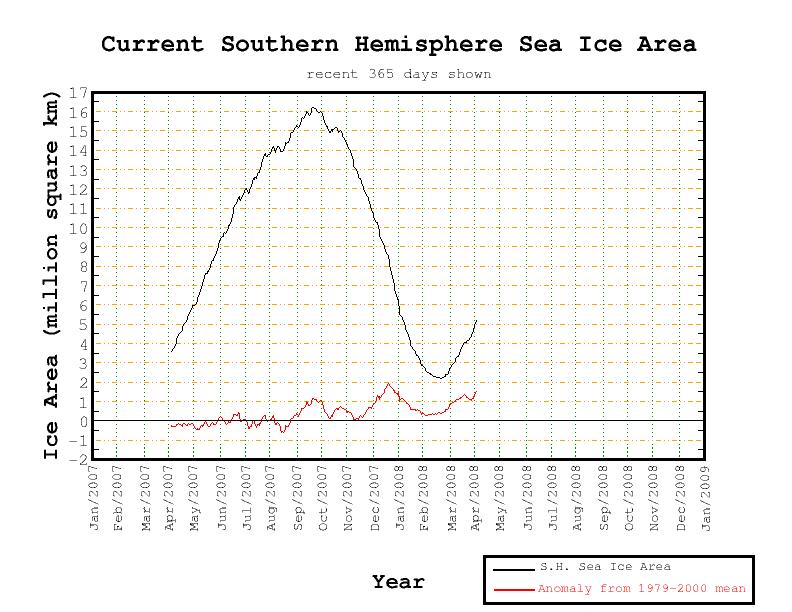
The plot of the total ice extent and anomaly (on the Cryosphere Today site of the Polar Research Group of the University of Illinois in Champaign Urbana) from the 1979-2000 mean over the last year showed there was hardly a blip in the big picture. It shows we continue to run well ahead of last year by about 2 million square kilometers.
See full size image here
Interestingly the anomaly is already second only to last year in the entire record going back to 1979.
See full size image here
Since we are just 2 weeks into the fall season and over 5 months away from the peak, it would seem likely were going to at least challenge the record from last year. You can be sure although the media was quick to jump on the Wilkins break-up, they will conveniently ignore this fact just as they did last year’s record. See pdf of this post here.
By Paul Driessen
Norman Borlaug just turned 94 - and is still going strong. He’s the father of the Green Revolution. Penn and Teller call him the greatest person in history. When the Nobel committee awarded him the 1970 Peace Prize, it said his work had saved a billion lives. Norman Borlaug turned 94 on March 25 and, despite cancer that had him sick and hospitalized a couple months ago, just attended a conference in Mexico on new rust-resistant wheat varieties and modern agricultural methods.
He is still “an Energizer Bunny,” his daughter Jeanie says. Decades ago, while neo-Malthusians were predicting mass famine, Borlaug used Rockefeller Foundation grants to unlock hidden (recessive) genes and crossbreed different wheat strains, to create new “dwarf” varieties that were resistant to destructive “rust” fungi. The shorter plants were also sturdier, put less energy into growing leaves and stalks, and thus had higher yields.
In 1985, he began working with former President Jimmy Carter to bring a Green Revolution to Sub-Saharan Africa, emphasizing intensive modern farming methods with new hybrid and biotech seeds on existing fields, to reduce the need to slash and burn wildlife habitat, as soil nutrients are exhausted. Unfortunately, their progress may be undermined by former UN Secretary General Kofi Annan and his misleadingly named Alliance for a Green Revolution in Africa. Annan says biotech crops are unsafe, untested, and likely to enslave poor farmers to mega-corporations and expensive seeds. He wants to battle Africa’s chronic poverty and malnutrition with “traditional seeds” and methods.
Dr. Borlaug fears that would be a devastating failure. As he said during a 2005 biotechnology conference, sponsored by the Congress of Racial Equality at the United Nations, he sees no way the world can feed its hungry population without genetically engineered (GE) crops, especially if it relies more on biofuels. He has little patience for “well-fed utopians who live on Cloud Nine but come into the Third World to cause all kinds of negative impacts,” by scaring people and blocking the use of biotechnology. These callous activists even persuaded Zambia to let people starve, rather than let them eat biotech corn donated by the USA. They also oppose insecticides to combat malaria - and fossil fuels, hydroelectric dams and nuclear power to generate abundant, reliable, affordable electricity for poor nations. Read the full tribute to this great man here.
Paul Driessen is senior policy advisor for the Congress of Racial Equality and Committee For A Constructive Tomorrow, and author of Eco-Imperialism: Green power Black death.
By Joseph D’Aleo, CCM
The BBC, UK Met Office and UN IPCC had to acknowledge that global temperatures have at least for the time being decoupled from the CO2 rise and levelled off or fallen (6-7 years). They are blaming the cooling on La Nina. They are of course correct, La Ninas global cooling just as El Ninos brings global warming. It must have pained them to do so as they have previously discussed these factors as being secondary to greenhouse gases and with impacts that were mainly regional in nature.
They promise once this event ends, their predicted warming will resume. It is likely that temperatures will bounce as the La Nina weakens but the real key as to where temperatures go over the next few years and decades is not increasing greenhouse gases but whether the multidecadal cycle in the Pacific (PDO) has transitioned back to the cold mode it was in when the earth cooled from the 1940s to the 1970s (and what happens with solar cycles 24 and 25, which many solar scientists the world over feel will revert back to the quiet modes of the so called Dalton Minimum in the early 1800s or possibly worse.)
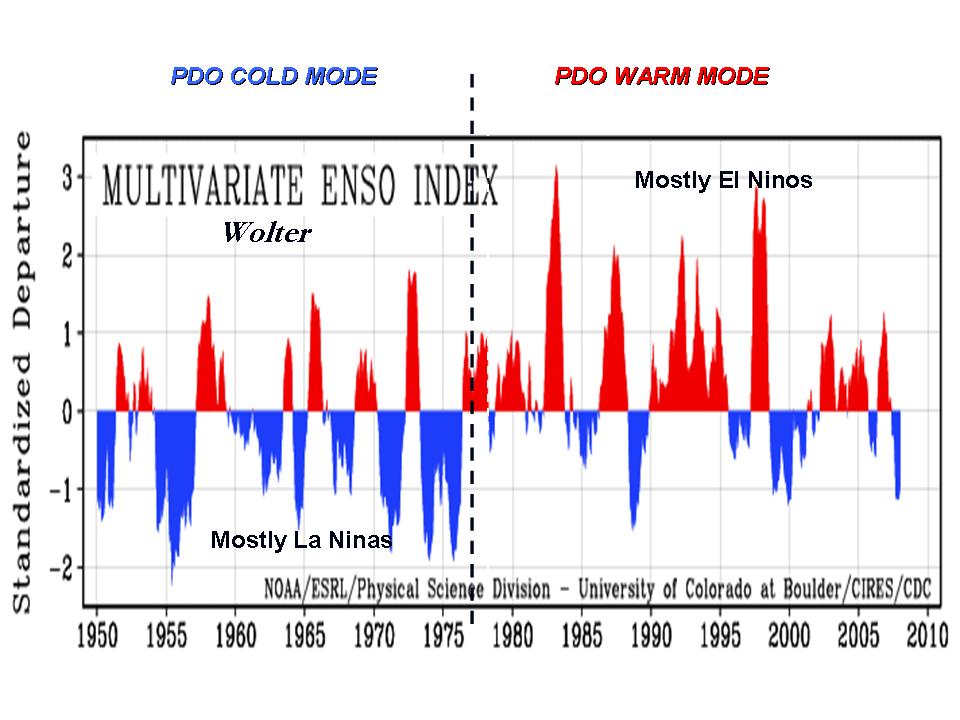
The PDO warm phase from 1977 to 1997 was dominated by mostly El Ninos (see why here) and since they correlate with warmer global mean temperatures, it is not surprising global temperatures rose. Alarmists blamed greenhouse gases but it was likely the PDO and the Grand Maximum of the longer term solar cycles. The prior three decades had mainly La Ninas with cold temperatures like this year in more years than not and solar cycle 20 which peaked around 1970 was relatively weak and longer in length. Not surprisingly global temperatures declined.

Wolter’s Multivariate ENSO Index (MEI). Red spikes with magnitudes >0.5 are El Ninos, dips in blue with magnitudes in excess of -0.5 La Ninas. See larger graph here
Then with the Great Pacific Climate Shift in 1977, the Pacific warmed and PDO turned positive. El Ninos dominated. You can see how the El Ninos in the satellite era since 1979 have been associated with global warmth.
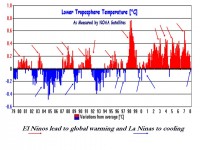
Note how El Ninos are invariably warm globally and La Ninas cool. Major volcanism in the early 1980s and 1990s are also seen producing cooling. See larger graph here
The PDO and the Atlantic Multidecadal Oscillation (AMO) have also been implicated in drought probabilities in an excellent paper done by Gregory J. McCabe, Michael A. Palecki, and Julio L. Betancourt in 2004. They found More than half (52%) of the spatial and temporal variance in multidecadal drought frequency over the conterminous United States is attributable to the Pacific Decadal Oscillation (PDO) and the Atlantic Multidecadal Oscillation (AMO). Recent droughts with broad impacts over the conterminous U.S. (1996, 1999-2002) were associated with North Atlantic warming (positive AMO) and northeastern and tropical Pacific cooling (negative PDO) (the bottom right map in the figure below). That is the case this summer.
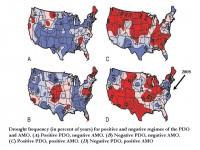
Warm Atlantic (warm AMO) tend to favor drought, the PDO determines where. See larger image here
Could 2008 Mauna Loa CO2 Monthly Maximum Come in Lower than 2007?
By Joseph D’Aleo, CCM
A meteorologist friend has informed me of a comment he has posted on Climate Audit.
Since the beginning of the Mauna Loa data stream in 1958, no annual mean period has been observed with a CO2 concentration lower than the previous year although it came close in the mid 1960s. There is a chance that this record may be broken in this year or next. In just a few instances has the annual maximum in CO2 been lower than the prior max. Since we are just two months away from the normal annual maximum which is currently well below last year’s max (see here) this will likely be one of those exceptional years. None of the AGW crowd has yet suggested that man-made CO2 has declined or that the trend in land use vis-a-vis CO2 has reversed.
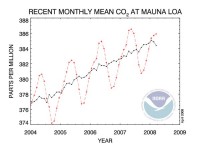
Black line represents seasonally adjusted values, red line the monthly observed values. See larger image here
I think that the anomalous decline in the slope of the Mauna Loa CO2 curve during this past boreal winter which is normally a season in which CO2 rises rapidly, is directly tied to the Central Pacific SST. Cooling SSTs raise the oceans’ solubility of CO2 which it then extracts from the atmosphere. In the 50-year history of the Mauna Loa record, the slope of the CO2 curve became more positive during the positive PDO regime, ~1975-2005, which favored warm Tropical SSTs (El Niños) with just a few brief La Ninas. PDO regimes usually last for about 30 years. Now that the PDO has shifted into a negative phase, we should see cooler La Nina patterns becoming more prevalent with fewer and briefer El Nino episodes. The 20th Century contained two positive PDO regimes and one negative one. Little wonder why there was a net rise in Globally averaged temperature during that period. Consistent on-site measurements of CO2 didn’t begin until the latter half of the last negative PDO. Furthermore, should CO2 concentrations at Mauna Loa now show a decline, it would suggest again that CO2 is a lagging indicator, not a leading one.
Skeptics continue to look for (and find) climate components that can be construed as falsifying the alarmist AGW hypotheses. Since the foundation of all of these hypotheses are a steady, if not accelerating, increase in man-made CO2, should we now see a year, just one year, in which total CO2 as observed at Mauna Loa shows a decline from the previous year(s) we may have found a smoking cannon.
[Some AGW proponents will say that the current cooling is not a result of CO2 but can be blamed on La Nina and should be ignored. That’s simple sophistry. La Nina is at least as much a component of the Global climate system as is CO2 and according to AGW alarmists, a CO2 driven warming should precede changes in SST, not follow it.]
Icecap Note: Another poster noted this is the second largest winter decline in the record trailing only 1971/72. Most years the rise from March to May is at least 1 ppm which would mean, we will see a higher max but a year-to-year increase much smaller than recent years.
By Dr. Fred Ward Op Ed in the Machester Union Leader
In the New Hampshire Union Leader this past summer, I exchanged some opinions on global warming with Dr. Cameron Wake of the University of New Hampshire. With this long, cold winter winding down, it is time to revisit the discussion. The debate started with Wake calculating that the winter temperatures in New England had warmed by 1 1/2 degrees per decade for the last three decades of the last century, or more than 4 degrees! He concluded that this extreme warming was likely due to increased carbon dioxide (CO2) emissions caused by man’s activities.
Moreover, he warned that if we continued to pump CO2 into the air, we would likely see this warming of 1 1/2 degrees per decade continue into the present century. He also made some dire predictions of the effect of this continued warming on all manner of biological plants and animals, right down to the final New England skier. We have just finished the ninth of the 10 winters of the first decade of this century, an appropriate time to look at the latest data. Did the rise of 1 1/2 degrees per decade (1 1/3 degrees for these nine winters) continue with its attendant catastrophic consequences?
The data for the first five years of the new millennium, 1999-00 to 2003-04, yield an average winter temperature of 24.6 degrees, and a temperature for the most recent four winters of 25.9. But if Wake’s expected warming continued (1 1/3 degrees for 9/10th of another decade), we should have found a temperature for the 2004-05 to 2007-08 winters of between 28 and 29 degrees. Not only did the winter temperature not rise to 28.4 degrees, as Wake projected, it actually fell one to two degrees toward the levels we’ve been seeing all our lives. This reversal from warming to cooling occurred despite continuing increases in man-made carbon-dioxide emissions. Wake’s pessimistic forecast of catastrophic increases in temperature have simply not comported with reality.
Wake also pointed out that there was a decrease in the winter snowfall in New England in recent times, implying a trend likely to continue. So where did all this snow come from? Read more and comments here. Note: Concord, New Hampshire had a record snowy December to February period and for the entire season is second only to 1873/74. Also St Johnsbury, Vermont yesterday set a new record for seasonal snow when they reached 139.1 inches, breaking the prior record set in 1968/69. Records there extend back to 1894.
Fred Ward of Stoddard has a Ph.D. in meteorology from Massachusetts Institute of Technology and was a meteorologist on Channel 7 in Boston in the 1960s and 1970s.
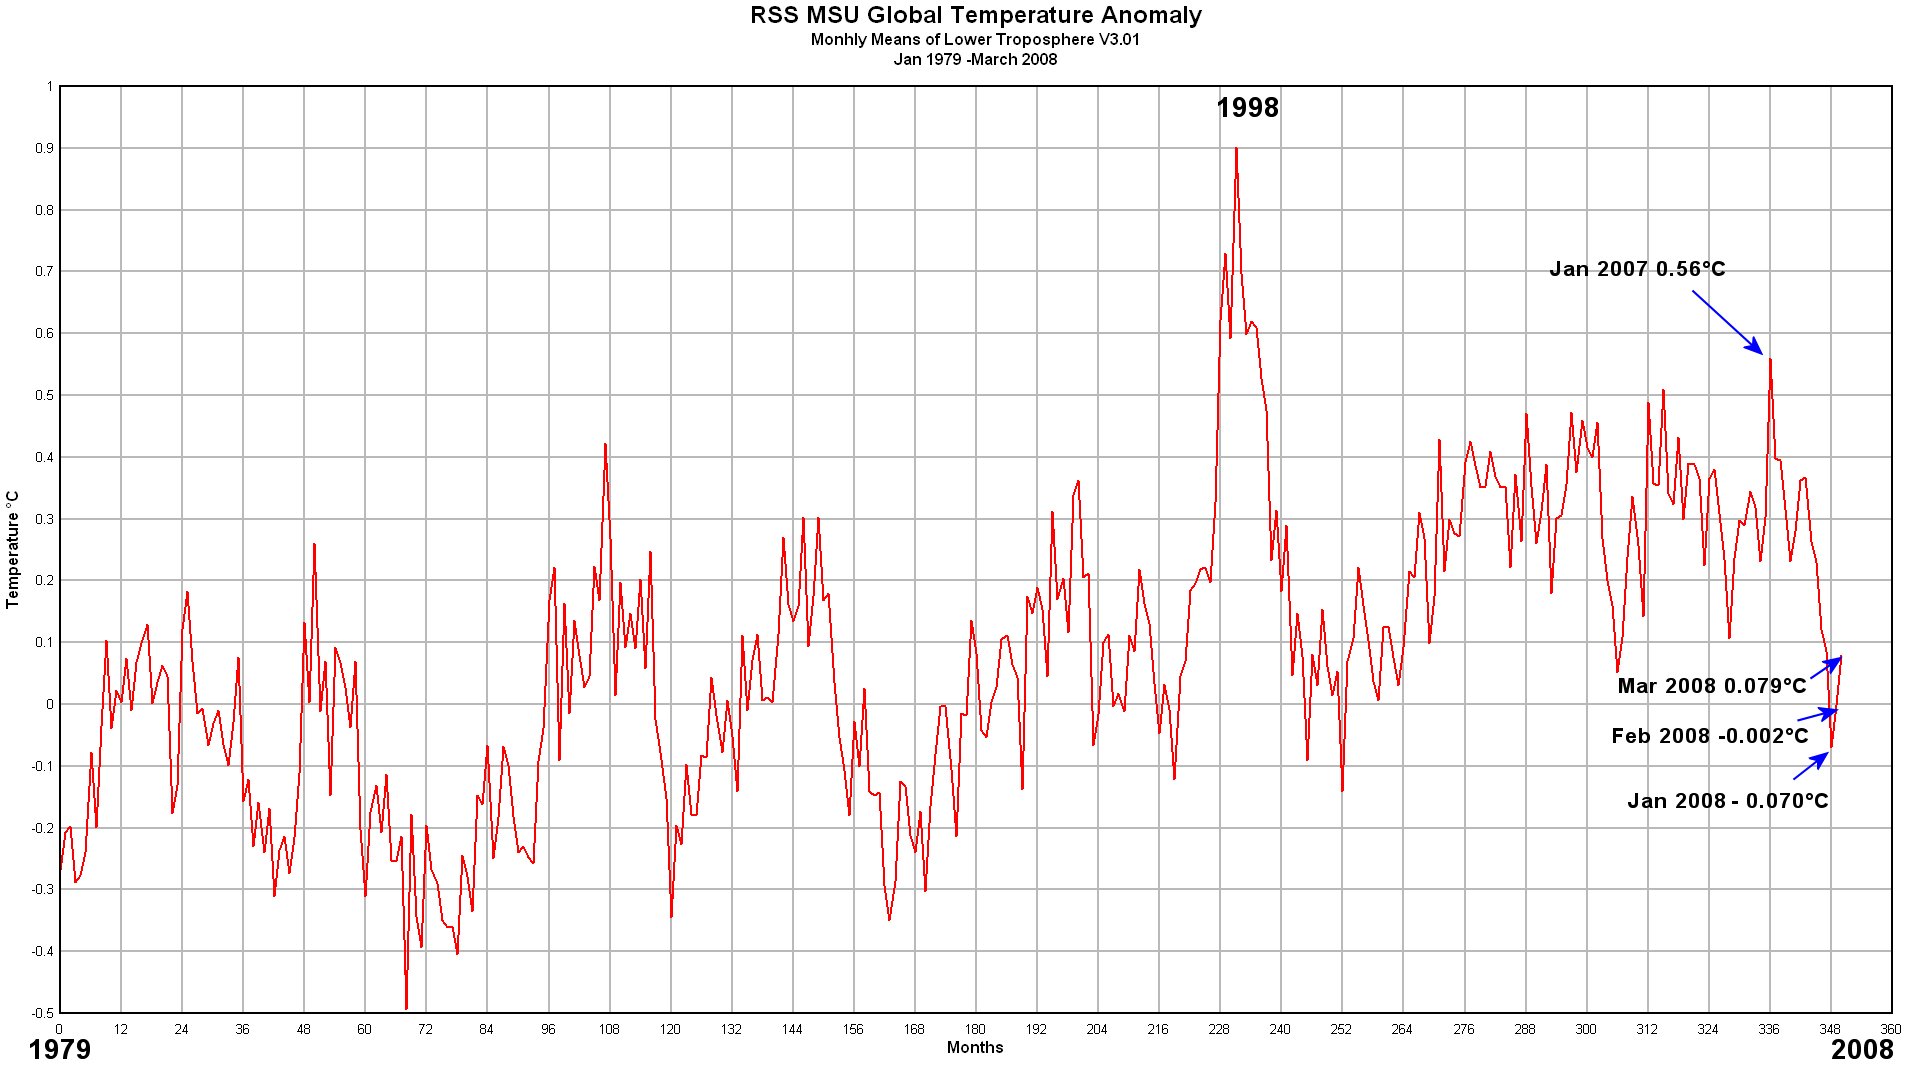
By Anthony Watts, Watts Up With That
The RSS Microwave Sounder Unit (MSU) global temperature anomaly data has been published this morning by RSS (Remote Sensing Systems of Santa Rosa, CA). For March 2008 it has moved a little higher, with a value of .079C for a change of 0.081C globally from February. January 2008 was -0.07, February -0.002.
See larger graph here
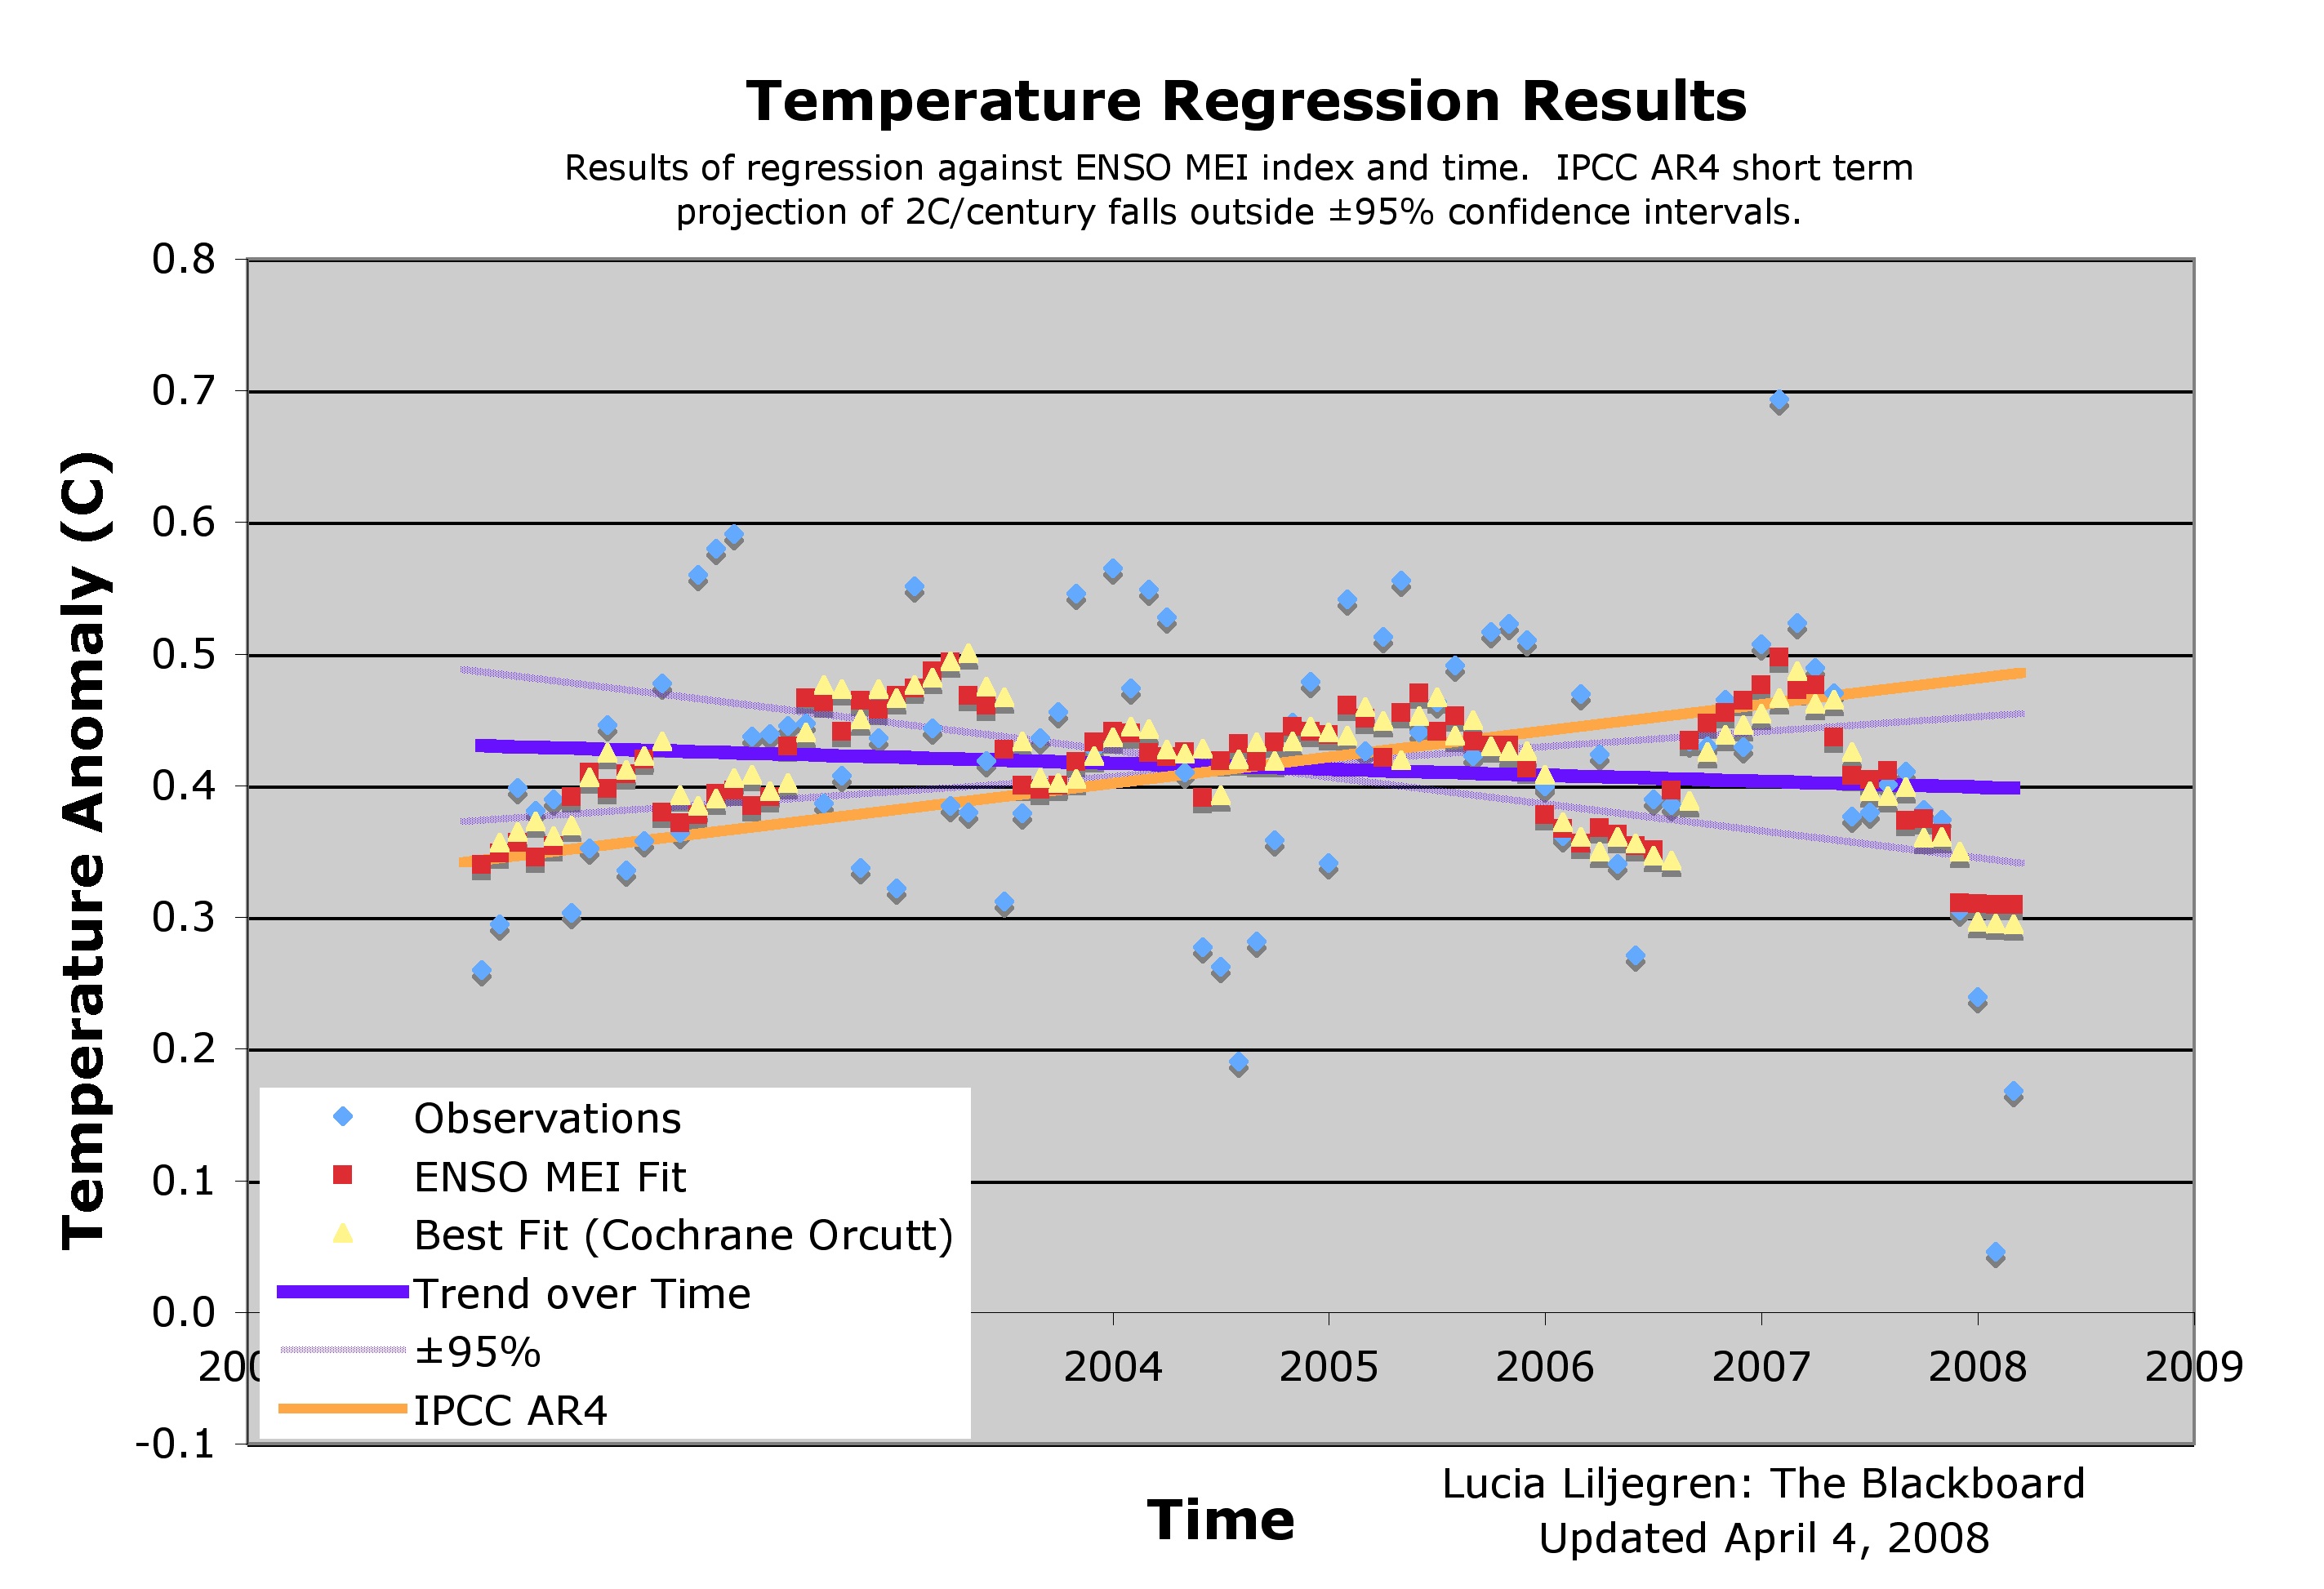
The interesting news is the divergence between northern and southern hemispheres, and the plunge seen in the continental USA. I’ll have more on that coming up. On a related note: Lucia over at The Blackboard just posted a very well done analysis that takes ENSO into account in falsifying the IPCC AR4 projection of +2.0C/century. Here is her graph showing IPCC AR4 projections compared with observations and best fit trend:
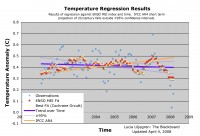
See larger graph here
By Anthony Watts, Watts Up With That
Our newest volunteer at surfacestations.org is Keith Taylor, and he’s gotten of to a great start with 2 stations in 2 days. Hi first was the climate station of record for Williamsburg, KY, USHCN station #158709 (or maybe 158711). Like many USHCN stations, it is located at a sewage treatment plant. I’ve previously mentioned several times how the MMTS electronic thermometer has caused stations converted from traditional mercury max-min thermometers to MMTS get closer to building because of cable laying issues. This one is a little closer than usual.
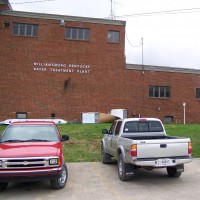
Keith reports the sensor head is only 33 inches from the brick building wall. And, just off in the background, a new electric power transformer is being installed. In fact it looks like a lot of land use changes are going on around the station due to construction. From the home page of this wastewater treatment plant, we learn that: The Williamsburg Waste Water Treatment Plant underwent a state-of-the-art expansion in 2003. Today the plant is rated at 2 million gallons with a peak production of six million gallons per day. Thats a lot of waste water (and waster heat) going through. It will be interesting to see what effects those construction and capacity changes may have to the temperature record in the years ahead. Like many stations we’ve found, there is convenient parking available as well.
You can see the complete gallery of photos here. See full post here.
By Joseph D’Aleo, CCM
Although it is a week away, there are continuing signs we may be in for a typical early spring La Nina storm event that will threaten more flooding rains, at least one major tornado outbreak day and a major blizzard on the northwest side. Flooding in La Nina years averages nearly $4.5 billion compared to an average of $2.4 billion. We have already seen examples of that this year in Missouri and Arkansas.
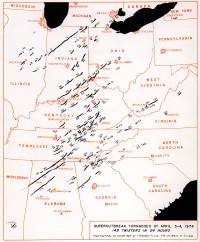
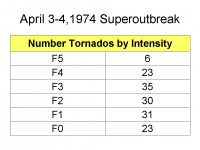
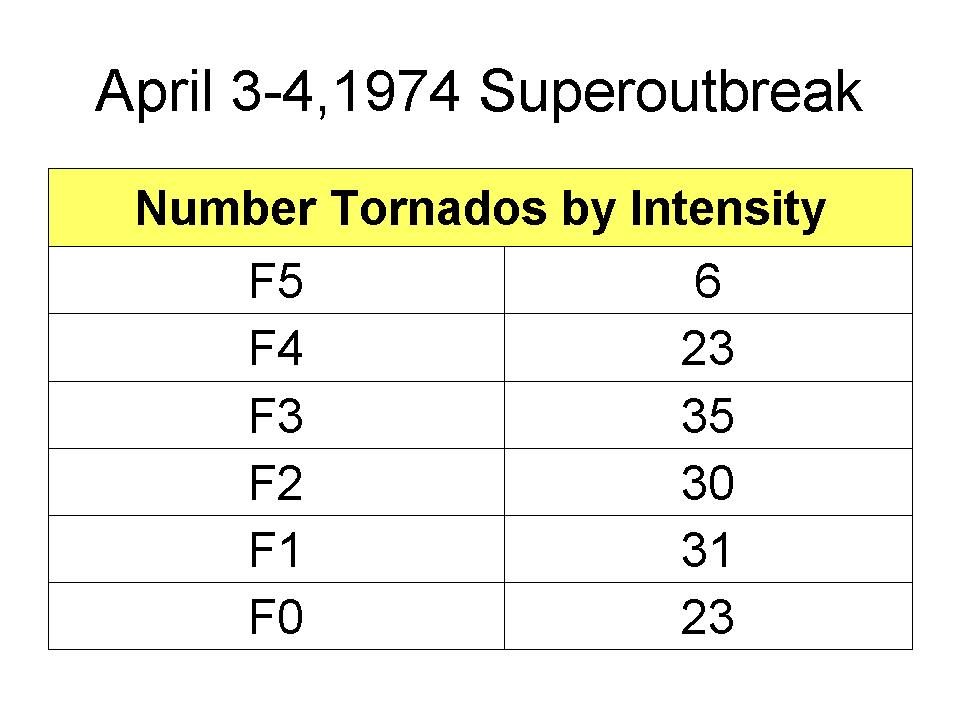
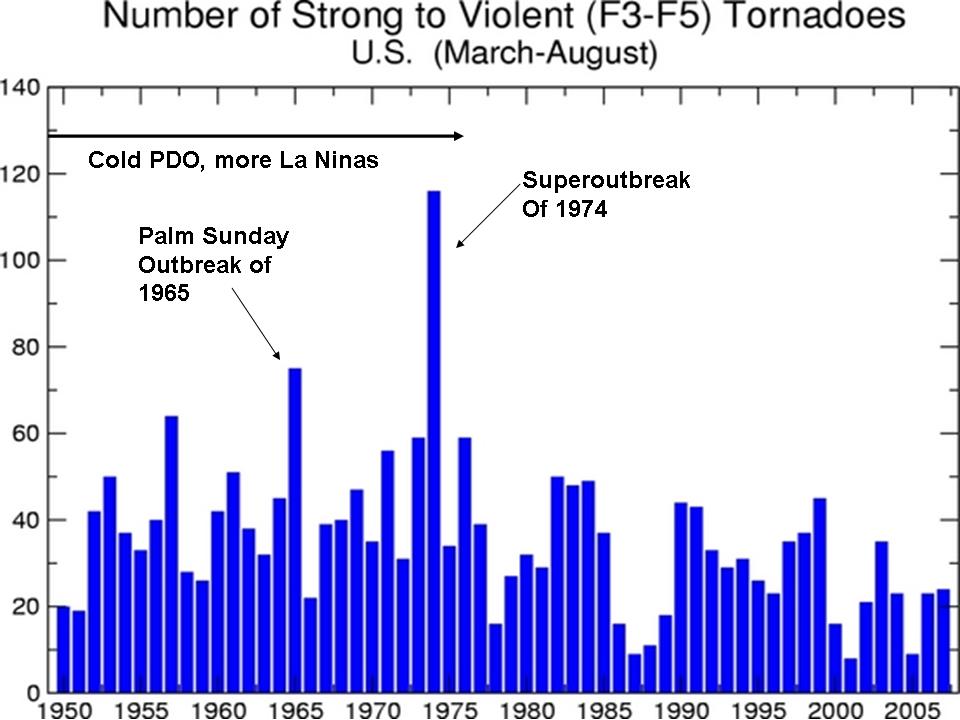
Major tornado outbreaks occurred in January 1999, a recent La Nina year, in Arkansas and Tennessee and in May in Oklahoma and Kansas with $2.3 billion in damages. And of course the super tornado outbreak of April 1974 with its 148 tornadoes that left 315 dead and 500 injured occurred during a very strong La Nina. In a prior La Nina event in 1965, the so-called Palm Sunday Outbreak had 78 tornadoes, 271 deaths and 1500 injuries.
See huge image here
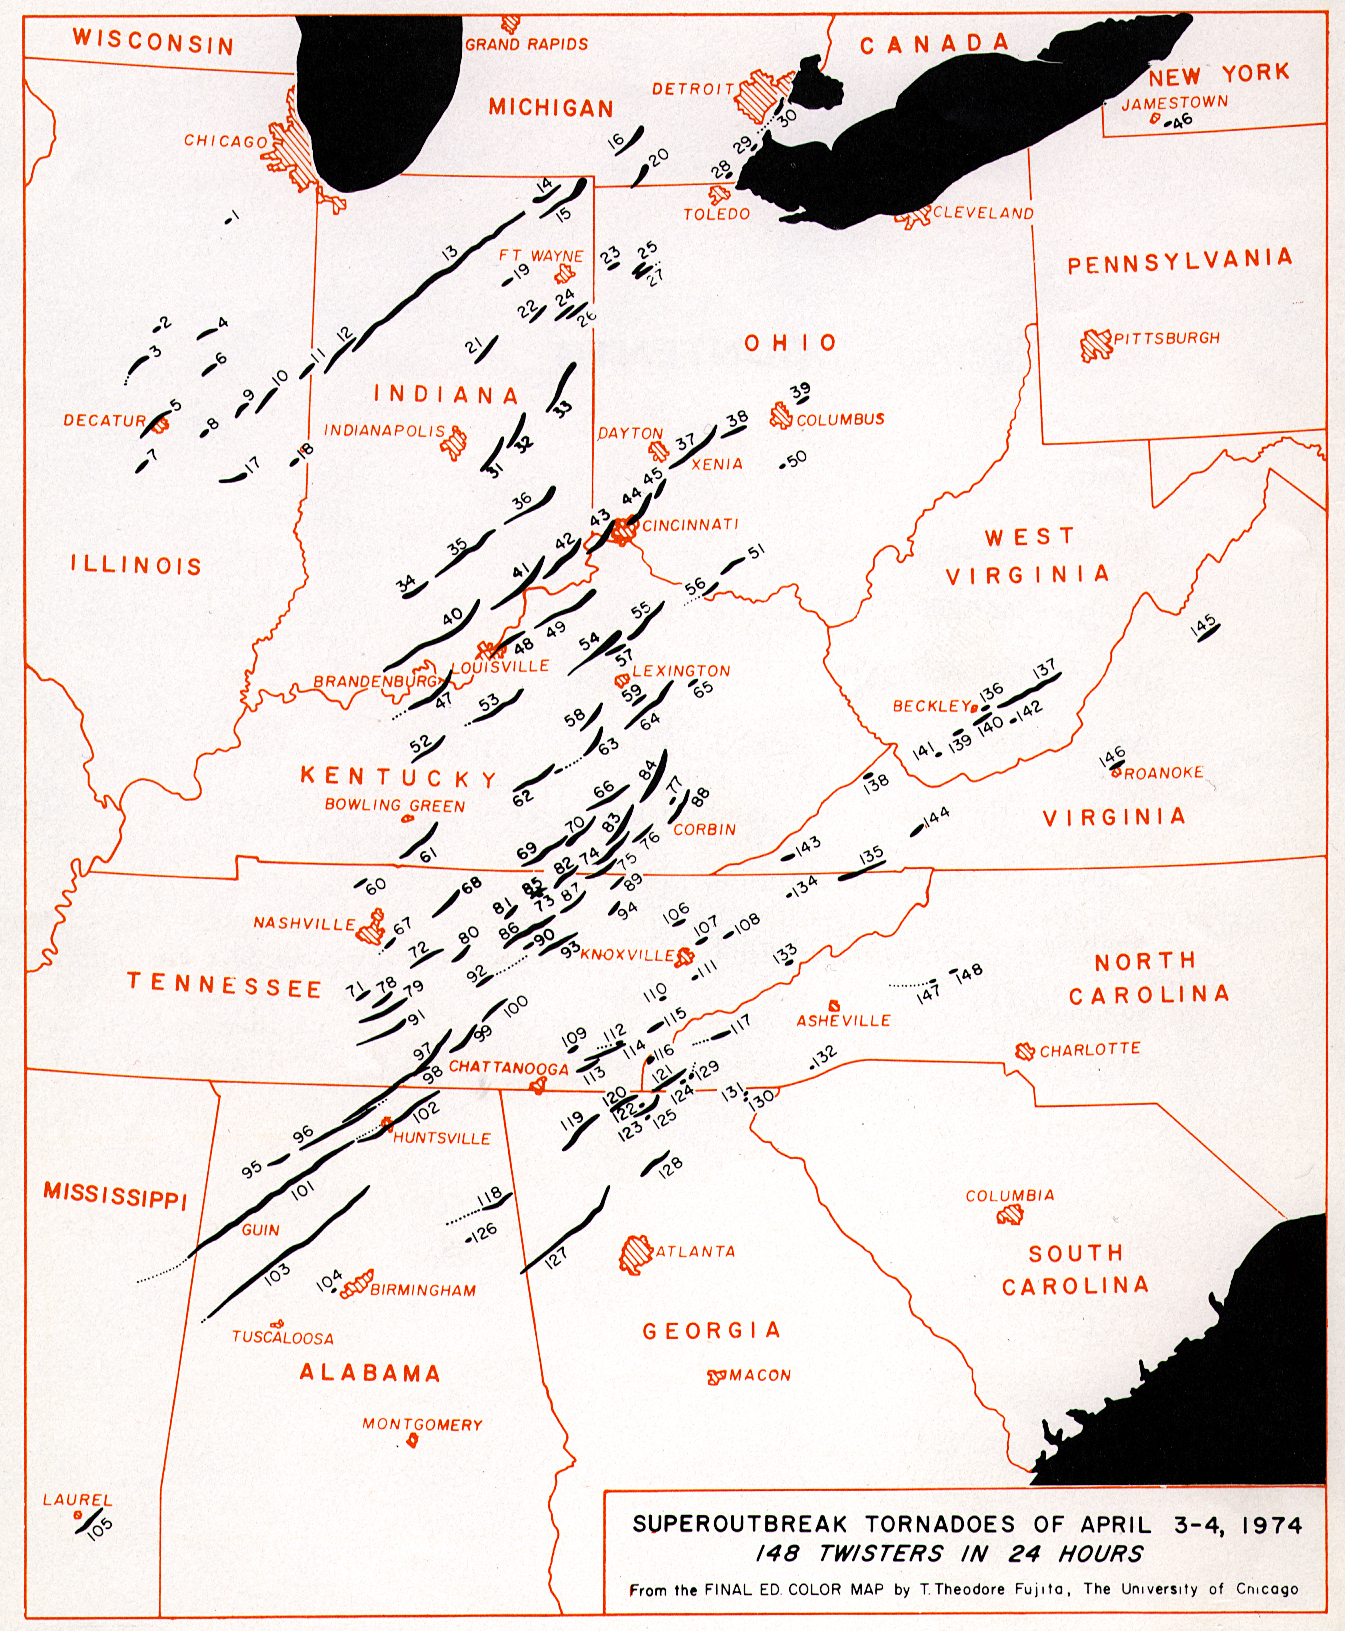
There were many F3-F5 storms in that 1974 Superoutbreak event (64).
See larger image here
There were 38 F3-F5 tornadoes in 1965, the second most active day on record. See how the frequency of F3-F5 torndoes dropped off after the Great Pacific Climate Shift in 1977. In the cool Pacific PDO mode that preceded it, more La Ninas were favored and occurred and they frequently lead to more tornado outbreaks in the winter and spring along with more northern and western winter snows and spring flooding. We have already seen each of these occur in recent months.
See full size image here
We can only hope that it doesn’t come together and is not a major damaging event. If it does, with no sense of history, expect the media and friends to blame it on man-made global climate change.