


By Tim Ball, Canada Free Press
“But the most brilliant propagandist technique will yield no success unless one fundamental principle is borne in mind constantly and with unflagging attention. It must confine itself to a few points and repeat them over and over. Here, as so often in this world, persistence is the first and most important requirement for success.”
Amid the rhetoric of President Obama’s speech to the United Nations September 22 conference on climate change in New York he repeated the same few points. They’re identical to those in Al Gore’s movie “An Inconvenient Truth.” Trouble is they are wrong. So, what is the President’s culpability? If he doesn’t know they’re wrong he and his advisors are incompetent. If they know, they’re deceiving.

ICECAP NOTE: Sorry John Keery and Barbara Boxer, renaming it the Clean Energy Jobs and American Power Act doesn’t change the fact, it endangers our energy future, IS a tax and as John Dingell (D. MI) says a huge one on industry and the American families, with the greatest impact on the lower and middle income families already reeling from the worst economy in many decades.
United Nations Secretary General Ban Ki-Moon organized the conference to boost flagging support for the upcoming Copenhagen Climate Conference 2009. Copenhagen organizers define the objective; “In 2012 the Kyoto Protocol to prevent climate changes and global warming runs out. To keep the process on the line there is an urgent need for a new climate protocol. At the conference in Copenhagen 2009 the parties of the UNFCCC meet for the last time on government level before the climate agreement needs to be renewed.” It’s the last chance?
Obama began with a reverse consensus argument. “That so many of us are here today is a recognition that the threat from climate change is serious.” No it isn’t! Ban Ki-Moon invited representatives from over 140 countries because it’s the issue he chose as the centre of his tenure at the UN and it is failing: “The summit on September 22 on climate change will be the largest ever gathering of heads of states and governments on climate change. The proposal is to focus minds and generate action.” Number or importance of attendees does not change the facts.
Moon said, “Climate change is happening much faster than we realized,” No it isn’t! It’s an unsupportable claim designed to stampede leaders and the public. Of course, once you scare the public you must promise action. “Our summit is about building the bridge to Copenhagen. We want world leaders to show [that] they understand the gravity of climate risk as well as the benefits of acting now.”
False Information
Obama’s speeches follow a pattern. Invoke a big name from the past: here he used John F Kennedy, “Our problems are man-made, therefore they may be solved by man.” The problem is global warming or climate changes are not man-made. Next he presents a few ‘facts’ to substantiate the threat. Then he exaggerates the situation to justify draconian intervention. Here he repeats Moon’s inaccurate message. The “threat from climate change is serious, it is urgent, and it is growing.” Throughout he repeats a claim for emphasis; in this case it’s the false claim that CO2 is a pollutant. He makes seven references.
The few ‘facts’ start with; “Rising sea levels threaten every coastline.” No they don’t! Actually, there are many areas where land is rising and sea levels falling. Sea level rise is the centerpiece of Gore’s movie. It has risen steadily and naturally over the last few thousand years as we emerged from the ice age, but the rate of increase has decreased.
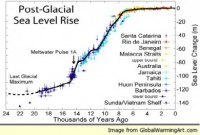
Figure 1: Sea level Rise 20,000 years to present.
Decrease will continue with current cooling. Gore predicts a 4 to 12 meters rise but the Intergovernmental Panel on Climate Change (IPCC) disagree significantly. Lord Monckton says, Gore has accordingly exaggerated the official sea-level estimate by approaching 10,000 per cent.
Then Obama claims, “More powerful storms and floods threaten every continent.” No they don’t! They are not increasing in numbers or intensity. Here’s a plot of US landfall hurricanes for 154 years and a plot of severe tornadoes for 57 years.

Figure 2: US Hurricanes 1851-2005. Source: National Oceanographic and Atmospheric Administration.
There’s no increase in either plot and there won’t be any if warming occurs. Warming theory says polar air will warm more than tropical air thus reducing temperature contrast, the main driving force of severe weather.
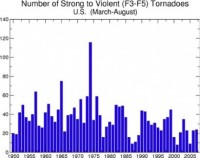
Figure 3: Severe Tornadoes 1950-2007. Source: National Oceanographic and Atmospheric Administration.
Next he claims, “More frequent drought and crop failures breed hunger and conflict in places where hunger and conflict already thrive.” This is scientifically illogical. A warmer world means more moisture evaporates to the atmosphere increasing precipitation potential. It’s also a questionable link. Hunger and conflict thrive in these regions mostly because of political, economic and development failures.
The last claim is related to sea level rise. “On shrinking islands, families are already being forced to flee their homes as climate refugees.” This is more Gore nonsense. As Lord Monckton observed in identifying 35 major errors in Gore’s movie, There have been no mass evacuations of populations of islanders as suggested by Gore, though some residents of Tuvalu have asked to be moved to New Zealand, even though the tide-gauges maintained until recently by the National Tidal Facility of Australia show a mean annual sea-level rise over the past half-century equivalent to the thickness of a human hair. In addition, about the most quoted island situation he writes, In the Maldives, a detailed recent study (by Nils Axel Morner) showed that sea levels were unchanged today compared with 1250 years ago, though they have been higher in much of the intervening period, and have very seldom been lower.
Here is Morner’s plot of Maldives sea levels changes, which parallels the curve in Figure 1. Humans have occupied the islands since 1500 BP and survived previous higher levels.
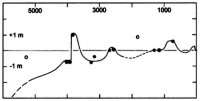
Figure 4: 5000 year sea level curve for the Maldives compared to present level. Source: Nils Axel Morner, “The Maldives Sea Level Research Project”.
Exclusions Are as Telling as Inclusions
Obama uses Gore’s arguments so comments about them in the ruling of a United Kingdom Court judge are appropriate. Speaking of “An Inconvenient Truth,” “It is built round the charismatic presence of the ex-Vice-President, Al Gore, whose crusade it now is to persuade the world of the dangers of climate change caused by global warming. It is now common ground that it is not simply a science film - although it is clear that it is based substantially on scientific research and opinion - but that it is a political film, albeit of course not party political. Its theme is not merely the fact that there is global warming, and that there is a powerful case that such global warming is caused by man, but that urgent, and if necessary expensive and inconvenient steps must be taken to counter it, many of which are spelt out. Paul Downes, using persuasive force almost equivalent to that of Mr Gore, has established his case that the views in the film are political by submitting that Mr Gore promotes an apocalyptic vision, which would be used to influence a vast array of political policies,”
Obama repeats the errors. In addition, he ignores exposure of the “hockey stick” fraud after its authors were forced to disclose data and method. He ignores the fact the scientist who claimed a global temperature rise of circa 1 degree C since pre-industrial times refuses to disclose his data or method. He ignores recent global temperature decline as CO2 levels increase in contradiction of IPCC assumptions. IPCC is the sole source of his claim of warming and sea level rise, but all previous predictions have been wrong. He repeats errors already exposed and ignores newly exposed errors. If he is unaware of this information, he displays incompetence. If he is aware, he is perpetuating a massive deception.
Right for the Wrong Reason
Ironically, Obama made one accurate comment, “The security and stability of each nation and all peoples - our prosperity, our health, our safety - are in jeopardy. And the time we have to reverse this tide is running out.” It’s true as long as leaders ignore the evidence and accept incorrect corrupt science to destroy economies with disastrous, unnecessary policies. Disseminating and repeating false information for political purposes is the definition of propaganda.
Oh, by the way, the opening quote is from Chapter 6 of Mein Kampf.
See full post here.
By Bob Ellis, Dakota Voice
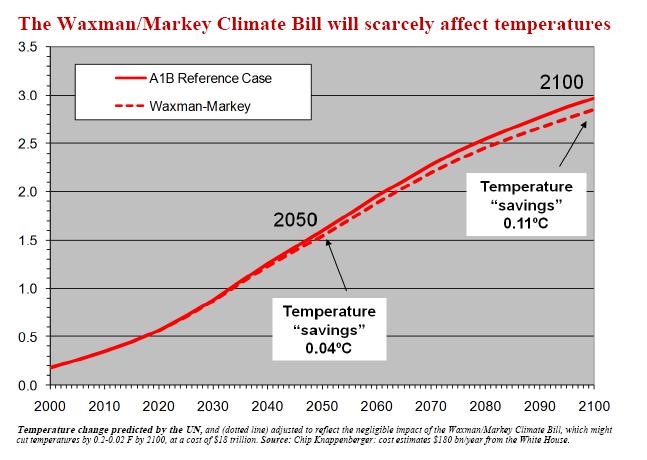
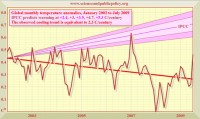
Christopher Monckton says in the July 2009 issue of SPPI Monthly CO2 Report that it simply cannot be credibly argued that anthropogenic global warming is some kind of catastrophe warranting the sacrifice of our freedom and prosperity.

Temperature change predicted by the UN, and (dotted line) adjusted to reflect the negligible impact of the Waxman/Markey Climate Bill, which might cut temperatures by 0.2-0.02 F by 2100, at a cost of $18 trillion. Source: Chip Knappenberger: cost estimates $180 bn/year from the White House.
No longer can it be credibly argued that “global warming” is worse than previously thought. No longer can it be argued that “global warming” was, is, or will be any sort of global crisis. Recent papers in the peer-reviewed literature, combined with streams of data from satellites and thermometers, now provide a complete picture of why it is that the UN’s climate panel, the worldwide political class, and other “global warming” profiteers are wrong in their assumption that the enterprises of humankind will disastrously warm the Earth.
The global surface temperature record, which we update and publish every month, has shown no statistically-significant “global warming” for almost 15 years. Statistically-significant global cooling has now persisted for very nearly eight years. Even a strong El Nino - expected in the coming months - will be unlikely to reverse the cooling trend.
More significantly, the ARGO bathythermographs deployed throughout the world’s oceans since 2003 show that the top 400 fathoms of the oceans, where it is agreed between all parties that at least 80% of all heat caused by manmade “global warming” must accumulate, have been cooling over the past six years. That now prolonged ocean cooling is fatal to the “official” theory that “global warming” will happen on anything other than a minute scale.
Even before this, there was a host of information that tells any reasonable person that the hypothesis of anthropogenic global warming is full of hot air and nothing else.
As Melanie Phillips at the Spectator points out, claims of “consensus” are a joke (as does the 30,000 scientists who have signed the Oregon Petition against anthropogenic global warming) based on sloppy, flawed and disingenuous “science.” This includes Al Gore’s favorite toy: the discredited “hockey stick.”
As I said a couple of days ago as I cataloged just a few of those facts:
If Greenland was warm enough 1,000 years ago (when there were no SUVs or power plants) to be colonized by the Vikings and sustain vineyards, then the current state of the climate (when most of Greenland is covered by ice) cannot rationally be blamed on human activity.
If temperature data going back hundreds of years (long before there were SUVs driven by evilcapitalists) tracks with solar activity (and it does) including colder and warmer periods, then the current global temperatures cannot rationally be blamed on human activity.
If NASA data agrees with other data that solar activity is cyclic and corresponds to global temperature (and it does), then the current global temperatures cannot rationally be blamed on human activity.
When we see solar activity diminish, and we see global temperatures level off correspondingly (while human industrial activity has not diminished), then recent global warming cannot be rationally blamed on human activity.
If historical examination of the Peruvian ice cap shows higher global temperatures in the past (when there were no SUVs and coal-burning power plants), then the current global temperatures cannot rationally be blamed on human activity.
Icecap Note: Researchers trek the Peruvian Glaciers. Lonnie Thompson reports a glacial retreat since 1978 he attributes to global warming, but 1978 was the time of the Great Pacific Climate Shift, a flip to the warm PDO which resulted in almost exclusive El Ninos through 1998.
El Ninos lead to warm water off the Peru coast which logically causes warming and melting. Record cold and snow in the last two years marked the flip of the PDO back cold and will likely like we have seen in other places like Alaska, lead to glacial recovery. Note also this year’s El Nino is already cooling in the eastern Pacific, with waters near South America back below normal.
If other planets like Mars and Jupiter (where there are no evil capitalist-driven SUVs and coal-burning power plants) are warming, too (and they are), then current global temperatures on earth cannot be rationally blamed on human activity.
Even the claims of Gore and other earth-worshippers that there is “consensus” and this is “settled science” are a farce, with thousands of scientists refusing to drink the Koolaid and scientific organizations around the world declaring the emperor has no clothes, blowing claims of “consensus” completely out of the water.
In other words, if we open our eyes and take a look around us and at history, and we see global temperatures and temperature changes in the past that obviously had nothing to do with human industrial activity (because there was no industrial activity), it quickly becomes apparent that the theory of anthropogenic global warming is ludicrous in the extreme.
This is nothing but a manufactured “crisis” designed to (a) keep plenty of taxpayer-funded research dollars flowing to scientists and bureaucrats who would rather make an easy buck than do something useful, and (b) engineer the government control and wealth redistribution that socialists have long yearned for.
The asinine cap and trade global warming tax passed in the House by a thin margin in June, and now socialists in the Senate are looking to sneak an even worse version of it past the American people.
The socialists in congress either haven’t figured out that this snake oil doesn’t sell anymore and this record doesn’t spin anymore, or they flat don’t care that the American people see through their scam. But they’re going to find out big-time at the voting booth if they insist on pushing this assault on the American people and our way of life into law.
UPDATE: See a very comprehensive summary FACT SHEET summarizing Upcoming ‘Ice Age’ Claims by Climate Depot’s Marc Morano who continues doing the job of investigative reporting the media used to do here. A MUST READ!
Al Gore Lied.com posted on Minnesotans for Global Warming
I’ve unearthed from the YouTube dustbin what I believe to be some significant video of man-made global warming alarmist extraordinaire Stephen Schneider’s appearance on a May 1978 episode of the old television series, In Search Of.... For this episode, the show was In Search Of...The Coming Ice Age.
Season 2 Episode 23 Hosted by Leonard Nimoy and broadcast weekly from 1976 to 1982, In Search Of… is the greatest mystery documentary show ever.
I used to watch In Search Of… when I was a kid. I loved it. It was mystery documentary series, and one of the things that made it cool was that it was hosted by Leonard Nimoy, i.e. Spock. In Search Of… did shows on such topics as Bigfoot, The Bermuda Triangle, UFO captives, and The Ogopogo Monster. As a skeptic looking back on the show today, I find it hilarious that the show included climate alarmism alongside those campy topics.
The episode in question, titled, The Coming Ice Age, has much that is worthy of discussion, and features several scientists warning of a coming ice age, including Dr. Gifford Miller, Chester Langway, and Dr. James Hays. But for the purposes of this post I’ll focus on Stephen Schneider who is featured in Part Three. Schneider may not cast as large of a shadow in the man-made global warming alarmist crowd as such luminaries as Al Gore and James Hansen, but Schneider has earned a special place in the hearts of man-made global warming skeptics everywhere when he told Discover Magazine in October, 1989:
“On the one hand, as scientists we are ethically bound to the scientific method, in effect promising to tell the truth, the whole truth, and nothing but—which means that we must include all the doubts, the caveats, the ifs, ands, and buts. On the other hand, we are not just scientists but human beings as well. And like most people we’d like to see the world a better place, which in this context translates into our working to reduce the risk of potentially disastrous climatic change. To do that we need to get some broadbased support, to capture the public’s imagination. That, of course, entails getting loads of media coverage. So we have to offer up scary scenarios, make simplified, dramatic statements, and make little mention of any doubts we might have. This ‘double ethical bind’ we frequently find ourselves in cannot be solved by any formula. Each of us has to decide what the right balance is between being effective and being honest. I hope that means being both.”
Schneider’s been trying unsuccessfully to put that genie back in the bottle for years, and his words will live forever in the alarmist Hall of Shame. The Schneider segment is in Part Three, and his role in the show is to share his opinion on whether or not it would be wise to take measures to stop the predicted coming ice age, or more specifically, using nuclear power to loosen polar icecaps, and helping sea ice melt by covering it with black soot.
On the TV show In Search Of...The Coming Ice Age, Steven Schneider wonders whether mankind should intervene in staving off a coming ice age. Schneider: “Can we do these things? Yes. But will they make things better? I’m not sure.”
See full post here. See note by Richard Mackey to M4GW on this story here.
Albert Einstein: “Not everything that counts can be counted, and not everything that can be counted counts.”
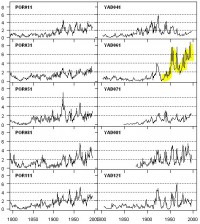
At issue is the use of tree rings as a temperature proxy, or dendrochronology. Using statistical techniques, researchers take the ring data to create a “reconstruction” of historical temperature anomalies. But trees are a highly controversial indicator of temperature, since the rings principally record CO2, and also record humidity, rainfall, nutrient intake and other local factors. Picking a temperature signal out of all this noise is problematic, and a dendrochronology can differ significantly from instrumented data. In dendro jargon, this disparity is called “divergence”. The process of creating a raw data set also involves a selective use of samples - a choice open to a scientist’s biases.—by Andrew Orlowski, UK Register, September 29, 2009
Media reaction to the Yamal story has been rather limited so far. I’m not sure whether this is because people are trying to digest what it means or whether it’s “too hot to handle”. None of the global warming supporters in the mainstream media have gone near it. The reaction of the Guardian - to delete any mention of the affair from their comment threads - has been extraordinary. --Bishop Hill, 1 October 2009
Read all the details of the Yamal issue from both sides in these links:
Yamal, A Divergence Problem by Steve McIntyre
YAD06 - the Most Influential Tree in the World by Steve McIntyre
Keith Briffa Responds by Steve McIntyre
Response from Briffa on the Yamal Tree Ring Affair Plus Rebuttal by Anthony Watts
See larger ones here.
Watts responds in part: “As McIntyre points out: “YAD061 reaches 8 sigma and is the most influential tree in the world.” Seems like an outlier to me when you have one tree that can skew the entire climate record. Explain yourself on why you failed to catch this. Why the hell did you wait 10 years to release the data? You did yourself no favors by deferring reasonable requests to archive data to enable replication. It was only when you became backed into a corner by The Royal Society that you made the data available. Your delays and roadblocks (such as providing an antique data format of the punched card era), plus refusing to provide metadata says more about your integrity than the data itself. Your actions make it appear that you did not want to release the data at all. Your actions are not consistent with the actions of the vast majority of scientists worldwide when asked for data for replication purposes. Making data available on paper publication for replication is the basis of proper science, which is why The Royal Society called you to task.”
Defects in Key Climate Data Detected by Ross McKitrick
The Yamal Implosion By Bishop Hill
Yamal, The Debate Continues by Bishop Hill
Treemometers by Andrew Orlowski, the UK Register
Hey Ya Mal by Real Climate
Hockey Stick Gets Personal: Lies from Real Climate by Roger Pielke Jr.
Mann Made Global Warming Confirmed by Chris Horner
What’s Revkin, Begley, Eilperin & Big MSM Outlets Have To Say About Massively Bogus Tree Ring Research/Hockey Stick? Nada! by C3 Headlines
Cherry Picking of Historic Proportions by Joanne Nova
UN Climate Reports: They Lie by Marc Sheppard
By Tony Hake, Denver Climate Change Examiner
The science on manmade climate change may be settled as far as some are concerned, but the debate continues to rage on not only in the scientific community but also within industry groups and professional organizations. This week some members of the U.S. Chamber of Commerce left the group due to its opposition to cap and trade legislation. At the other side, some scientific organizations have members objecting to the organizations’ alarmist statements.
Pacific Gas & Electric (PG&E) took the unusual step of resigning from the Chamber of Commerce earlier this month over the group’s opposition to climate change legislation in its current form. The Chamber has called for a ‘trial’ on the science behind climate change and said that “any climate change response must include all major CO2 emitting economies, promote new technologies, emphasize efficiency, ensure affordable energy for families and businesses, and help create American jobs and return our economy to prosperity.”
In a strongly worded letter, President and Chief Executive Officer of PG&E Thomas Donohue accused the group of ignoring what PG&E feels is “a threat that cannot be ignored.” He said the group’s “Extreme rhetoric and obstructionist tactics” do not reflect his company’s views.
Following in PG&E’s tracks, Public Service Company of New Mexico (PNM) left the group as did a third utility company, Exelon. Excelon CEO John Rowe recently told a conference, “The carbon-based free lunch is over.” Nike became the fourth company to object to the Chamber’s stance as it resigned its board position but said it would retain its membership.
The moves by these businesses drew a great deal of attention in the media and those in the ‘green’ movement supported the company’s. However, these four companies are but a small percentage of the group’s membership which numbers over 3 million businesses and organizations.
Scientific organizations that usually advocate for swift and immediate action to battle climate change have also upset their members but for the opposite reason - some members are not convinced that manmade climate change is a real threat.
“I am of the opinion that this is one of the greatest hoaxes ever perpetrated on the American people.” Dr. Bill Gray on the manmade climate change theory
Earlier this year William (Bill) Gray, Professor Emeritus of Colorado State University who is best known for his hurricane forecasts, fired one of the first shots by asserting the American Meteorological Society was being usurped by global warming alarmists.
The AMS had announced it would award the Rossby Research Medal to Dr. James Hansen of NASA’s Goddard Institute of Space Studies. Gray objected saying that Hansen was not trained in earth sciences and that the climate change models Hansen uses to issue climate warnings are inaccurate. In a letter he titled On The Hijacking of the American Meteorological Society, Gray said, “I am of the opinion that this is one of the greatest hoaxes ever perpetrated on the American people.”
The American Physical Society, a professional association for physicists, received a letter from 54 of its members in May objecting to the group’s climate change advocacy. The letter said in part, “Measured or reconstructed temperature records indicate that 20th - 21st century changes are neither exceptional nor persistent, and the historical and geological records show many periods warmer than today.”
“There is a considerable presence within the scientific community of people who do not agree with the IPCC”: American Physical Society editors
APS editors had acknowledged in 2008 that the scientific ‘consensus’ may not be as strong as some alarmists believe. They wrote, “There is a considerable presence within the scientific community of people who do not agree with the IPCC conclusion that anthropogenic CO2 emissions are very probably likely to be primarily responsible for the global warming that has occurred since the Industrial Revolution.”
The APS has agreed to review its current climate statement to ensure it met the beliefs of its membership and of the best science available.
In July, editors of Chemical & Engineering News, a magazine published by the American Chemical Society (ACS), found themselves amid an uprising by its members after publishing an editorial attacking those who dare to question man’s effect on the climate. The editorial in the June 22nd issue of the magazine said those that deny anthropogenic [manmade] global warming use “the same tactics used by other purveyors of nonsense rejected by the mainstream scientific community” including the belief in creationism.
One week later, the professional members of ACS let their opinion be known and it most likely is not the response some might expect. The July 27th issue of the magazine was filled with dozens of letters rebuking the magazine and its parent society for being so dismissive of dissenting opinions on climate change. The letters bordered on a rebellion within the society as it draws harsh criticism and calls for Mr. Baum to resign.
All of these events and others would seem to indicate that the debate about manmade climate change is not truly settled. While it may be easy to dismiss business groups that are struggling with a message on climate change, there is obviously considerable dissent within the scientific community as well.
See the new Climate Change Examiner here.
By Joanne Nova on SPPI
The price for speaking out against global warming is exile from your peers, even if you are at the top of your field. What follows is an example of a scientific group that not only stopped a leading researcher from attending a meeting, but then - without discussing the evidence - applauds the IPCC and recommends urgent policies to reduce greenhouse gases. What has science been reduced to if bear biologists feel they can effectively issue ad hoc recommendations on worldwide energy use? How low have standards sunk if informed opinion is censored, while uninformed opinion is elevated to official policy?
If a leading researcher can’t speak his mind without punishment by exile, what chance would any up-and-coming researcher have? As Mitchell Taylor points out “It’s a good way to maintain consensus”. And so it is. But it’s not science. Mitchell Taylor is a Polar Bear researcher who has caught more polar bears and worked on more polar bear groups than any other, but he was effectively ostracized from the Polar Bear Specialist Group (PBSG) specifically because he has publicly expressed doubts that there is a crisis due to carbon dioxide emissions.
Dr. Andy Derocher, the outgoing chairman of the PSBG and Professor at the University of Alberta, wrote to inform Taylor that he was not welcome at the 2009 meeting of the PBSG. Keep in mind as you read his comments (below) that Taylor had arranged funding to attend the meeting in Copenhagen, and has been at every meeting of this group since 1981. With 30 years of experience in polar bear research, it goes without saying that he has something to contribute to any discussion about polar bear conservation. This is the original email from Derocher to Taylor explaining why he was not invited:
Hi Mitch,
The world is a political place and for polar bears, more so now than ever before. I have no problem with dissenting views as long as they are supportable by logic, scientific reasoning, and the literature. I do believe, as do many PBSG members, that for the sake of polar bear conservation, views that run counter to human induced climate change are extremely unhelpful. In this vein, your positions and statements in the Manhattan Declaration, the Frontier Institute, and the Science and Public Policy Institute are inconsistent with positions taken by the PBSG. I too was not surprised by the members not endorsing an invitation. Nothing I heard had to do with your science on harvesting or your research on polar bears - it was the positions you’ve taken on global warming that brought opposition. Time will tell who is correct but the scientific literature is not on the side of those arguing against human induced climate change. I look forward to having someone else chair the PBSG.
Best regards,
Andy (Derocher)
So in polar bear research, your opinion on climate change is more important than your knowledge about polar bears. (Time to add Science to the Threatened Species List.) While Mitchell Taylor was ousted, three participants were added to the meeting from groups whose main activities are political lobbying and education rather than science. While the World Wildlife Fund (WWF) and Polar Bears International (PBI) do fund some minor research, their main output is press releases, rather than scientific papers. Taylor has published some 59 peer reviewed papers. But none of the three new representatives appears to have published a single scientific paper related to polar bears.
If they managed large research programs it would be understandable, but PBI’s budget is apparently barely enough to cover one full time researcher and yet they effectively had three representatives at the PBSG meeting (including Derocher who is a scientific advisor for the PBI).
So there were three spaces for people from institutions whose funds depend on there being a “crisis”, but no space for one of the most published researchers in the field? If Exxon funding is supposed to affect scientists’ announcements, how could we expect “Green” funding from groups who hold a very strong position on climate change not to influence people, or at least to attract job applicants who share their views? Imagine the scandal if Exxon had funded a representative without a single paper to his name and he replaced one of the most experienced in the field?
People assume scientific associations to make pronouncements that mean something, but scientific associations are not scientific so much as political. Committees change. Their decrees are unaudited, and the media do little investigation or critical analysis and mostly just repeat their press releases. One of the few who did note the incident was Christopher Booker. In response, blogger Tim Lambert in (known as “Deltoid") weighed in to give Derocher a chance to answer the critics. So what does Derocher have to say for himself? He comes up with reasonable sounding excuses to justify his actions, but none of them change the original email. His post hoc efforts are just that: post hoc. Worse, they are wrong too. He clutches at straws declaring that Mitchell Taylor is retired - which is evidently news to Mitchell, who has two current contracts, and is a faculty member at Lakehead University with an active teaching program. Taylor has also been out in the field since the last PSBG meeting, and what a “field” it must be. Trekking through snow and looking for predators that weigh half a ton doesn’t sound like much of a hobby for senior citizens.
Read the rest of Joanne’s post here See also here, how the New York Times treats one non-believer within the EPA, Alan Carline, for daring to challenge the so called consensus position. They neglect to print the fact that 30,000 comments were sent in to the EPA endangerment findings also ignored.
Breaking news: Cherry Picking of Historic ProportionsBy Joanne Nova
A big news day. It appears Steve McIntyre (volunteer unpaid auditor of Big-Government-Science) has killed the Hockey Stick a second time.
The details are on the last three days of Steve McIntyre’s site Climate Audit, and summed up beautifully on Watts Up. The sheer effrontery and gall appears to be breathtaking.
The Briffa temperature graphs have been widely cited as evidence by the IPCC, yet it appears they were based on a very carefully selected set of data, so select, that the shape of the graph would have been totally transformed if the rest of the data had been included.
Kieth Briffa used 12 samples to arrive at his version of the hockey stick and refused to provide his data for years. When McIntyre finally got hold of it, and looked at the 34 samples that Briffa left out of his graphs, a stark message was displayed. McIntyre describes it today as one of the most disquieting images he’s ever presented.
Background
Since 1995 Kieth Briffa has been publishing graphs about temperature of the last thousand years. Like Michael Manns’ famous (and discredited) Hockey Stick graph, Briffa’s graphs were based on tree rings and appeared to show dramatic evidence that the current climate was extraordinarily warm compared to previous years. They were used in the infamous spagetti plots, and the IPCC 3rd Assessment Report, and recycled in other publications giving the impression they had been replicated. His work has even made it into school resources (Cimate Discovery, p4). His publications since 2000 are listed here.
Unaudited science
Suspiciously Briffa refused repeated requests to provide the Yamal data that his analysis was based on (something about the data belonging to the Russians). As Steve McIntyre points out, this kind of data should be archived and freely available after any peer reviewed paper is published.
Last year Briffa published a paper in a journal (Philosophical Transactions of Biology, the Royal Society) that did maintain basic standards (after being prodded) and a few days ago McIntyre noticed the data was finally up. This data had been used in papers going back as far as 2000. (And no one thought to politely inform McIntyre that the information he’d requested for years was now available?)
Hiding data in science is equivalent to a company issuing it’s annual report and telling the auditors that the receipts are commercial in confidence and they would just have to trust them. No court of law would accept that, yet at the “top” levels of science, papers have been allowed to sit as show-pieces for years without any chance that anyone could seriously verify their findings. In science, getting the stamp of Peer Review has become like a free pass to “credibility”.
Science is broken
So much for the repeat claims that peer review is a “rigorous process”. Those who keep telling us we have to “listen to the experts” and who put so much stock in a peer reviewed paper have been left hanging out to dry. Even if Briffa has a reason to exclude 2/3rds of the samples and somehow it’s just a coincidence that the ignored data were from slower growing trees, nothing changes the fact that he didn’t mention that in the paper, and nor, damningly, did he provide the data. It only takes a sentence to say (for example) “ABC tree chronologies excluded due to artificial herbicide damage” and it only takes a few minutes to email a data file.
Now we know why he might not have been so forthcoming with the data.
If all the tree rings are combined, the graph looks like this below. (I’ve added the black thick line to the original to make the merged data stand out). Obviously today is not as warm as things were 1000 years ago (at least not in far north Russia), and it’s also clear things have been warming since 1800 in Yamal. (image here)
Here’s a map to help put places to the names. These are the four sites mentioned as sources of the tree ring data. Yamal and Taymir are roughly 400 km apart.
In the mid 1990’s the Polar Urals were the place to be for interesting tree rings, but then as the data got updated and yielded a medieval warm period that Team AGW preferred to ignore, they moved their focus to the Yamal Peninsula. There was plenty of data to pick from, but that’s the point. They chose 10 data sets from 1990, and only 5 post 1995. Which seems curious as presumably there is no shortage of 20 year old trees on the Yamal Peninsula. As Ross McKitrick notes, a small sample may have been passable, but it appears that these trees were not selected randomly.
McKitrick expands:
Thus the key ingredient in a lot of the studies that have been invoked to support the Hockey Stick, namely the Briffa Yamal series (red line above) depends on the influence of a thin subsample of post-1990 chronologies and the exclusion of the (much larger) collection of readily-available Schweingruber data for the same area.
Honest scientists who believe in there is a crisis in carbon must surely be starting to ask questions about what’s going on with their colleagues. If the evidence is so strong, so undeniable; if the warming recently has been so unprecedented, why won’t people offer their data up freely so that science can progress as fast as possible? When is deluding the public, other scientists and our elected representatives ever a useful thing to do? People have invested money and careers, governments have paid millions for reports, and billions for research; and companies have planned years ahead, all partly based on the Hockey Stick Graph.
If the data had been archived immediately for the public, the world could have had access to better information for nearly a decade.
See post here.
Albert Einstein: “Not everything that counts can be counted, and not everything that can be counted counts.”
By Joseph D’Aleo, Fellow of the American Meteorological Society
As part of a well thought out and executed plan to convince the public there is global warming despite the cold and snow records of the last two years, get state climate action plans approved, keep the grant gravy train rolling through the university systems, and get government legislation or carbon control legislation approved that will benefit Wall Street and the government at our expense is underway.
Detailed well produced reports are being dribbled out state by state warning of a ridiculously warm and severe climate future. They are based on the same climate models which have failed miserably in the first decade showing strong warming while the globe cooled, sea levels accelerating up while they have stopped rising and heat records increasing in frequency while we have had fewer heat records in any decade since the 1800s, and disappearing snow while all time snow records occurred in the last two years. But don’t confuse the issue with facts. These reports are timed to affect the decisions made by congress w/r to Cap-and Tax.
Dr. Anthony Lupo reported on one such story in Missouri last month here. He starts “In late July, a document was released by the Union of Concerned Scientists (UCS) regarding the kind of future that Missouri faces as a result of global warming. This is part of a series of reports they’ve issued about climate change in the Midwest. Global warming is an issue that has gained more attention than usual within the last year, culminating in the late June passage by the US House of Representatives of the Waxman - Markey Clean Energy and Security Act. This has stimulated debate about combating climate change.
In the local newspaper, an alarmist scientist from the University of Illinois was quoted that we face a 14 degree Fahrenheit increase in summer temperatures as he relayed information from the UCS document “Confronting Climate Change in the US Midwest”. He stated this as if it were a done deal, especially if we continue emitting carbon dioxide at the same rate we are today. This kind of hyperbole then becomes accepted by the media as reality, and comes with the implication that things are worse than we thought. These exaggerated claims are no doubt behind subsequent alarmist editorials in other major newspapers advocating even more severe measures than Waxman - Markey.” Read Tony’s response.
And last week, while I enjoyed a college reunion at my alma mater in Madison, WI, two University of Wisconsin environmental professors published a story in the local newspaper, Study Reveals Dynamic Wisconsin Climate, Past and Future. They start “If the future scenarios being churned out by the world’s most sophisticated computer climate models are on the mark, big changes are in store for Wisconsin’s weather during the next century. Using a realistic estimate of future global carbon emissions, University of Wisconsin-Madison scientists are forecasting significantly warmer winters, altered patterns of precipitation and more severe weather events for the Badger state.” Those changes, according to the Wisconsin researchers, will be layered on a climate that, based on temperature and precipitation measurements from around the state over the past 60 years, has already warmed 1.3 degrees Fahrenheit, on average, and 2.5 degrees Fahrenheit in the winter.
The enlarged image is here.
“Looking into the future, we are anticipating that by 2050 Wisconsin will have an annual mean warming of between 4 and 9 degrees Fahrenheit,” says Dan Vimont, a UW-Madison professor of atmospheric and oceanic sciences, who, along with colleagues Chris Kucharik, David Lorenz and Michael Notaro, developed estimates of the state’s future climate as well as a chart of climate change in Wisconsin’s recent past.”
Icecap Note: The map above shows the change since 1950, this is the same cherry picking trick Phil Mote, formerly state climatologist in Washington State and now Oregon did while examining western United States and Canada did. Starting in 1950, a very cold and snowy year at the start of the cold PDO and ending at the warm and dry end of the warm PDO ensured a warming and reduction in western snowpack. When Oregon’s former state climatologist George Taylor pointed out that if he had started 50 years earlier, he would have seen cycles but no trend, George was attacked, when Assistant State Climatologist Mark Albright found the same, he was stripped of his title.
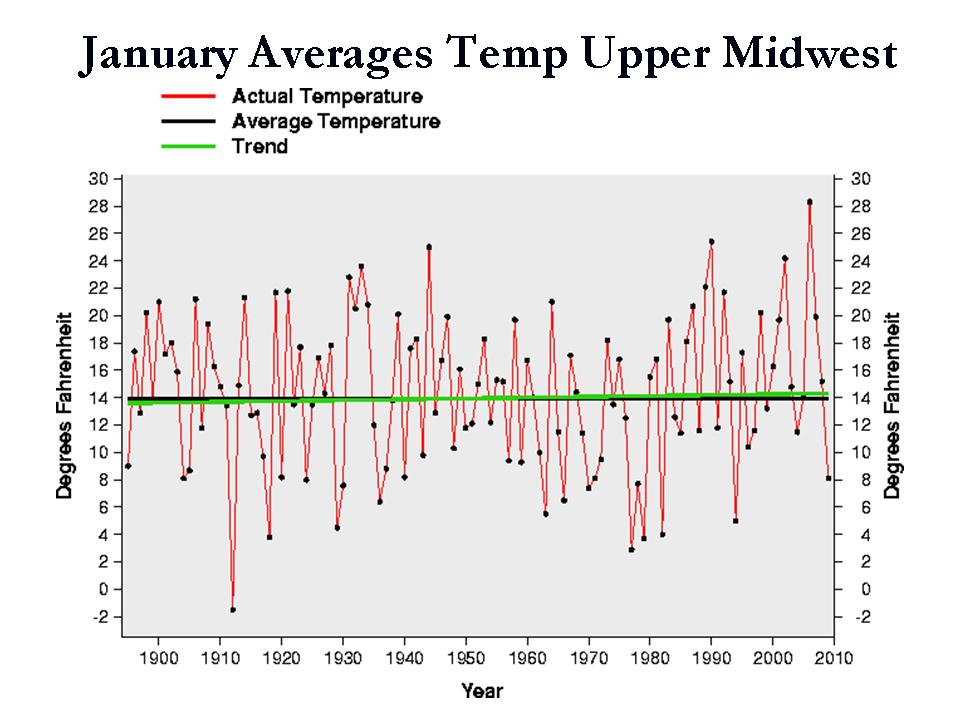
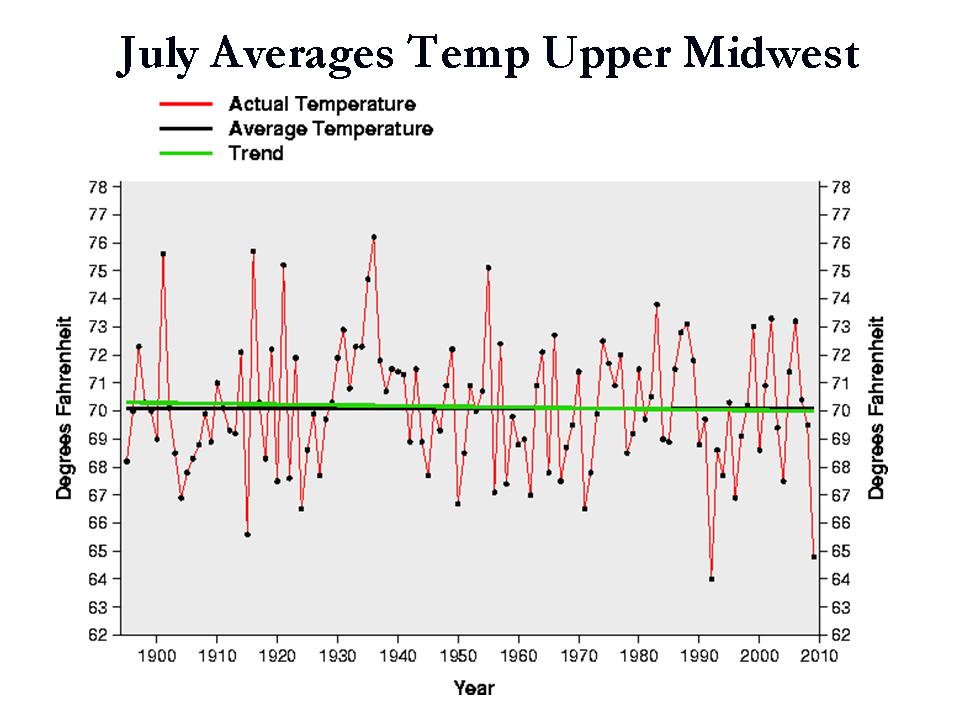
The same holds for Wisconsin, the cold PDO leads to more La Ninas, cold and snow in winter (exhibit A the last two years), spring flooding and severe weather and the warm PDO warmer, less snowy winters. With the 60 year PDO cycle, the temperatures can be seen to cycle up and down. You can see in the following NCDC plots for the North Central, cyclical variations - with some rise in January and July since 1950 but no measurable trends over the whole record.
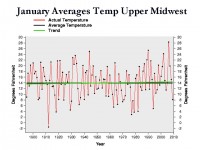
Larger image here.
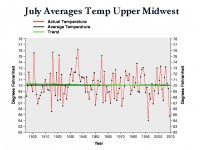
Larger image here.
The Milwaukee NWS also recently took a look at the long-term temperatures observed for Milwaukee (here), and calculated the number consecutive days with temperatures above 32F - that is, the minimum temperature for any calendar day had to be above the freezing mark of 32F. In a rough sense, looking for the number of consecutive days each year that plants had a chance to grow or survive. We found some interesting trends, but in general, there has been a lengthening of the growing season since the 1960s, but we haven’t exceeded what was observed in some of the years during the perod of 1900 to 1934.
If your local newspapers have not reported such a story for your state yet, expect one to come soon. Rest assured they are not based on real science and can be dismissed as propoganda, much as the CCSP, a glossy well produced nonsense document full of lies and mistatements, an embarrassment to NOAA. NOAA is complicit in maintaining an issue by manipulating data (allowing 80% stations to drop out, removing urban adjustment and satellite ocean monitoring, allowing 90% of climate station to have poor siting resulting in an artifical warming of 0.75F for the United States and accounting for most of the warming the last century). All this to counter the emerging evidence the changes are natural and cyclical related to the sun and oceans. President Obama will be defending this man-made global warming nonsense and promising the US (that means you and your family) will go to great pain to deal with this non issue. Keep your cards and letters and phone calls coming to congress to urge them to resist taking unneccesary action.
Update: See this Washington Examiner Op Ed on the Flawed Intelligence Guiding the Obama Energy Policy here.
By Richard Courtney on Climate Depot
UN IPCC scientist Richard Courtney responds to global warming activists lament on the “fixation on carbon dioxide.” [See: Climate Activists Shock Admission: ‘Climate change campaigners should not have fixated on carbon dioxide’—‘only responsible for about half of the problem’ - September 18, 2009 - ‘If climate negotiations 20 years ago concentrated on low-hanging fruits, the fight against global warming would have been more successful’]
Courtney, a UN IPCC expert reviewer and a UK based atmospheric science consultant, is featured on page 224 of the 2009 U.S. Senate Report of More Than 700 Dissenting Scientists Over Man-Made Global Warming.
Courtney’s September 21, 2009 comments reproduced below from UK Telegraph.
I was amused by this article from [UK Telegraph’s] Geoffrey Lean. It seems to be a desperate attempt at a fall-back position because it is now obvious there will be inevitable failure of the coming CoP15 at Copenhagen.
This statement in the article gave me an especial laugh:
“Take black carbon, which gives soot its colour. It is now accepted to be the second biggest contributor to climate change, responsible for between 10 and 25 per cent of it. Formed through incomplete combustion of wood, vegetation and fossil fuels, it lands a unique double whammy.”
Lean says controlling “black carbon” emissions is “low hanging fruit”. But the IPCC ignored all my several peer review comments which called for correct inclusion of soot/aerosol (i.e. those I copy below and several others).
My peer review comments for IPCC AR4 which called for correct inclusion of soot/aerosol including the following three that together demonstrate the IPCC has deliberately played down “black carbon” effects in its attempts to overstate carbon dioxide effects.
It seems CO2 control is failing so the ‘soot’ fall-back position is being adopted by those who like to pretend people effect global climate: we don’t.
Read more here.
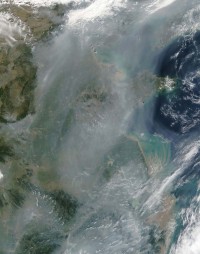
This MODIS/Terra image from September 10, 2005, supports recent research (Richter, et al., 2005) that shows China’s air pollution problems are increasing. Unlike CO2 which is a harmless gas that is a plant fertilizer, this is real pollution and has local climate and health effects.
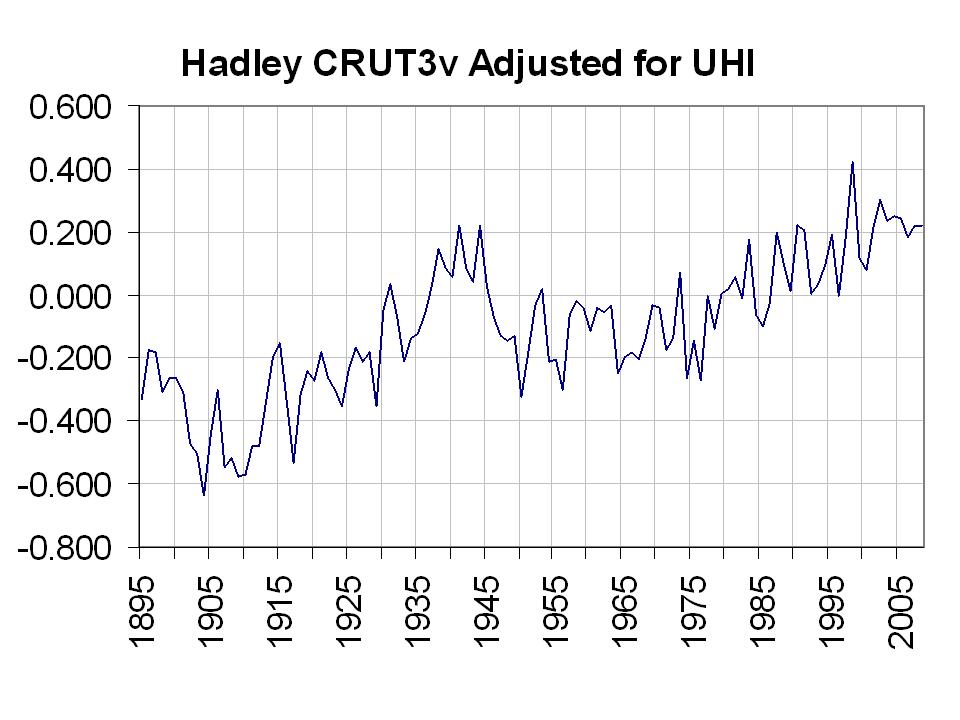
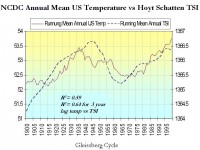
By Joseph D’Aleo, CCM, AMS Fellow
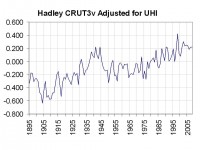
I believe this is a more accurate (though still not perfect) plot of global temperatures than those produced by Hadley, NOAA, and NASA GISS. It combines data from all three centers, using data from two (NOAA and GISS) to adjust the third (Hadley)
It is enlarged here
WHY ADJUSTMENT IS NECESSARY
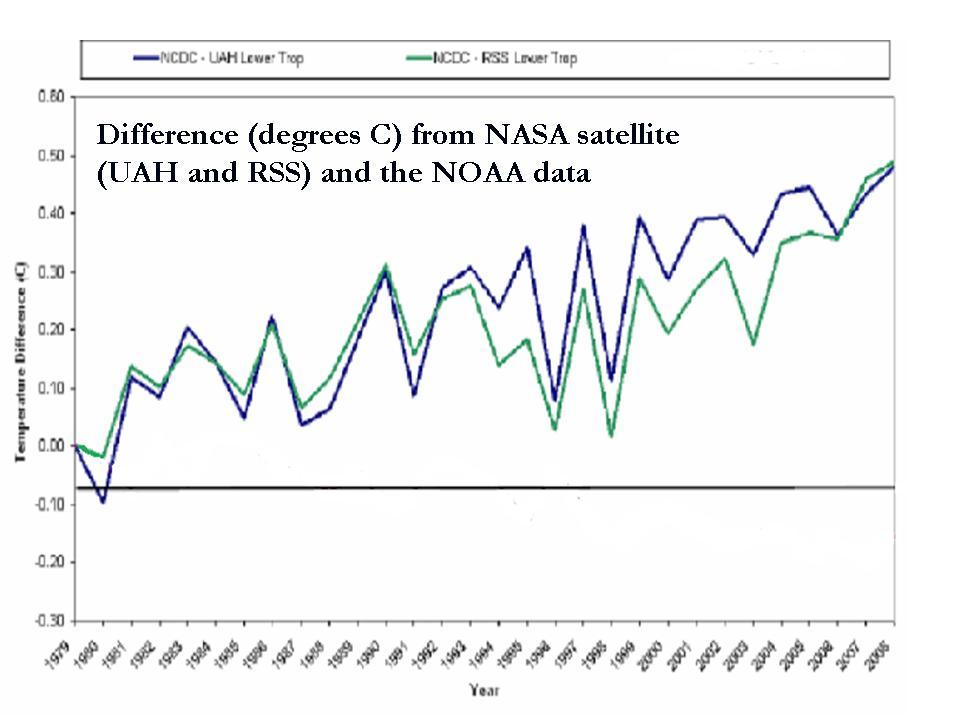
As I showed in the first analysis here, the long term global temperature trends in their data bases have been shown by numerous peer review papers to be exaggerated by 30% to 50% and in some cases much more by issues such as uncorrected urbanization (urban heat island or UHI), land use changes, bad siting, bad instrumentation, and ocean measurement techniques that changed over time. NOAA made matters worse by removing the satellite ocean temperature measurement which provide more complete coverage and was not subject to the local issues except near the coastlines and islands. The result has been the absurd and bogus claims by NOAA and the alarmists that we are in the warmest decade in 100 or even a 1000 years or more and our oceans are warmest ever. See this earlier story that summarizes the issues.
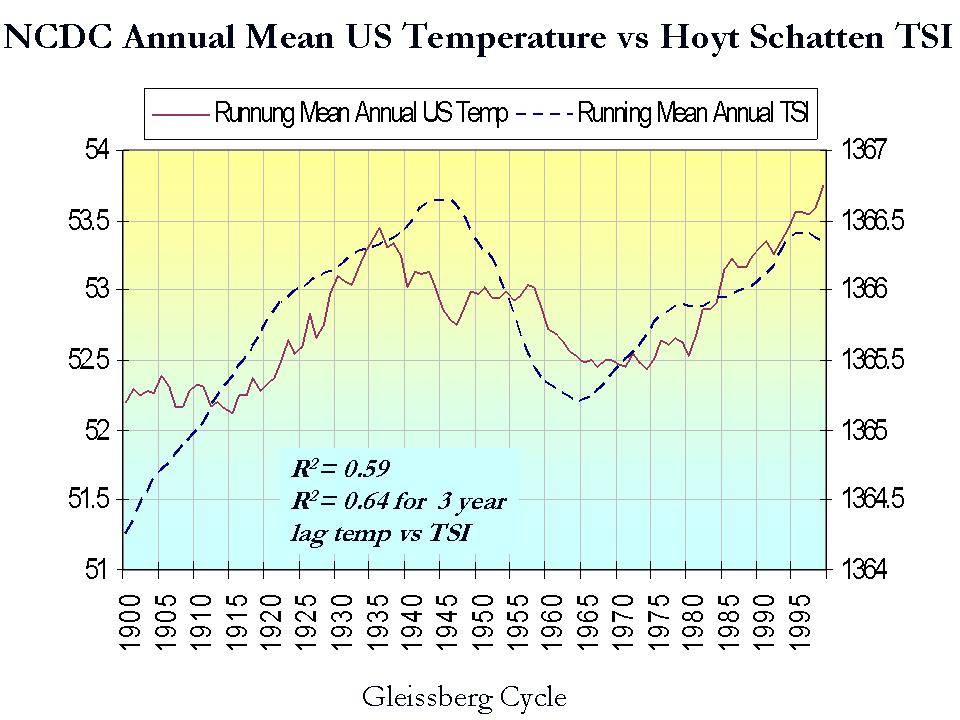
No one disputes the cyclical warming from 1979 to 1998 that is shown in all the data sets including the satellite, only the cause. These 60-70 year cycles tie in lock step with the ocean temperature cycles (PDO and AMO) and Total Solar Irradiance (Hoyt/Schatten calibrated to Willson’s ACRIM data).
As for the argument by some posters or commenters that the AMO and PDO are derived differently and represent patterns not simply magnitudes, let me agree but note that the “patterns” in both oceans with the two phases of the indices are the same. In both the PDO and AMO warm modes, there is horseshoe of warmth in the north and tropical oceans surrounding coolness in the central west ocdean basin. Both warm modes are accompanied by general net global warmth. Cold modes have the opposite configurations and results. By standardizing the two sets they become more comparable in magnitude. When I add, I am not combining apples and oranges but instead apples, albeit perhaps MacIntosh and Granny Smith.
The adjusted Hadley shows greater warming in the early 1900s (long before the major industrial boom) when the sun emerged from its 100 year cycle slumber than in the El Nino laden warm PDO era from 1979 to 1998.
Unfortunately we can’t do a more elaborate evaluation because Phil Jones at Hadley has refused to provide raw data and adjustments made and claims to have lost some of the original data for want of storage capabilities. They only have for some regions the homogenized, modified data. See this post.
The data centers want to treat their information as proprietary to them but unlike public corporations, they are repositories of data for use by educational and research institutions and are obliged to properly maintain the original data, make it available to anyone who is qualified to work with it, AND document each and every adjustment made and why.
Can you imagine what would happen after an audit or investor review of an annual financial report of any public corporation if they hid key financial information and only supplied carefully processed/manipulated information that showed them in the best possible light. Do we have the ENRON(s) of weather here? All three data centers have a vested financial interest in promulgating global warming. They each have reputations and major funding at risk should a cooling take place. In other words, the foxes are in charge of the data chicken coups.
The only independent data sources are RSS and UAH with satellite analysis. Their work has confirmed the warming of the 1979-1998 period but at about half the rate of the data centers, consistent with that up to 50% contamination in the literature.

See enlarged here.
In all my talks (I and other Icecap members do dozens each year), I address all the issues with the surface data bases and the fact that numerous peer review papers estimate artificial warming contamination of 30-50% or even higher. But just stating that seems to not easily resonate with people. It is hard to visualize mentally what that means.
I do show the US data before and after UHI was removed in 2007 and that helps, but I wanted to try and find a way to adjust the IPCC’s Hadley source with a UHI adjustment to show what 30-50% means and that the warmest 10 years were not in the last 12 years, and that the changes are cyclical and minor, and importantly in the end, that EPA regulation, US congressional legislation and any Copenhagen action is unnecessary and unwarranted.
By Corey Jones, Capitol Journal
The average person may not associate coolness with the sun. The sun releases energy through deep nuclear fusion reactions in its core and has surface temperatures as hot as 10,000 degrees Fahrenheit, according to NASA’s Web site.
Not cool at all. But the sun’s recent activity, or lack thereof, may be linked to the pleasant summer temperatures the midwest has enjoyed this year, said Charlie Perry, a research hydrologist with the U.S. Geological Survey in Lawrence. The sun is at a low point of a deep solar minimum in which there are little to no sunspots on its surface. In July through August, 51 consecutive days passed without a spot, one day short of tying the record of 52 days from the early 1900s.
As of Sept. 15, the current solar minimum ranks third all-time in the amount of spotless days with 717 since 2004. There have been 206 spotless days in 2009, which is 14th all-time. But there are still more than 100 days left in the year, and Perry expects that number to climb. Perry, who studies sunspots and solar activity in his spare time, received an undergraduate degree in physics at Kansas State University and a Ph.D in physics and astronomy at The University of Kansas. He also has spent time as a meteorologist.
Enlarged here
A sunspot, Perry explains, is a location on the sun’s surface that is cooler than the surrounding area. When there are more sunspots, the sun’s surface becomes more dynamic and an opposite effect takes place, releasing more heat and energy when other parts of the sun become hotter.
A solar minimum is when the amount of spots on the sun is at a low and the reverse is true for a solar maximum. The complete solar cycle is about an 11-year process. Perry says the current solar minimum could continue into 2010. “There’s a fair chance it will be a cooler winter than last year,” Perry said. Perry said there is a feeling from some in the scientific community the Earth may be entering into a grand minimum, which is an extended period with low numbers of sunspots that creates cooler temperatures. The year without a summer, which was 1816, was during a grand minimum in 1800 to 1830 when Europe became cooler, Perry said. Another grand minimum was in 1903 to 1913.
Perry said there is anecdotal evidence the Earth’s temperature may be slightly decreasing, but local weather patterns are much more affected by the jet stream than solar activity. However, Perry said snow in Buenos Aires and southern Africa, the best ski season in Australia and a cooler Arctic region are some of the anecdotal evidence for a cooling period. So, Perry said, sunspots may have a far greater impact on weather than previously thought. Perry is a proponent of the cosmic ray and clouds theory as opposed to the CO2 global warming theory to explain recent global warming trends.
The cosmic ray and clouds theory was first put forth in the late 1990’s by Danish physicist Henrik Svensmark. In a July 2007 issue of Discover magazine, Svensmark said the theory is simply that solar activity can alter the amount of clouds in the atmosphere, which affects the temperature of the Earth. More clouds mean a cooler Earth because more of the sun’s heat is being reflected. Fewer clouds equal a warmer Earth.
Perry says data indicates global temperature fluctuations correlate to a statistically significant degree with the length of the sunspot cycle. Longer cycles are associated with cooler temperatures. Johan Feddema, acting chair and professor of geography at KU, studies global warming. Atmospheric science is a program in geography at KU. He says he is skeptical of any one phenomenon being the direct cause of global warming because there are so many climate variables that factor into global temperatures.
Feddema said the warming trend earlier in the century could be attributed to anything from solar activity to El Ninos. But since the mid 1980s he believes data doesn’t correlate well with solar activity, but does correlate well with rising CO2 levels. Feddema believes we may hit global high temperatures in a few years with the underlying factor being rising CO2 levels, coupled with the solar cycle returning to a maximum and an El Nino.
For more information or to view graphs of data pertaining to global climate change, Feddema recommends visiting the Intergovernmental Panel on Climate Change’s Web site at where 2007 assessment reports on climate change can be viewed. He also recommends the Wikipedia entry on solar variation for good visual graphs of data.
Perry said he recommends ICECAP for climate information; Discover Magazine to learn more about Svensmark’s theory; here to view a global temperature and solar activity graph; and his own research Web page.
Read more here.
See how actually the temperatures have correlated well even in recent years below (enlarged here)
Read also here how the solar wind escaping from persisting coronal holes maintained the earth’s magnetic field through the minimum.
By Joseph D’Aleo, Energy Tribune
Sharon Begley, after a five-year stint at the Wall Street Journal returned to greener pastures at Newsweek in 2007, where she started her career. It was just in time to take part in Newsweek’s embarrassing August 13, 2007 issue “Global Warming is a Hoax” edition.
The cover story entitled, “The Truth About Denial” contained very little that could be considered “truth” by journalistic or scientific standards. In what could surely be considered one of the most one-sided coverage of any important issue in American journalism for decades, Sharon Begley with Eve Conant, Sam Stein, Eleanor Clift and Matthew Philips purported to examine the “well-coordinated, well-funded campaign by contrarian scientists, free-market think tanks and industry that they...created a paralyzing fog of doubt around climate change.”
The only problem was—Newsweek knew better. Eve Conant, who interviewed Senator James Inhofe (R-Okla.), the ranking member of the Environment & Public Works Committee, was given all the latest data proving conclusively that it was the proponents of man-made global warming fears that enjoyed a monumental funding advantage over the skeptics (a whopping $50 billion to a paltry $19 million for the skeptics). Newsweek contributing editor Robert J. Samuelson, called the piece “fundamentally misleading” and “highly contrived.”
Begley’s next screed was “Climate Change Calculus: in the August 3, 2009 issue, subtitled “Why it’s even worse than we feared.” She begins: “Among the phrases you really, really do not want to hear from climate scientists are: “that really shocked us,” “we had no idea how bad it was,” and “reality is well ahead of the climate models."[...] Although policymakers hoped climate models would prove to be alarmist, the opposite is true, particularly in the Arctic.”
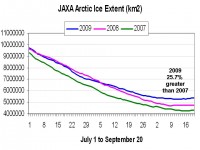
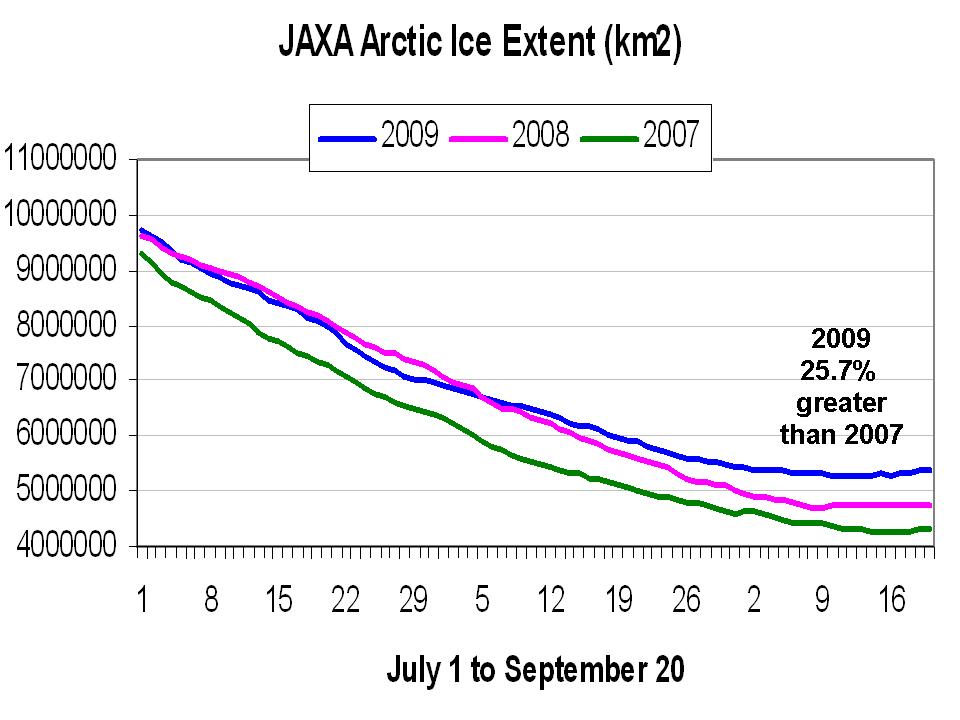
What is the reality? Well the models are failing miserably, but in the wrong direction. Over the last eight years, the world has cooled in contrast with the forecast rise in all the IPCC scenarios. The Arctic ice extent as of September 18, 2009, climatologically close to the maximum melt date, is 24.5% greater than the minimum in September 2007.
JAXA Arctic Ice Extent
See larger here.
None of the models foresaw the cooling that has taken place the last 8 years.
Begley also addressed Greenland and sea level rises quoting David Carlson. “...Greenland is losing about 52 cubic miles per year and that the melting is accelerating. So while the IPCC projected that sea level would rise 16 inches this century, “now a more likely figure is one meter [39 inches] at the least,” says Carlson. “Chest-high instead of knee-high, with half to two thirds of that due to Greenland.” Hence the “no idea how bad it was."”
Other scientists strongly disagree. Ettema et al. (2009) state that “considerably more mass accumulates on the Greenland Ice Sheet than previously thought...which suggests that the Northern Hemisphere’s largest ice sheet may well hang around a whole lot longer than many climate alarmists have been willing to admit.” A 2006 study by a team of scientists led by Petr Chylek of Los Alamos National Laboratory, Space and Remote Sensing Sciences found the rate of Greenland warming in 1920-1930 was about 50% higher than that in 1995-2005, suggesting carbon dioxide ‘could not be the cause’. And Ollier and Pain in August 2009, AIG paper “Why the Greenland and Antarctic Ice Sheets are Not Collapsing” conclude “Variations in melting around the edges of ice sheets are no indication that they are collapsing. Indeed ‘collapse’ is impossible.”
And supporting this non-threat, sea levels have stopped rising in 2005 as the oceans have cooled and contracted, but why let facts get in the way of a good story?
Oceans and the Sun Not CO2
We have reported in earlier stories in this magazine on the importance of natural cycles on the sun and in the oceans in climate change and that these factors should support cooling for the net few decades. There is an increasing body of new peer review support for this.
Mojib Latif of the Leibniz Institute of Marine Sciences at Kiel University, in New Scientist (2009) attributes much of the recent warming to naturally occurring ocean cycles.
“Little seems out of place in recent times except the predictions”, says Dr Syun Akasofu, Founding Director of the International Arctic Research Center of the University of Alaska Fairbanks and former director of the Geophysical Institute. Aksasofu says multi-decadal oscillations, discovered within the past decade, account for the variability.
Earlier this summer in a paper entitled “Has the climate recently shifted?” Kyle Swanson and Anastasios Tsonsis, mathematicians at the University of Wisconsin-Milwaukee, engaged with the problem that temperatures have failed to follow the predictions made by computer climate models. In the paper, Swanson and Tsonis correlated data from the El Nino/La Nina, the Pacific Decadal Oscillation, the North Atlantic Oscillation, and the North Pacific Index and found that synchronizations occurred four times: in 1910-20; 1938-45; 1956-60; and 1976-1981. When coupling between the systems was high, climate invariably changed. The recent cooling, which they suggest started in 2001, is an indicator of another phase shift with a cooling that will last for decades.
Alarmist solar scientists Lean and Rind have reluctantly attributed recent cooling to a quiet sun and foresee a repeat from 2014-2019 the minimum of the next cycle. They have not yet come around to the opinion of many solar scientists including those at NASA, that the sun, which has been quieter, longer than any time since the early 1800s, a period called the Dalton Minimum or mini-ice age, the time of Dickens and cold snowy winters in London, much as we saw last winter.
Begley would benefit from reading the widely praised NIPCC report, Climate Change Reconsidered, an ambitious peer review work the scale of the IPCC, co-authored by Craig Idso and Dr. Fred Singer, which shows why natural factors like the sun and the oceans, not man, control the climate.
Begley proves that she is not only scientifically but also politically illiterate in the third installment of her latest climate crisis coverage. On September 7, in a piece titled “China and India Will Pay,” she declares “A special place in climate hell is being reserved for India and China.” As CORE’s Paul Driessen put it “400 million Indians and 500 million Chinese still do not have electricity. No electricity means no refrigeration, to keep food and medicines from spoiling. It means no water purification, to reduce baby-killing intestinal diseases. No modern heating and air conditioning, to reduce hypothermia in winter, heat stroke in summer, and lung disease year-round. It means no lights or computers, no modern offices, factories, schools, shops, clinics or hospitals.”
Even the IPCC’s chair, Rajendra Pachauri, has defended India’s refusal to cut its emissions, noting that millions of Indians still lack electricity.
But to the technological elite in their ivory towers, the liberal elitist political leaders in Washington, and their adoring media, their loss is but a small price to pay to save the planet from an imagined crisis, one that offers such a golden opportunity to achieve their real goal as none other than Al Gore admitted “of one world governance.” In their journey there, they show more compassion for the white grizzly bear of the polar region and the snail darter than for the humans. They worry more about population than people.
China and India will make us pay as they take away our jobs and become the technological leaders as we model our government after the failed socialist experiments of an ever-declining Europe and even copy their alternative energy boondoggles that will prove to be the next bubble while we sit on huge rich fields of oil, gas and coal that, along with nuclear, could provide the power to revitalize our industries and put America back on top.
Begley authored the 2007 book “Train Your Mind, Change Your Brain.” I would argue she needs to instead re-train her brain and change her mind.
See op ed here.
By David Evans
There has been a change in direction by global warming alarmists, as shown by “Synthesis Report - Climate Change: Global Risks, Challenges & Decisions,” published in Copenhagen and released in June.
In that report, those claiming there is a human-induced global warming crisis have abandoned air temperature as a measure of global climate and switched to ocean temperature.
The change in focus from air temperature to ocean temperature was predictable given the sustained decline in global air temperature over recent years.
The new report claims ocean temperatures are rising, and fast.
This is rubbish, but it will take time to inform the public and politicians that it is rubbish. With the U.S. climate bill and the Copenhagen meeting of the United Nations Intergovernmental Panel on Climate Change coming up, proponents of carbon dioxide restrictions need only to make the public believe these fables for a few months.
New Claims to Refute
All the public education the climate realists have accomplished regarding air temperatures will have to start all over regarding ocean temperatures. Here are some key points to be made:

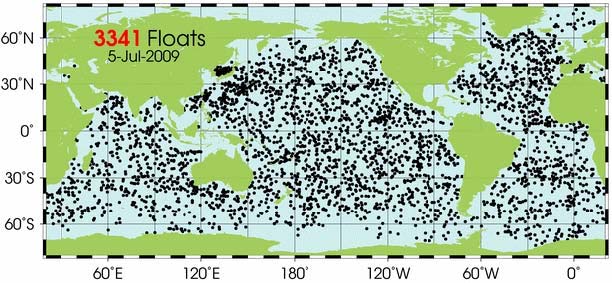
* Ocean temperatures can be measured adequately only by the Argo buoy network. Argo buoys dive down to 700m, recording temperatures, then come up and radio back the results. There are 3,000 of them floating around all the world’s oceans.
* The Argo buoys have been operational only since the end of 2003. Before that, ocean temperatures were gathered by various methods - usually collected by ships in popular commercial shipping lanes - that lacked uniformity, sufficient geographical coverage, and the ability to measure temperature much beneath the surface. The Argo buoy system has added uniformity and greater reliability to ocean temperature measurements.
* According to Argo temperature measurements, the world’s oceans have shown a slight cooling since Argo became operational in 2003. In sharp contrast to model predicted heat build-up
* The Argo data contradict claims humans are causing rapid global warming, because ocean temperatures are not rising as fast as predicted by global warming alarmists. Read more here.
Icecap Note: to enable them to make the case the oceans are warming, NOAA chose to remove satellite input into their global ocean estimation and not make any attempt to operationally use Argo data in the process. This resulted in a jump of 0.2C or more and ‘a new ocean warmth record’ in July. ARGO tells us this is another example of NOAA’s inexplicable decision to corrupt data to suport political agendas.
By Stephen Cauchi, Sydney Morning Herald
THE sun has gone quiet, with a sharp decline in sunspot numbers in the past couple of years - possibly heralding the start of a solar depression that could lead to cooler weather on Earth. During the past millennium, whenever the sun experienced long periods of low sunspot numbers, Earth had equally long, cold snaps. The number of sunspots - dark and intensely magnetic blotches on the sun’s surface - are at their lowest since 1913.
“This is the quietest sun we’ve seen in almost a century,” said NASA solar forecaster David Hathaway.
“Since the space age began in the 1950s, solar activity has been generally high. Five of the most intense solar cycles on record have occurred in the past 50 years. We’re just not used to this type of deep calm.”
Sunspots cause other solar activity such as solar flares and coronal mass ejections, radiation from which can interfere with Earth’s magnetic field, upper atmosphere and, many scientists believe, Earth’s climate.
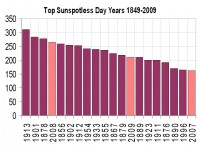
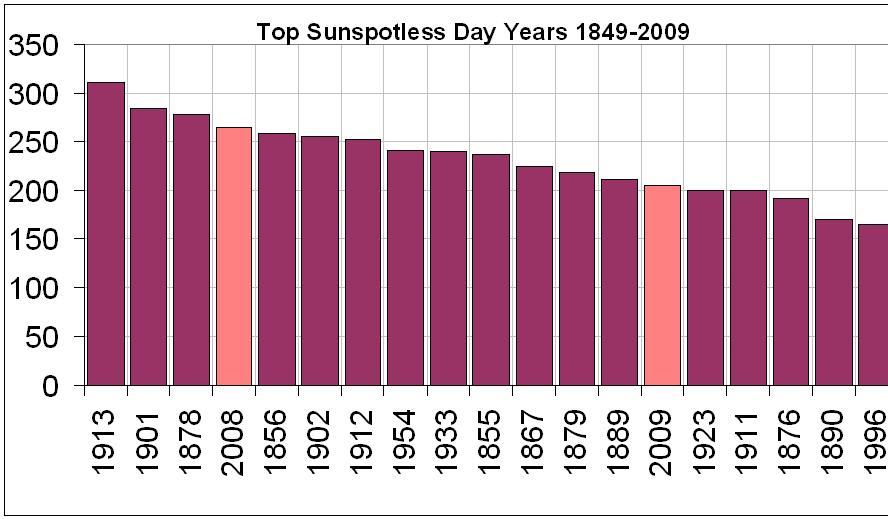
There have been more than 200 spotless days so far this year and scientists expect the count to reach 290 by year’s end. Last year there were 266 spotless days, the previous lowest number recorded since 1913, when there were 311 spotless days.
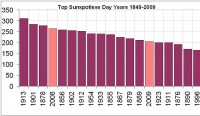
Top 20 years with the most sunspotless days since 1849. As of September 13, we will be at 205 this year rapidly approaching the 266 days in 2008.
Sunspot numbers move in regular cycles of 11 years, so the timing of this quiet spell is not unexpected. What is unexpected is the depth and length of the spell. Some scientists believe it may be the start of a long period when the entire cycle is depressed, as it has been several times during the past millennium.
The most famous depression was the Maunder Minimum of 1645 to 1715 in which sunspots nearly vanished for 70 years. It coincided with the coldest period of the Little Ice Age.
“People are wondering about whether we’re going into another Maunder Minimum or not,’’ said Iver Cairns, from the University of Sydney’s school of physics. “I think the balance of opinion is that it’s too early to tell. But it could be very significant.”
Professor Cairns said the fluctuation in sunspot numbers was not fully understood but it was linked to the “magnetic dynamo of the sun”.
It was equally uncertain how - or indeed if - changes in solar activity affect Earth’s climate.
“What some people think is that energetic particles from the sun get into Earth’s magnetosphere and some of them get down to the ozone layer - you’re talking 40 to 80 kilometres above the surface of Earth. They alter the chemistry of that layer...That changes the chemistry of other layers of the atmosphere, leading to winds and changes in temperature,” he said. See post here.
Sun’s Hibernation Approaches, New Era of Harsh Winters Loom, Could 09-10 Be A Taster?Guest Post by Mark Vogan
With the sun, the thing that keeps us from looking and feeling like Pluto ready to enter hibernation mode, we must now be prepared for what will be a tough 30 years ahead. Remember those winter days of the 1960s and 70s? Well you better prepare now, for those are days that are fast returning. I never have experienced anything other than modern warming. I am 26 years of age and born in the early 80s, global warming had become a way of life, however for people my age or younger, the winters of 96-97, 02-03 and 08-09 are winters that are warm compared to what’s inevitably coming our way as our sun, that warm star which has brought increasingly balmier winters of the past 30 years, shortened our winter, lenghtened our summer and brought remarkable shorts and t-shirt weather to London in November and in January to New York.
Those were the good old Modern Warm Period days, their fast leaving us and a brand new era of winter will bring us back to where we were in the 60s and 70s but likely further back in time when non of us where born. We often read about those scary winters of the late 1800s and early 1900s when regular freezing of the Thames and Dutch Canals were the norm and temperatures as far south as Kent, England hit the -20s C and New Yorkers could walk from New Jersey to Manhattan, well those are the times we are likely going to face and what worries me is that we may have a winter just a couple of months away that may be more severe than anything predicted.
Last winter in the Midwest and Lakes and in the UK I believe is a wake up call to the Northern Hemisphere and world that things are changing on a global scale and for the long term. I believe the pattern that’s been shaped since the La Nina of 2008, the rebuilding of the Arctic sea ice, the new record low set in Maine and what likely should have been a new Illinois record low is sure signs of cold times ahead. The 1930s displayed much warmer conditions here in the Northern world than anything seen in the 1990s and 2000s, in fact since the turn of the millenium we have clear cut evidence that suggest our world is cooling, but it’s been so warm that even now as we see cooling, we are still above normal, if we aren’t cooling and we’re still warming up why are NOAA taking away data measuring equiptment and doing other things to change the results? If we continued warming, you wouldn’t need to do anything other than sit back and watch as their theory takes charge.

Within this winter of 09-10, we may see another selection of locations in which all-time cold records are threatened we may even see another new state record for cold sometime in either January or February 2010 when New York City experiences a few days in which they struggle to get out of the single digits and nights get into the old territory of below zero. I predict this winter will bring below zero air as far south as Baltimore and DC and one of the worst snowstorms since the 70s the precedes a fiercely cold high!! We may see a blizzard cripple the DC-NY-Boston corridor before an Arctic high settles in from Ontario and Quebec which brings 50 to 60 below zero nights to central Ontario and Quebec. Somewhere in New England including Maine may face a week to two below zero and see nights get as cold if not colder than the cold outbreak of January 2004. That particular cold spell brought New York to 1 degree and 45 below to Mt Washington, NH. This time around New Hampshire may end of rewriting the history books and end of with a brand new low around -50, deeming the old -47 record, history.
New Jersey we see nights hit -20, Massachussetts -30, Boston -10 or colder and New York’s Central Park get to between -2 and -5. DC could shiver to zero or lower!!
My reason for this very blunt article is that with the trend of the El Nino and the likelyhood that the warm cool pushes into the central equatorial Pacific and cooling shows up off South America, the pattern that’s been shaping this very type of severity of Eastern winter the past few years and the very low solar wind and low solar irradiance is greatly concerning me, not forgetting the kind of summer just witnessed across the eastern third, the signs are screaming for such a winter to come and this for me is the winter which will rewrite the history books and bring to the front row the shouts and screams of a coming ice age.

The winter in 09-10 for the West will be mild overall but an intense cold wave early on (December) may bring fears of a brutal winter from the California Sierra to the western High Plains but as the pattern establishes itself and ridging develops over the North Pacific into Alaska and the Arctic, the vast pool of super cold air will then filter into the heart of the eastern US and brings one of the worst blasts of Arctic air not seen seen the late 70s.
This will be a sure sign of whats ahead, though we continue to see publications regularly promote global warming goodies such as the warmest summer ocean temperatures on record, yet we fail to see the seasonal number top 5 in the Atlantic and only one super typhoon we will begin to see a more uniform cooling down of both land and ocean as the sun begins to hide into hibernation and the Atlantic turns cold. The worst is still ahead by about 20 years but winters of great harshness may be only a few months away and it will only get worse as we see before our eyes the freeze over of the global warming idea as ice flow start to head from New York harbor into the Atlantic and from the Thames into the North Sea. Great Britain may also see one of it’s worst winters in 30 years with new record lows set and a potential threat to the national all-time low. Making last winter a mere wake-up call. See post here.