


This story on Our Amazing Planet, attempts to clear volcanoes from causing cooling - focusing on the cold year after Iceland’s Laki in 1783/84. They instead blame the Artic and North Atlantic Oscillation. As we point out on WeatherBell, the high latitude volcanoes help induce strongly negative AO and NAO in winters which produce cooling.
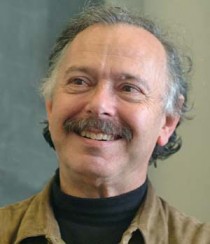
By the way, Bezymianny in Kamchatka erupted Wednesday. Japan’s VAAC reported RED aviation code and a report of ash at flight level 33,000 feet. It was later downgraded to orange. High latitude volcanoes don’t need to be as large because the stable stratosphere is on average 8 km (26,000 feet).
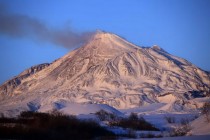
Photo when Bezymianny was quiet and skies clear
By Charles Q. Choi, Our Amziang Planet
The eruption of a volcano in Iceland is often blamed for the unusually harsh winter of 1783 to 1784 around the North Atlantic. But new research lays the blame for the extreme cold elsewhere.
Scientists find that the extremes of cold back then might actually have been triggered by the same climate effects potentially responsible for the unusually cold and snowy winter that Europe and North America experienced from 2009 to 2010.
These new findings shed light on how extremes in natural variability in climate have played - and still play - a key role in our world today, along with any recent global warming effects, the researchers said.
Laki erupts
Iceland’s Laki volcano began erupting on June 8, 1783, and continued doing so for months, causing a major environmental disaster. The volcano spewed out toxic fumes that spread over northern latitudes, causing about 23,000 deaths in Britain alone.
The summer of 1783 saw heat waves, extreme cold, widespread famines, crop failures and livestock losses - a crisis that might have even hastened the French Revolution. The following winter, record cold was seen around the North Atlantic. Temperatures in Europe were about 3.6 degrees Fahrenheit (2 degrees Celsius) below average for the late 1700s, and the winter was also one of the coldest of the past 500 years in eastern North America.
The Laki eruption has been blamed for that exceptionally deadly winter. But the new findings now may exonerate the volcano. Instead of its ashes and gas triggering a colder winter, scientists suggest that the cold snap might have been caused by an unusual combination of climate effects that apparently are similar to those that made the 2009 to 2010 winter so bitter in western Europe and eastern North America.
Then and now
In the winter of 2009 to 2010, the North Atlantic Oscillation (NAO), a climate phenomenon in the North Atlantic sector, went through a negative phase, meaning less warm air flowed into Europe and more cold Arctic air headed toward North America. At the same time, the El Nino-Southern Oscillation (ENSO), a climate pattern in the tropical Pacific Ocean, went through a warm phase, which can potentially cause wetter, cloudier winters in northern Europe and enhanced storms to hit the central and southern latitudes of the United States.
After analyzing 600 years’ worth of data in tree rings, which preserve details about the climate in which the trees grew, the scientists found that NAO and ENSO conditions during the 1783 to 1784 winter were similar to those seen in the 2009 to 2010 winter. In ranking this kind of combined NAO-ENSO events, the researchers found that the 2009 to 2010 winter showed the strongest combined effects and the 1783 to 1784 winter the second strongest in the past 600 years.
At the same time, their simulations of the effects of the Laki eruption and its dissipation through the autumn of 1783 suggest that it did not play a key role in these events.
“What is most interesting to me is the ability to place recent climatic extremes - for example, the winter of 2009 to 2010 - into a long-term context using tree ring and other paleo-records,” Rosanne D’Arrigo, a dendrochronologist at the Lamont-Doherty Earth Observatory of Columbia University, told OurAmazingPlanet. “Our results indicate that natural variability and extremes still play an important role in our climate today, along with global warming effects.” H/T Marc Morano
By Tim Blair, AU Telegraph
Former Al Gore senior aide Leslie Dach dared to dream:
In July 2006, Dach was installed as the public relations chief for Wal-Mart. He drafted a number of other progressives into the company, seeking to change the company’s way of doing business: its culture, its politics, and most importantly its products.
Out went drab, inexpensive merchandise so dear to low-income Americans. In came upscale organic foods, “green” products, trendy jeans, and political correctness. In other words, Dach sought to expose poor working Americans to the “good life” of the wealthy, environmentally conscious Prius driver.
How did that all work out?
After suffering seven straight quarters of losses, today the merchandise giant Wal-Mart will announce that it is “going back to basics,” ending its era of high-end organic foods, going “green,” and the remainder of its appeal to the upscale market. Next month the company will launch an “It’s Back” campaign to woo the millions of customers who have fled the store.
Further from the Wall Street Journal:
Starting in May, Wal-Mart shoppers in the U.S. will see signs in stores heralding the return of fishing tackle, bolts of fabric and other ‘heritage’ merchandise that Wal-Mart reduced or cut out altogether as it attempted to spruce up its stores…
There’s a lesson here for all manner of mass-consumer businesses.
By John Nicol, Doomed Planet
Global warming research: whatever happened to the scientific method?
Global warming, and its euphemistic sibling “climate change”, remain much in the news. Specialist research groups around the world continue to produce an unending sequence of papers aimed at demonstrating a litany of problems which might arise should global warming resume. The authors’ prime expertise is often found to be not in atmospheric physics or aeronomy, as one might have anticipated. However, the topic of climate change itself provides for abundant research funding, from which they feed, more easily than other areas of research of greater interest and practical use. Most of these papers are, of course, based upon the output from speculative and largely experimental, atmospheric models representing exercises in virtual reality, rather than observed, real-world, measurements and phenomena. Which leads to the question “What scientific methodology is in operation here?”
Though much has been written concerning the scientific method, and the ill defined question as to what constitutes a correct scientific approach to a complex problem, comparatively little comment has been made about the strange mix of empirical and virtual reality reasoning that characterises contemporary climate change research. It is obvious that the many different disciplines described as being scientific, rather than social, economic, or of the arts, may apply somewhat different criteria to determine what fundamental processes should define the “scientific method” as applied for each discipline. Dismayingly, for many years now there has been a growing tendency for many formerly “pure” scientific disciplines to embody characteristics of many others, and in some cases that includes the adoption of research attitudes and methods that are more appropriately applied in the arts and social sciences. “Post-modernism”, if you like, has proved to be a contagious disease in academia generally.
Classical scientific method generally follows the simple protocol of first defining an hypothesis concerning the behavior or cause of some phenomenon in nature, either physical, biological or chemical. In most well defined areas of research, previous theory and experiment may provide such a wide and complex corpus of knowledge that a new hypothesis is not easily nor singly defined, and may even be left unstated.
This is most commonly the case when a number of diverse disciplines, all important for attaining an understanding of a particular problem, are providing results which lead to contradicting conclusions. A contemporary example of this is discussions of the greenhouse effect, which is one of the most controversial topics ever to be considered within the scientific community. Conventional thinking on the greenhouse effect is encapsulated in the IPCC’s statement that “We believe that most of the increase in global temperatures during the second half of the twentieth century, were very likely due to the increases in the concentration of atmospheric carbon dioxide”.
Clearly this statement would be better worded were it to have been framed as a hypothesis rather than a belief, and treating the statement that way allows it to be rigorously tested ("beliefs", which are unable to be tested, fall outside of the spectrum of science). In the real scientific world, for such an hypothesis to survive rigorous scrutiny, and thereby to perhaps grow in strength from a hypothesis to a theory, requires that it be examined and re-examined from every possible angle over periods of decades and longer.
In conventional research, the next step - following the formulation of the hypothesis in whatever form it may take - is to select what measurements or analyses need to be done in order to test the hypothesis and thus to advance understanding of the topic. Most often, theoretical reasoning as to why an hypothesis might be correct or incorrect is followed by the development of experiments in laboratories, or the making of careful observations in nature, which can be organized and classified, and from which measurements can be made and conclusions drawn.
The theoretical analysis may be qualitative, highly structured or written in terms of a precise mathematical formalism, which provides a basis for describing a model or picture of the phenomenon and the behavior of observables associated with it. We may for instance, choose to include conjecture on quantities which are hidden from observation but whose presence and effects may be simply understood through the measured behavior of larger-scale observables. As work progresses, theoretical reasoning and experiment work in harmony, one or other progressing foremost at a given time, but they are inevitably locked together by the need to represent experimental observations and results in theoretical terms. The mandatory requirement in all of this is that all aspects of an hypothesis (and nascent theory) must be justifiable, meaning justified in terms of observation and measurement.
Examples of this process abound in physics where theoretical reasoning and experiment, have, since the days of Newton, Faraday and the other great masters, marched together in step. In some cases theory trailed the evidence, in others the reverse. Here are some historical examples, based upon familiar cases which are frequently referred to even in the popular press.
The development by Max Planck of the mathematical law that represents the natural distribution of radiation from a hot cavity followed a very long process of developing theoretical explanations to best fit the evidence from measurements that had been made as long as thirty years before. Intermediate steps along the way included the approximate formulae of Wein and Rayleigh, both of which provided reasonably accurate representations when Planck’s formula was applied to the extreme limits of the radiation field, but which proved to be less powerful and general in application than Planck’s final formulation. Later gestation of Plank’s embryo discovery led to the development of the powerful and technologically empowering quantum mechanics and electrodynamics theories. Along the way, again, there was a trail of experiments which sprang from the stimulation of theoretical reasoning yet simultaneously raised questions which required understanding through mathematical analysis. During all of this, mutually supportive yet competitive research, observation, experiment and theoretical reasoning, played off one another in a constructive, “scientific” fashion, leading eventually to the development of the laser, the transistor, the scanning electron microscope, the MRI, cat scan, cochlear hearing, the super and desk top computers and countless other modern technical and medical machines. Good, fundamentally sound scientific discoveries are gifts beyond price, that simply keep on giving.
The same type of history applied in the development of the acknowledged triumph that was Einsteins theory of special relativity. Einstein’s breakthrough was built on the strong, earlier theoretical work of Lorenz and others, who provided the formalism that allowed the classical electromagnetic equations of James Clerk Maxwell to be seen as a universal description of electromagnetism. Thus was provided a basic description of the actions of light, X-rays and radar, while at the same time sweeping away a long held consensual belief in the luminescent ether, an erstwhile all pervading but undetectable substance that was proscribed as the carrier of light from the stars, the sun and man on earth. Looking back with the benefit of hindsight, “belief” in the ether shows many similarities with the strong belief that some modern scientists espouse that dangerous global warming is being caused by human-related carbon dioxide emissions.
Maxwell’s equations grew directly from Faraday’s classical experiments. Einsteins theory placed these equations in a universal framework. Quantum electrodynamics harnessed Maxwell and Planck into modern quantum theory, while relativity itself remains largely a curiosity in spite of its importance in placing other theories and experimental results into a robust description of important aspects of nature. Nevertheless, all of these theories, and the results of early experiments which sought either to justify or destroy them, continue to be placed under the most careful contemporary research scrutiny, on scales that range from examination of the smallest particles in nature to the cosmological description of the universe.
As long as 70 years after the acclaimed publication of Einstein’s Relativity theory, experiments were still being conducted using refined laser techniques in attempts to show that some vital predictions flowing from this theory were invalid. Over the same period, conceptual acceptance occurred of the implications of the so-called “Twin Paradox” which also followed from this theory, which led to a Herculean battle between two unforgiving protagonists, H.W. McRea and Herbert Dingle, in a series of articles published in Nature. Subsequently, and appropriately, the answer was defined by an experiment - to whit, the measurement of the decay of a radioactive sample traveling by satellite. Einstein’s less commonly described General Theory of Relativity is still undergoing constant review in most of its parts - as, to some minor extent, is the special theory also. The important point to absorb here is that ALL scientific results are provisional, as well encapsulated by Nobel Prize winner Richard Feynmann’s immortal observation that “A scientist is someone who believes in the ignorance of experts”.
In all of this turbulent and adversarial history of fundamental truths of nature, there has been robust argument amongst many varied scientists and research groups, but against a background of respect between all participants. There has always been a liberal sharing of ideas, at the same time as a strong defense was offered by an individual of his own. The incontrovertible historic evidence of the rapid exchange of ideas by means of publications of short letters and articles during these phases of scientific creativity is proof positive of the importance of freedom of data sharing and information at a level of which many modern scientists can only dream.
That some meteorological agencies and “leading” climate scientists believe that they have the right to deny provision of their data to other credentialed scientists is but one of the signs of a research pathology that characterizes many powerful, contemporary climate science teams.
Electromagnetism, relativity and quantum mechanics are now very generally accepted, not least because they have been thoroughly tested by a large range of differing experimental approaches. Nonetheless, controversies still exist in discussions of the fine details of the theory, while at the same time the results of more exotic measurements are seriously questioned if they do not fit the theory. This process of continuous testing of both theory and experiment has the tremendous benefit in stimulating further experiments and differing hypotheses which often lead to new discoveries. In all of this, the Plancks, Bohrs, Diracs, Einsteins, Heisenbergs and Schrodingers stood way out from the crowd, as do their modern counterparts to this very day.
Just as there were debates on relativity, there were also some serious sceptics in the quantum world, some of whom used the debate between Einstein and Bohr on the interpretation of the equations of Quantum Mechanics to discredit it. In the end, Bohr’s so-called Copenhagen interpretation prevailed, which describes a quantum world of probabilities that lie within a proscribed range of an unrelenting uncertainty. Einstein’s claim that “Der liebe Gott würfelt nicht mit der Welt” now has few supporters, but followed him to the grave. Among other notable antagonists of quantum theory, Professor Frederick Lindemann (Viscount Cherwell) at the Clarendon Laboratory in Oxford, would not allow the teaching of quantum mechanics in his classes right up until the 1940s
Out of this cut and paste “history” of physics, comes the strongest criticism of the mainstream climate science research as it is carried on today. The understanding of the climate may appear simple compared to quantum theory, since the computer models that lie at the heart of the IPCC’s warming alarmism dont need to go beyond Newtonian Mechanics. However, the uncertainty in Quantum Mechanics which Einstein was uncomfortable with, was about 40 orders of magnitude (i.e. 10^40) smaller than the known errors inherent in modern climate “theory”. Yet in contemporary research on matters to do with climate change, and despite enormous expenditure, not one serious attempt has been made to check the veracity of the numerous assumptions involved in greenhouse theory by actual experimentation.
The one modern, definitive experiment, the search for the signature of the green house effect has failed totally. Projected confidently by the models, this “signature” was expected to be represented by an exceptional warming in the upper troposphere above the tropics. The experiments, carried out during twenty years of research supported by The Australian Green House Office as well as by many other well funded Atmospheric Science groups around the world, show that this signature does not exist. Where is the Enhanced Green House Effect? No one knows.
In addition, the data representing the earth’s effective temperature over the past 150 years, show that a global human contribution to this temperature can not be distinguished or isolated at a measurable level above that induced by clearly observed and understood, natural effects, such as the partially cyclical, redistribution of surface energy in the El Nino. Variations in solar energy, exotic charged particles in the solar wind, cosmic ray fluxes, orbital and rotational characteristics of the planet’s motion together provide a rich combination of electrical and mechanical forces which disturb the atmosphere individually and in combination. Of course, that doesn’t mean that carbon dioxide is not a “greenhouse gas”, so defined as one which absorbs radiation in the infra red region of the spectrum. However, the “human signal”, the effect of the relatively small additional gas that human activity provides annually to the atmosphere, is completely lost, being far below the level of noise produced by natural climate variation.
So how do our IPCC scientists deal with this? Do they revise the theory to suit the experimental result, for example by reducing the climate sensitivity assumed in their GCMs? Do they carry out different experiments (i.e., collect new and different datasets) which might give more or better information? Do they go back to basics in preparing a new model altogether, or considering statistical models more carefully? Do they look at possible solar influences instead of carbon dioxide? Do they allow the likelihood that papers by persons like Svensmark, Spencer, Lindzen, Soon, Shaviv, Scafetta and McLean (to name just a few of the well-credentialed scientists who are currently searching for alternatives to the moribund IPCC global warming hypothesis) might be providing new insights into the causes of contemporary climate change?
Of course not. That would be silly. For there is a scientific consensus about the matter, and that should be that.
A Forecasting Expert Testifies About Climate ChangePublished: April 10, 2011
In ”The Truth, Still Inconvenient” (column, April 4), Paul Krugman begins with a “joke” about “an economist, a lawyer and a professor of marketing” walking into a room, in this case to testify at a Congressional hearing on climate science.
I am the marketing professor, and I was invited to testify because I am a forecasting expert.
With Dr. Kesten C. Green and Dr. Willie Soon, I found that the global warming alarm is based on improper forecasting procedures. We developed a simple model that provides forecasts that are 12 times more accurate than warming-alarm forecasts for 90 to 100 years ahead.
We identified 26 analogous situations, such as the alarm over mercury in fish. Government actions were demanded in 25 situations and carried out in 23. None of the alarming forecasts were correct, none of the interventions were useful, and harm was caused in 20.
Mr. Krugman challenged 2 of the 26 analogies, “acid rain and the ozone hole,” which he said “have been contained precisely thanks to environmental regulation.” We are waiting for his evidence.
“What’s the punch line?” he asked. I recommended an end to government financing for climate change research and to associated programs and regulations. And thats no joke.
J. SCOTT ARMSTRONG
Philadelphia, April 6, 2011
The writer is a professor at the Wharton School, University of Pennsylvania.
ICECAP NOTE: See this recent post
Forecasting Expert Calls for End to Government-Funded Research on Global Warming
Heartland Press Release
In testimony yesterday before the Subcommittee on Energy and Environment Committee on Science, Space and Technology, forecasting expert J. Scott Armstrong of the Wharton School at the University of Pennsylvania called on Congress to cease funding global warming research, programs, and advocacy organizations.
Referring to an analysis he conducted with Kesten C. Green of the University of South Australia and Willie Soon of the Harvard-Smithsonian Center for Astrophysics, Armstrong told the subcommittee, “We approach the issue of alarm over dangerous manmade global warming as a problem of forecasting temperatures over the long term. The global warming alarm is not based on what has happened, but on what will happen. In other words, it is a forecasting problem. And it is a very complex problem.”
The three researchers audited the forecasting procedures used by the Intergovernmental Panel on Climate Change (IPCC), whose “procedures violated 81% of the 89 relevant forecasting principles,” Armstrong noted.
Armstrong and his colleagues recommend Congress end government funding for climate change research as well as other research, government programs, and regulations that assume the planet is warming. They also recommend Congress cease funding organizations that lobby or campaign for global warming.
“Based on our analyses, especially with respect to the violations of the principles regarding objectivity and full disclosure,” Armstrong told members of Congress, “we conclude that the manmade global warming alarm is an anti-scientific political movement.”
Armstrong can be reached for further comment at 610-622-6480 or armstrong@wharton.upenn.edu. A copy of the report he submitted to the committee is available online.
By Joseph D’Aleo, CCM, WeatherBell
Snow as the first week of April drew a close was still extensive across Canada and Asia. It remains well above the normal as it did the entire winter.

Meanwhile the Gulf of Mexico has warmed above normal due to the southeast ridge the last 6 weeks.
The means more then normal north to south contrast and moisture aplenty to help feed spring severe weather activity. Normally La Nina springs have more severe weather activity as have posted earlier.
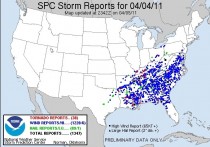
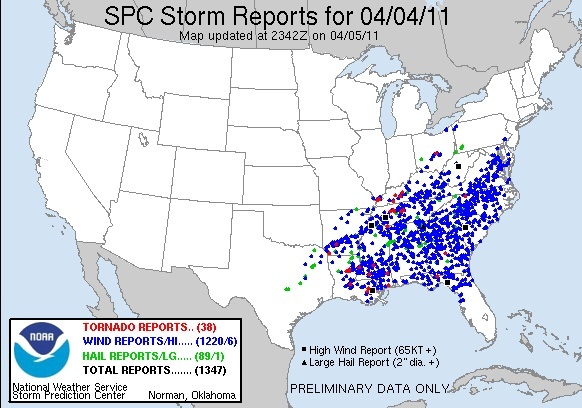
Last Monday, April 4th was one of the most active days in recent memory for the Storm Prediction Center and folks who live in the southeast with 1347 severe weather reports (1220 high wind, 89 hail and 38 tornado) from the Ohio River southeast to northern Florida. Virtually everyone in the southeastern United States felt the fury.
See this link for a listing of all the 1347 reports.
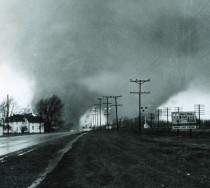
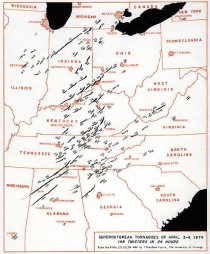
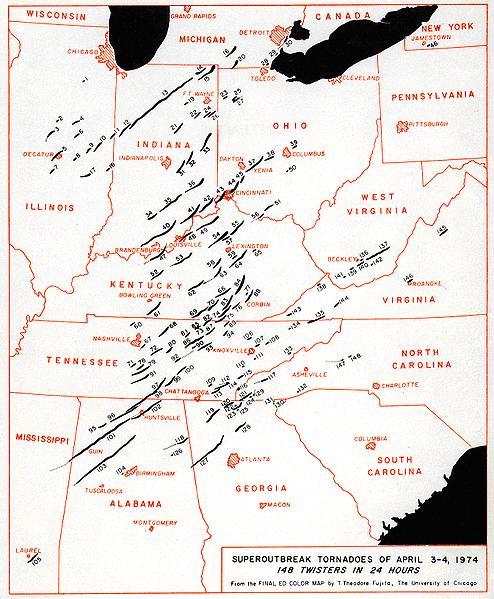
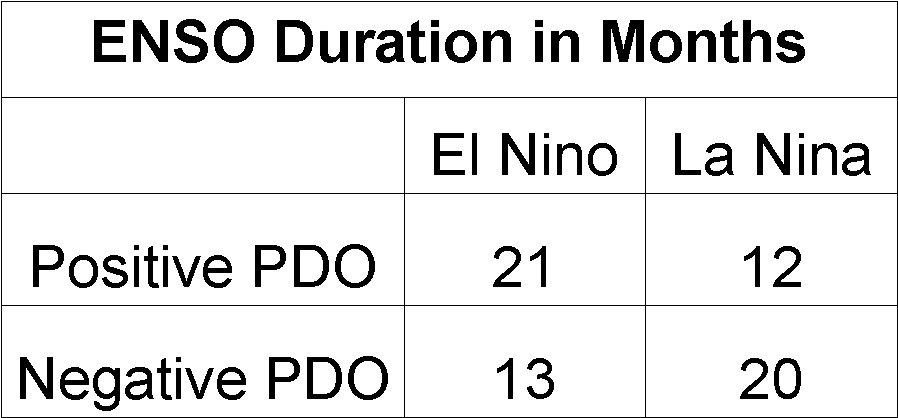
April and May should keep forecasters busy. In my first WeatherBell post, I discussed the potential for some very big severe weather days as is the case in La Nina years in a cold PDO (Pacific Decadal Oscillation). The Palm Sunday outbreak in 1965 and the Superoutbreak in 1974 were just two prime examples.
The Palm Sunday tornado outbreak on April 11, 1965 involved 47 tornadoes (15 significant, 17 violent, 21 killers) hitting the Midwest. It was the second biggest outbreak on record. In the Midwest, 271 people were killed and 1,500 injured (1,200 in Indiana). It was the deadliest tornado outbreak in Indiana history with 137 people killed. The outbreak also made that week the second most active week in history with 51 significant and 21 violent tornadoes. The tornado which hit Midway trailer park is disputed to be an F5, as 25 homes were literally and figuratively wiped off the face of the earth, with no signs of them ever found.
NOAA image for the famous Elkhart, IN double funnel tornado that hit the Midway Trailor Park.
The Super Outbreak of April 34, 1974 spawned 148 confirmed tornadoes across eastern North America and resulted in the second highest death toll (319) in the United States. Not only did it produce an exceptional number of tornadoes, but it was also an inordinately intense outbreak producing dozens of large, long-track tornadoes, including 7 F5 and 23 F4 tornadoes. More significant tornadoes occurred within 24 hours than any other week in the tornado record.
Severe weather is likely today and tomorrow with moderate risks both days.

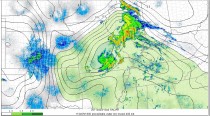
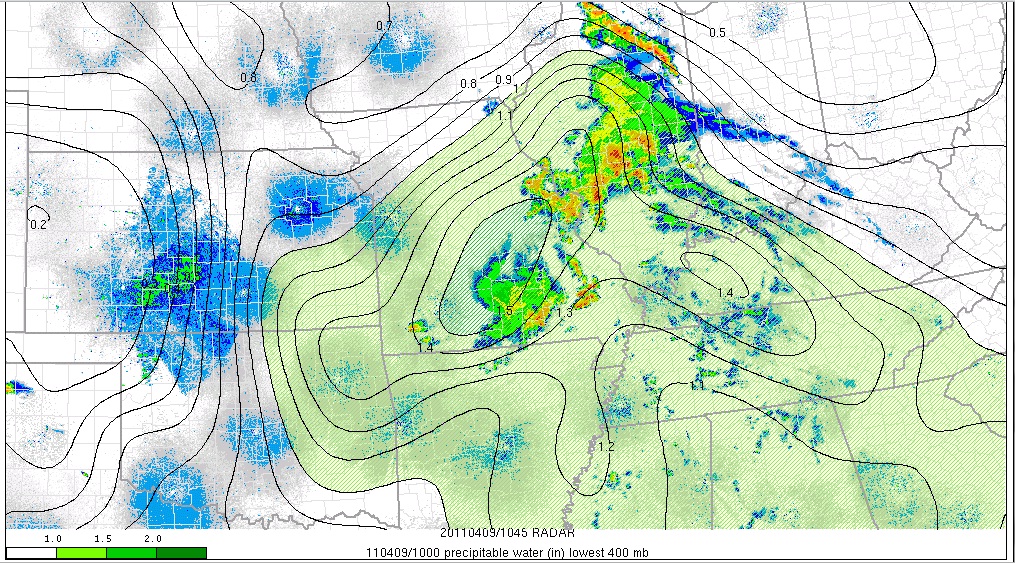
You can see the moisture (precipitable water - total water in inches in the atmospheric column) in this early Saturday analysis with the radar showing showers and thunderstorms.

See more on WeatherBell posts by Joe Bastardi and I.
The Regional Greenhouse Gas Initiative, or RGGI, is designed to reduce greenhouse gas emissions 10-percent by 2018.
But now, three of the 10 states in the initiative are considering withdrawing, in part because of the cost to electric ratepayers.
As part of a collaboration with Northeast stations, Amy Quinton with New Hampshire Public Radio reports.
The goal of the Regional Greenhouse Gas Initiative is to make polluters pay while raising millions of dollars for energy efficiency and renewable energy projects.
It requires power plants to buy one pollution credit at auction for every ton of greenhouse gases they release.
So far those auctions have netted more than 860 million dollars.
But now, some lawmakers in three states - New Hampshire, Maine, and New Jersey - want to get out of RGGI.
“We should have never joined in the first place.”
That’s New Hampshire Republican Representative Jim Garrity speaking on the house floor.
“RGGI should be repealed now because it rests on shaky economic science, namely that the government should collect some money from all of us, to redistribute that wealth to a few of us.”
Garrity says not everyone gets RGGI money to pay for energy efficiency projects.
He and other Republicans have referred to RGGI as a hidden carbon tax that’s passed on to electric ratepayers.
Legislation to repeal New Hampshire’s participation in RGGI recently passed the house, but has yet to pass the Senate.
Dan Soslund, with the group Environment Northeast, says the move in New Hampshire is discouraging.
“I think the public deserves to hear their elected officials talk about policy direction based on facts and the facts are that RGGI has had almost no quantifiable bill impact”
But electric bills for residential customers in the Northeast have increased slightly because of RGGI.
In 2010, it cost an extra 28 to 68 cents a month according to RGGI Inc.
Ross Gittell, an economist with the University of New Hampshire, says electric bills won’t decrease if the state withdraws from RGGI because New Hampshire is part of a regional power grid.
“If we don’t participate in RGGI, we will pay some of its costs, and we will not get the benefits in the form of carbon allowance revenue that we receive which is quite significant.”
Critics of the program point out that New Hampshire, New Jersey and New York diverted some of that RGGI revenue to fill their budget gaps.
New Hampshire is not only state attacking RGGI.
In Maine, Republican Senator Tom Saviello is sponsoring a bill that would withdraw his state from RGGI.
΄We need to ask this question, number one do we want to put the extra cost on our electricity, and number two if these energy efficient projects are that good, which everybody says they are, well then a business should be willing to put their own money into it, why should we be subsidizing that.”
If Maine and New Hampshire withdraw from RGGI, analysts say the program is still likely to continue.
That may be because Maine and New Hampshire don’t release a lot of greenhouse gases.
So the number of pollution credits they sell at auction is small.
But New Jersey’s Governor is also talking about withdrawing from RGGI.
That state makes up 12 percent of the carbon market.
Anthony Leiserowitz, with the Yale University Project on Climate Change, says if New Jersey steps out it could deal a death blow to RGGI.
“How it plays nationally however is that it just seems to accelerate this sense that the country as a whole and in particular Republicans and Conservatives in this country are really climbing out on a limb farther and farther away from climate science.”
Leiserowitz says RGGI does more than reduce carbon emissions in the Northeast. If RGGI stays intact, it could be a model for the rest of the country.
Icecap Note: that is so all the rest of you can suffer too. Europe’s Green subsidy experiment failed with not only increased energy costs putting more people in energy poverty, but every green job cost 2.2 real jobs in Spain, 3.4 in the Uk and over 4 in Italy. In all cases the CO2 emissions went up not down as coal fired back up plants were required to meet the real energy needs that the unreliable renewables could not. Many industries moved plants to India or China to maintain profits. It is a pie in the sky enviro, ivory tower university scheme that doesn’t work. There are many examples of dismal failures in trying to control what doesn’t need control - the mercury carrying and expensive CFLs, the forced non use of DDT with tens of millions of excess malaria deaths, the imposed poverty in the third world through prohibition of power plants, and on and on. CO2 is not a pollutant, not a health hazard but a benefactor, a plant fertilizer. All life on the planet depends on it.
Noami Oreskes wrote a book about skeptics - “Merchants of Doubt”. She represents a movement about which a book could be written “Merchants of Death”. This is hard for me to say, a former environmentalist in my youth. But the movement has been hijacked by those who profess it is all about science but act with a political and social (asocial) agenda and who are benefiting hugely from government grants and subsidies.
Hat Tip thanks to Eric Werme, who joined me and two other scientists in public hearings in NH and has maintained a web page on the RGGI repeal battle here.
UAH UPDATE:
The UAH March numbers are in. March 2011 was coolest in more than a decade.
Enlarged.
Global Temperature Report: March 2011
Global composite temp.: -0.10 C (about 0.18 degrees Fahrenheit) below the 30-year average for March.
Northern Hemisphere: -0.07 C (about 0.13 degrees Fahrenheit) below 30-year average for March.
Southern Hemisphere: -0.13 C (about 0.23 degrees Fahrenheit) below 30-year average for March.
Tropics: -0.35 C (about 0.63 degrees Fahrenheit) below 30-year average for March.
Driven by the La Nina Pacific Ocean cooling event, global average temperatures in March 2011 were the coolest March since 1999, according to Dr. John Christy, professor of atmospheric science and director of the Earth System Science Center at The University of Alabama in Huntsville.
It was the fifth coolest March in the tropics, where the average temperature fell 0.35 C (about 0.63 degrees Fahrenheit) below seasonal norms. Three of the five coldest tropical Marches in the 33-year satellite temperature record have happened in the past dozen years: 5th, 2011, -0.35 C: 3rd, 2000, -0.42; and 2nd, 2008, -0.58 C.
---------------
Steve Goddard reports (H/T Marc Morano)
Hansen, March 31
“Based on subsurface ocean temperatures, the way these have progressed the past several months, and comparisons with prior El Ninos, we believe that the system is moving towards a strong El Nino starting this summer. it’s not a sure bet, but it is probable.”
By Joseph D’Aleo, CCM, on WeatherBell
The La Nina has weakened in the late winter and early spring, as most do.
The cold water in the eastern Pacific has become patchy. Some of the ENSO models have been predicting the bounce back to El Nino. The NASA GMAO model was the most aggressive in this regard taking it to a borderline strong El Nino.
Enlarged
This weakening happened in 2008 after the La Nina winter of 2007/08 we actually warmed above normal even to the central Pacific briefly before cooling resumed. We covered this is some detail in this recent post.
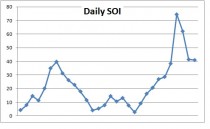
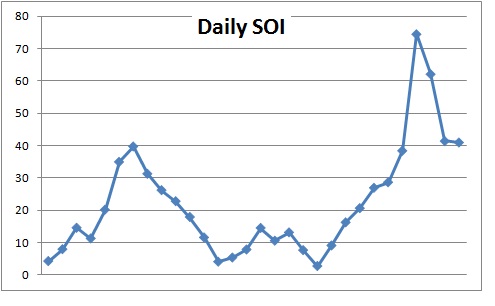
The Southern Oscillation Index (SOI) if El Nino was coming on would be strongly leading the charge by dropping into negative territory. You can see how positive it has been in the last year.
See how it 2008 it dipped in July to a slight negative before rebounding into the second La Nina winter before El Nino conditions kicked in by the summer of 2009.
The last 30 days the SOI has been dramatically positive, just three days ago spiking to more than 7.5 STD positive (La Nina). This will enhance the easterlies in the tropical zone.
Indeed the new CFS ensemble model (version 2) has in many of the latest forecast models shown a dramatic late year cooling after the rebound into the early summer.
This fits better the ENSO pattern in the cold (negative) PDO - we tend to get more La Ninas and they tend to last longer than the El Ninos, the opposite of the warm PDOs.

See post and others on WeatherBell.
Note: Hansen and the warmers think of El Ninos as their friend and La Ninas as a temporary nuisance that stops the warming. The difference between El Nino peaks and La Nina troughs have been in the 13 month running average about 0.5C (0.9F). Clearly one of the reasons we saw warming between 1979 and 1998 was we had 3 times as many El Ninos which lasted twice as long as La Ninas. That is why you will never hear a warmist speak about PDO though they will (have to) use La Ninas as an excuse for when it cools.
Neville Nicholls on Australia’s Extreme RainfallBy Roger Pielke Jr.
Neville Nicholls is one of Australia’s leading climate scientists. He is also a long-time participant in the IPCC and current president of the Australian Meteorological & Oceanographic Society. I first met Neville in the mid 1990s (at a meeting in Vietnam I think) and I have had nothing but great respect for him ever since. In his latest “AMOS - President’s Column” he asks, “What caused the eastern Australia heavy rains and floods of 2010/11?”
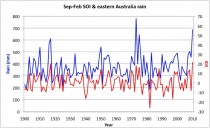
He begins his answer by pointing to the strength of the current record La Nina event and the relationship of the SOI (Southern Oscillation Index, a measure of the strength of La Nina and El Nino events) and Australian rainfall (see his figure above). He concludes:
Given the well-known relationship between the SOI and heavy rains in eastern Australia (eg., McBride and Nicholls, 1983) we can conclude that the fundamental cause of the heavy rains this past six months was indeed this record La Nina event. Other heavy rain years (1917/18, 1950/51, 1973/74, 1975/76) were also the result of strong La Nina events. The relationship between rainfall and the SOI is very strong, with a correlation coefficient of 0.66. So, the heavy rains were not caused by global warming, but by a record La Nina event - a natural fluctuation of the climate system.
But he doesn’t stop there. He next asks: “But perhaps 2010/11 was a record La Nina because of global warming?” His answer:
There has not been any trend in the SOI over the past 111 years, despite the warming of global mean temperature of about 0.75C over that period. Nor do climate models consistently predict increased strength of La Nina events from enhanced atmospheric content of greenhouse gases (eg., Vecchi and Wittenberg, 2010). So there is no reason, at this moment, for us to suspect that global warming is increasing the frequency or intensity of La Nina events.
He doesn’t stop their either, and next asks, “But was the impact of the 2010/11 La Niña on Australian rainfall stronger because of the record warm sea surface temperatures around northern Australia in 2010?” His answer:
These waters have increased substantially over the last century and are now about a degree warmer than early in the 20th century. If these warmer waters were enhancing the impact of La Nina on Australian rainfall we might expect to be seeing heavier rains in recent decades, relative to the rains that accompanied earlier strong La Nina events. There is some evidence of this (eg., Nicholls et al 1996), and there has been a weak tendency towards increased rainfall since 1900, independent of the influence from the El Nino - Southern Oscillation. Perhaps this trend towards increased rainfall might be related to the warmer sea surface temperatures - but much more work is needed to test this. The effect, if there is one, does not look very strong.
He concludes:
The record La Nina event was the fundamental cause of the heavy rains and floods, ie it was a natural fluctuation of the climate system. There may be a global warming signal enhancing this natural variability, but if so then this effect has been quite subtle, at least thus far.
Post. See also Stewart Franks’ story on Jennifer Marohasy’s blog about Better planning for floods in Australia - using ther combination of PDO and La Nina.
By Willis Eschenbach, Watts Up With That
Well, I had hoped for the best from BEST, the new Berkeley Earth Surface Temperature project looking at the global temperature record. I was disheartened, however, by the Congressional testimony of Dr. Richard Muller of BEST.
He said (emphasis mine):
Global Warming
Prior groups at NOAA, NASA, and in the UK (HadCRU) estimate about a 1.2 degree C land temperature rise from the early 1900s to the present. This 1.2 degree rise is what we call global warming. Their work is excellent, and the Berkeley Earth project strives to build on it.
Human caused global warming is somewhat smaller. According to the most recent IPCC report (2007), the human component became apparent only after 1957, and it amounts to “most” of the 0.7 degree rise since then. Let’s assume the human-caused warming is 0.6 degrees.
The magnitude of this temperature rise is a key scientific and public policy concern. A 0.2 degree uncertainty puts the human component between 0.4 and 0.8 degrees - a factor of two uncertainty. Policy depends on this number. It needs to be improved.
The preliminary comparison - the 2% data is from Japan. H/T Steve Goddard
Why do I think his testimony doesn’t help in the slightest? Well, to start with, I’ve never heard anyone make the claim that the land surface air temperature (excluding oceans) of the earth has warmed 1.2C since 1900.
He cites three land temperature datasets, NOAA , NASA (GISTEMP), and HadCRU (he presumably means CRUTEM, not HadCRU).
Here’s the problem. The actual land surface air temperature warming since 1900 according to the existing datasets is:
NASA GISTEMP: 0.72C
NOAA NCDC: 0.86C
CRUTEM: 0.92C
So Dr. Muller, in his first and most public appearance on the subject, has made some of the more unusual claims about the existing temperature datasets I’ve heard to date.
1. Since the largest temperature rise in the three datasets is 30% greater than the smallest rise, their work is not “excellent” in any sense of the word. Nor should the BEST team “strive to build on it.” Instead, they should strive to understand why the three vary so widely. What decisions make the difference? Which decisions make little difference?
2. Not one of the three datasets shows a temperature rise anywhere near the 1.2C rise Muller is claiming since 1900. The largest one shows only about 3/4 of his claimed rise.
3. He claims a “0.2 degree uncertainty”. But the difference between the largest and smallest calculated warming from the three datasets is 0.2C, so the uncertainty has to be a lot more than that
4. He says that the land warming since 1957 is 0.7C. The records beg to differ. Heres the land warming since 1957:
NASA GISTEMP: 0.83C
NOAA NCDC: 1.10C
CRUTEM: 0.93C
Note that none of them are anywhere near 0.7C. Note also the huge difference in the trends in these “excellent” datasets, a difference of half a degree per century.
5. He fails to distinguish CRUTEM (the land-only temperature record produced by the Climategate folks) from HadCRU (a land-ocean record produced jointly by the Hadley folks and the Climategate folks). A minor point to be sure, but one indicating his unfamiliarity with the underlying datasets he is discussing.
It can’t be a Celsius versus Fahrenheit error, because it goes both ways. He claims a larger rise 1900-present than the datasets show, and a smaller rise 1958-present than the datasets.
I must confess, I’m mystified by all of this. With his testimony, Dr. Muller has totally destroyed any credibility he might have had with me. He might be able to rebuild it by explaining his strange numbers. But to give that kind of erroneous testimony, not in a random paper he might written quickly, but to Congress itself, marks him to me as a man driven by a very serious agenda, a man who doesnt check his work and who pays insufficient attention to facts in testimony. I had hoped we wouldn’t have another temperature record hag-ridden by people with an axe to grind....foolish me.
Perhaps someone who knows Dr. Muller could ask him to explain his cheerleading before Congress. I call it cheerleading because it certainly wasn’t scientific testimony of any kind I’m familiar with. I hear Dr. Muller is a good guy, and very popular with the students, but still… color me very disappointed.
PS - Muller also said:
Let me now address the problem of Poor Temperature Station Quality
Many temperature stations in the U.S. are located near buildings, in parking lots, or close to heat sources. Anthony Watts and his team has shown that most of the current stations in the US Historical Climatology Network would be ranked “poor” by NOAA’s own standards, with error uncertainties up to 5 degrees C.
Did such poor station quality exaggerate the estimates of global warming? We’ve studied this issue, and our preliminary answer is no.
The Berkeley Earth analysis shows that over the past 50 years the poor stations in the U.S. network do not show greater warming than do the good stations.
Thus, although poor station quality might affect absolute temperature, it does not appear to affect trends, and for global warming estimates, the trend is what is important.
Dr. Muller, I’m going to call foul on this one. For you to announce your pre-publication results on this issue is way, way out of line. You get to have your claim entered into the Congressional Record and you don’t even have to produce a single citation or publish a paper or show a scrap of data or code? That is scientific back-stabbing via Congressional testimony, and on my planet it is absolutely unacceptable.
That is taking unfair advantage of your fifteen minutes of fame. Show your work and numbers like anyone else and we’ll evaluate them. Then you may be able to crow, or not, before Congress.
But to stand up before Congress as an expert witness and refer solely to your own unpublished, uncited, and un-verifiable claims? Sorry, but if you want to make that most public scientific claim, that bad siting doesn’t affect temperature trends, you have to show your work just like anyone else. If you want to make that claim before Congress, then PUBLISH YOUR DATA AND CODE like the rest of us mortals. Put your results where your mouth is, or if not, leave it out of your Congressional testimony. Why is that not obvious?
Anthony’s unpublished and unverifiable claims are as strong as your similar claims. That is to say, neither have any strength or validity at all at this point ....so how would you feel if Anthony trotted out his unverifiable claims before Congress to show that Dr. Richard Muller was wrong, and didn’t show his work?
Like I said ...color me very disappointed, both scientifically and personally. Dr. Muller, I invite you to explain your Congressional testimony, because I certainly don’t understand it. I am totally confident that Anthony will be happy to publish your reply.
I also urge you to either a) publish the data and code that you think shows no difference in trends between good and poor stations, or b) publicly retract your premature and unverifiable claims. You don’t get to do one without the other, that’s not scientific in any sense of the word.
PPS - Does any of this mean that the BEST analysis is wrong or their numbers or data are wrong or that the BEST folks are fudging the results? ABSOLUTELY NOT. I am disappointed in Dr. Muller’s claims and his actions. The math and the data analysis is an entirely different question. Theirs may be flawless, we simply don’t know yet (nor would I expect to, it’s early days). I look forward to their results and their data and code, this kind of initiative is long overdue.
I want to be very clear than the validity of their actual methods depends only on the validity of their actual methods. The problem is, we don’t even know exactly what those methods are yet. We have rough descriptions, but not even any pseudocode, much less code. Which in part is why I find Dr. Muller’s testimony unsettling…
By Joseph D’Aleo, CCM
In the LA Times, there was a story on Richard Muller’s invitation to DC to testify to congress about the Berkeley Project, which attempts to reconstruct global data
The Berkeley Earth Surface Temperature study is led by physicist Richard Muller, a longtime critic of the scientific consensus on climate change, who plans to testify on the effort Thursday before the House Science Committee in the latest of several congressional inquiries on climate science since the GOP majority was seated. Temperature data from tens of thousands of weather stations across the globe, many of which have incomplete records, are “very contentious,” Muller said in an interview. “The skeptics are raising legitimate concerns.”
Muller and many of those who question the temperature data are drawn to the “urban heat island” phenomenon, maintaining that gauges may be registering latent heat from asphalt, concrete and other urban features. Over time, some weather stations that once recorded temperatures in rural areas have been surrounded by cities and suburbs. The Berkeley project is analyzing information from 39,000 stations -five times as many as the other groups, Muller said - and will address the fact that temperature data have been recorded at varying times of day.
The project also will put its calculations on the Internet in a “transparent” way, Muller said. Other scientists, he said, “put homogenized data online. They don’t put up the [software] tools that get you from the raw data to the homogenized data. How do they pick the [weather station] sites? That involves human judgment.”
Peter Thorne, a leading expert on temperature data at the National Oceanic and Atmospheric Administration’s National Climatic Data Center in Asheville, N.C., said the three main data sets by the NOAA, NASA and Britain’s Hadley Centre adjust for the heat island effect, as well as for measurements at different times of day. Muller’s use of 39,000 weather stations, he said, “will make next to no difference” in the final result.
First of all the Berkeley Project’s approach to the data when stations move or siting changes - treating them like separate stations makes sense. Almost invariably the change in siting leads to a warm bias in trends.
Second and most importantly, Thorne must know that NOAA and Hadley don’t adjust for urbanization. In fact their homogenization approach urbanizes good rural station data sets. NOAA removed a UHI adjustment based on Karl (1988) in 2007 for the US 1221 station network (USHCN v2). NASA attempts an urban adjustment using night lights but McIntyre and others have shown the poor metadata (precise GIS locations) make matching satellite brightness and stations difficult.
In a story last year on Climate Science “Erroneous Statement By Peter A. Stott And Peter W. Thorne In Nature”, Roger Pielke Sr. wrote:
This is deliberately erroneous as one of the authors of this article (Peter Thorne) is an author of a CCSP report with a different conclusion. With just limited exceptions, the surface temperature data sets do not use different sources of data and are, therefore, not independent. As I have written, “The raw surface temperature data from which all of the different global surface temperature trend analyses are derived are essentially the same. The best estimate that has been reported is that 9095% of the raw data in each of the analyses is the same (P. Jones, personal communication, 2003).”
Peter Stott and Peter Thorne have deliberately misled the readership of Nature in order to give the impression that three data analyses collaborate their analyzed trends, while in reality the three surface temperature data sets are closely related.
Muller meanwhile remains an enigma, like his partner in the project Judith Curry. He is an apparent semi-skeptic who believes AGW exists but is is greatly exaggerated .He and Judith and not thoroughly trusted by either side of the issue. This may mean they are getting it right. We can hope the project continues to be as promised independent and open source. NOAA, NASA, CRU are definitely not open source despite Thorne’s claims to the contrary. Their results are not currently replicable.
By Joseph D’Aleo, CCM
Snow was in the news a lot this winter in Europe, Asia and the United States. Numerous big cities had a season in their top ten. The storms this week may move some up. We will summarize in April. Even the Sierra has had mammoth snows. See the amazing pictures here.
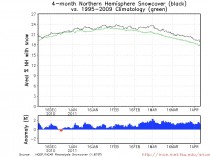
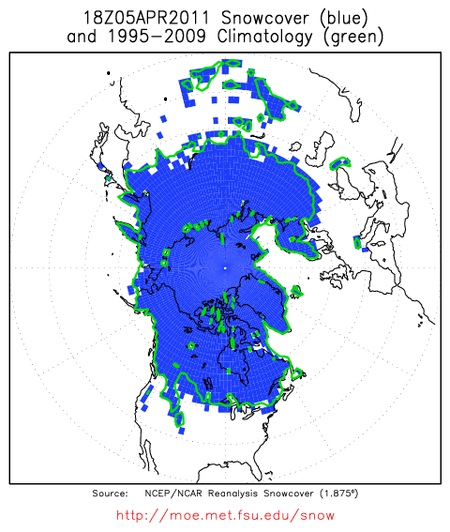
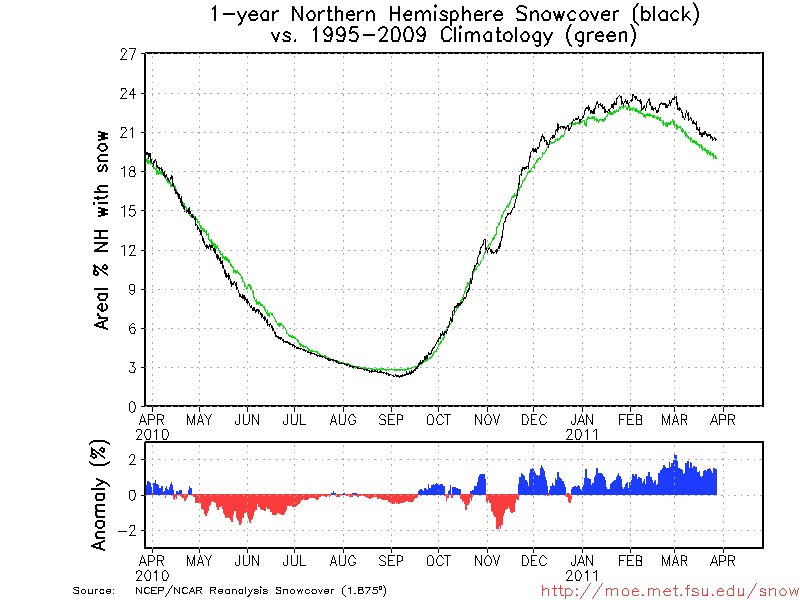
Dr. Bob Hart at FSU maintains en excellent snow lab where he tracks hemispheric snowcover (with just a few day time delay) link.
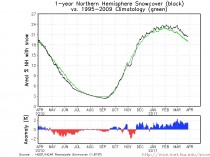
Here is his plot of the Northern Hemispheric snowcover and anomaly as of March 27, 2011.
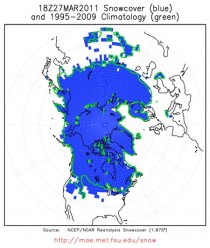
Notice how Asia and Canada are still covered and reflecting increasing insolation and thus still are in the production mode for cold air masses. Here you can see that it remains well above the climatology (1995-2009) as it has virtually continuously since late November.
Rutger’s snow lab shows in their seasonal analysis how the snow pack this past winter (2010/11) ranked #3 since records began in 1967 behind 2009/10 and 1977/78. Notice the trend is up for the winter.
The early and persistent snow helped keep the winter in Eurasia and the United States colder than normal.
Note last year the snow disappeared from much of the northeast and eastern Canada as persistent maritime flow around record blocking moderated the air enough to remove the snow early. See how last year was anomalously low in snowcover in the spring helping to exaggerate the downtrend.
That disappearing act for snow is what started us on a warm spring/hot summer path typical of La Nina summers after an El Nino winter (1999, 1995, 1988, 1966, etc).
With the spring starting out way ahead of last year, we get support for late cold and snow. We are seeing it in the models. JB and I have discussed the ideas of the cold and snow in late March for weeks and JB has blogged about more for April.
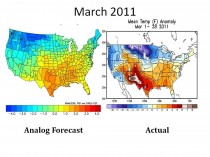
Here is what the analogs had suggested for March and what has happened through the 28th.
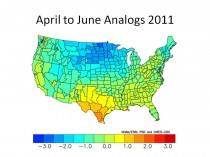
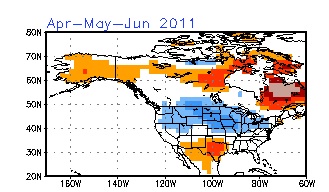
Here is what they suggest for April through June.
See how the CFS model views April, May June for temperatures

And the Soil Moisture model for April, May and June.
Obviously soil moisture and snowcover are in tune with the global teleconnections and suggest a very different summer than last year. We will fine tune as the indices are updated. It also implies an active tornado season. The cold PDO, La Nina and still warm AMO also point towards more problems from the Atlantic than we experienced last year as JB has posted.
See WeatherBell post here. See earlier post on why increasing snowcover is not consistent with global climate change models here. Also see 30 exqamples of AGW scientists covering both sides of the fence.
TUCSON, Ariz., March 28, 2011 /PRNewswire-USNewswire/
U.S. and European policy to increase production of ethanol and other biofuels to displace fossil fuels is supposed to help human health by reducing “global warming.” Instead it has added to the global burden of death and disease.
Increased production of biofuels increases the price of food worldwide by diverting crops and cropland from feeding people to feeding motor vehicles. Higher food prices, in turn, condemn more people to chronic hunger and “absolute poverty” (defined as income less than $1.25 per day). But hunger and poverty are leading causes of premature death and excess disease worldwide. Therefore, higher biofuel production would increase death and disease.
Research by the World Bank indicates that the increase in biofuels production over 2004 levels would push more than 35 million additional people into absolute poverty in 2010 in developing countries. Using statistics from the World Health Organization (WHO), Dr. Indur Goklany estimates that this would lead to at least 192,000 excess deaths per year, plus disease resulting in the loss of 6.7 million disability-adjusted life-years (DALYs) per year. These exceed the estimated annual toll of 141,000 deaths and 5.4 million lost DALYs that the World Health Organization attributes to global warming. Thus, developed world policies intended to mitigate global warming probably have increased death and disease in developing countries rather than reducing them. Goklany also notes that death and disease from poverty are a fact, whereas death and disease from global warming are hypothetical.
Thus, the biofuel remedy for global warming may be worse than the disease it purports to alleviate.
Goklany was associated with the UN Intergovernmental Panel on Climate Change (IPCC) off and on over a 20-year period as an author, expert reviewer, and U.S. delegate. His analysis is published in the spring 2011 issue of the Journal of American Physicians and Surgeons , the official journal of the Association of American Physicians and Surgeons (AAPS).
AAPS is a national organization of physicians in all specialties, founded in 1943 to protect the practice of private medicine and the sanctity of the patient-physician relationship (http://www.aapsonline.org).
SOURCE Association of American Physicians and Surgeons (AAPS)
See release.
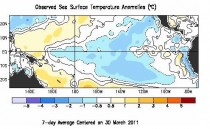
By Dr. Roy Spencer
It has been awhile since I provided an update to the global average sea surface temperature plot, shown below through yesterday (March 17, 2011).
As can be seen, SSTs remain below normal. The trend line is close to zero, so still no sign of “global warming” having resumed.
The corresponding water vapor plot (vertically integrated) shows a rather spectacular plunge in recent weeks:
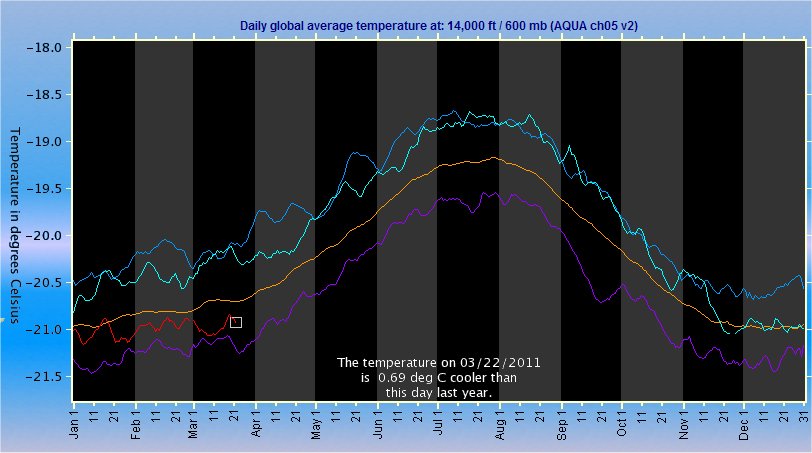
ICECAP NOTE: The UAH Discover temperature tracking tool for the lower troposphere (600mb - above the mixing layer) shows that March 2011 temperatures (red) continues well below normal (yellow) and 0.69C below last year (aqua blue) on March 22. We are flirting with the record low (purple) while last year tangled with the record high (blue) in March. You can track it here. La Ninas tend to be cold and El Ninos warm with a lag of about 7 months. The El Nino of 2009/10 faded in May to La Nina by June/July 2010.
See my post ”Weakening La Nina, Where to from Here” on WeatherBell Analytics.
Editor’s note: This article was co-authored by Willie Soon and Barun Mitra.
Japan is grappling with a triple tragedy: earthquake, tsunami and possible nuclear radiation. This has brought rolling blackouts, as authorities strive to meet electricity demands with reduced supplies and crippled transmission lines.
However, power cuts and inadequate power are routine in developing countries like India. For them, going without electricity for hours or even days is the norm, not the exception.
But now, the UK’s power grid CEO is warning Brits that their days of reliable electricity are numbered. Because of climate change and renewable energy policies, families, schools, offices, shops, hospitals and factories will just have to “get used to” consuming electricity “when it’s available,” not necessarily when they want it or need it.
UN IPCC chairman Rajendra Pachauri justifies this absurd situation by sermonizing, “Unless we live in harmony with nature, unless we are able to reduce our dependency on fossil fuels and adopt renewable energy sources, and until we change our lifestyles, the world will increasingly become unfit for human habitation.”
Thus, people in poor countries who never had access to reliable electricity may be denied it even longer, while people in rich countries could soon face new electricity shortages.
Citizens of the world’s poor and emerging economies: Beware of claims that the greatest threat we face is from manmade climate change. They are wrong. The real threat is from energy starvation policies implemented in the name of preventing climate change.
Everywhere one looks, people are enjoying modern technologies, improving their lives, realizing their dreams. Other people want the same opportunities for themselves and their children - and they should have them. Every citizen of the world should someday enjoy access to similar levels of energy that people in developed countries enjoy today.
The technologies, trade and transportation networks, the legal, property rights, economic and banking systems have all been developed. If countries and communities take advantage of them, a better future will require only one more thing: energy.
Energy is the Master Resource, the key to everything else. Only our Ultimate Resource - our creative intellect - is more important. People who have abundant, reliable, affordable energy - and the freedom to use it - can turn dreams and ideas into reality.
Those who must rely on human and animal muscle, or open fires, remain poor. Certainly, wind turbines and solar panels are far better than primitive energy. They can bless remote villages with electricity. But they are nothing compared to reliable electricity from hydrocarbon, hydroelectric and nuclear power.
However, policies based on false claims that we can control Earth’s climate restrict access to energy and increase its cost. They perpetuate poverty, and prevent people from building better homes, having comfortable lighting and heating, using computers and modern conveniences, preserving food and medicines, and even surviving natural disasters and adapting to climate change.
Using computer models, thousands of scientists say human carbon dioxide emissions are responsible for recent warming. But thousands of other scientists say the sun and other natural forces still control our complex, unpredictable climate.
Earth’s climate has changed repeatedly throughout history. Its temperature rose slightly during the last century, as our planet recovered from the Little Ice Age, but not in a straight line. It went up 1900-1940, then cooled until 1975, warmed again until 1995, and has been steady since then - all while global CO2 levels were rising. Flood, drought, hurricane and other weather patterns also change periodically.
Earth’s climate is influenced by far more factors: solar, planetary, atmospheric, oceanic and terrestrial. Climate models are useless, even harmful, for setting energy policy.
But even if carbon dioxide does affect climate, China, India and Brazil are building power plants and automobiles at a record pace. Their people are rapidly climbing out of poverty, using coal, oil, natural gas and hydroelectric power to achieve their dreams.
Leaders of these countries are not going to tell their still-poor people that they cannot enjoy the benefits that plentiful, affordable, dependable energy can provide.
Europe, Canada, Australia and the United States became modern economic powerhouses by using fossil fuels. They gave people wondrous technologies, improved their health and living standards, and doubled their life expectancies - using hydroelectric and hydrocarbon power.
Some people in rich countries talk about ending their fossil fuel use. But they have not done so - and cannot afford to. They talk about switching to wind and solar power. But they can no longer afford massive renewable energy subsidies that destroy two jobs in other sectors of their economy for every “green” job they create.
People in rich countries will not give up their modern living standards, electricity, automobiles, airplanes, hospitals, factories and food. Mr. Pachauri certainly will not. Why, should people in poor countries give up their dreams?
During the Cancun climate summit, rich nations said they would give poor countries $100-billion annually in “climate change reparation and adaptation” money. But these are empty promises, made by nations that can no longer afford such unsustainable spending.
Poor countries that expect this money will end up fighting over table scraps - and whatever funds do flow will end up in the overseas bank accounts of ruling elites. The poor will see little or none of it.
For awhile longer, rich countries will continue supporting global warming research and conferences. Researchers, bureaucrats and politicians will continue issuing dire warnings of imminent catastrophes, while they enjoy the benefits of modern energy, traveling on airplanes, attending talk fests at fancy hotels in exotic locations - all powered by coal and petroleum.
They may continue telling the world’s poor how important and admirable it is that we keep living traditional, sustainable, environment-friendly lifestyles; getting by on small amounts of intermittent, unreliable, expensive electricity from wind turbines and solar panels; and giving up our dreams of a better, healthier, more prosperous life.
Ultimately, the climate change debate is really over just two things.
Whether we, the world’s poor, must give up our hopes and dreams. And whether we will determine our own futures - or the decisions will be made for us, by politicians who use climate change to justify restricting our access to reliable, affordable energy.
Which should we fear most? Climate change that some say might happen 50 or 100 years from now? Or an energy-deprived life of continued poverty, misery, disease, and forgotten hopes and dreams?
Our future is in our hands.
See also ”My dream: A prosperous Uganda”, Developing Uganda’s oil and gas resources will create opportunity and prosperity by Cyril Boynes, Jr..
By Joseph D’Aleo, CCM, AMS Fellow
INTRODUCTION
The US congress sub-committee on Energy and Commerce Committee held hearings on whether to restrict in some way the EPA’s regulatory authority relative to greenhouse gas emissions.
There were 7 scientists invited to testify. Three of the four who argued not to restrict the EPA played a key role in the last IPCC report (and will also in the next one) and generally started with the position that IPCC science was sound and there was a consensus of all real scientists.
In the attached analysis we take a look at the IPCC based science. We are going to ignore all the many ‘gates’ that were uncovered like the Himalayan glaciers, Amazon rain forests, how many real scientists there were who authored the key summaries and all the issues as to whether the summaries truly reflected the scientific information in the chapters and despite claims to the contrary, how a significant percentage of citations were not peer reviewed.
We will not attempt to address the issues of sensitivity for CO2 or solar and cloud and water vapor feedbacks relative to the models. We will also ignore the many model shortcomings - like inability to forecast regional patterns, ocean oscillations, etc. Each of these alone discredit the consensus ‘settled science claim.
We will focus on how actual data compares to the consensus science, model based virtual world view of climate.
We will look at some of the major findings, assessments or model predictions from the IPCC and other national climate centers and NGOs, that we believe have failed and let you decide then whether or not the their science and model projections should be the bedrock onto which we build public policy.
The ten issues:
1. Warming is said to be unprecedented and accelerating. It is neither.
2. Global warming is not GLOBAL
3. Winters would grow increasingly warm
4. The entire Northern Hemisphere would experience less snow and snowcover
5. The arctic oscillation (AO) would become increasingly positive, aiding in the warming
6. Global warming would lead to a permanent or semi-permanent El Nino
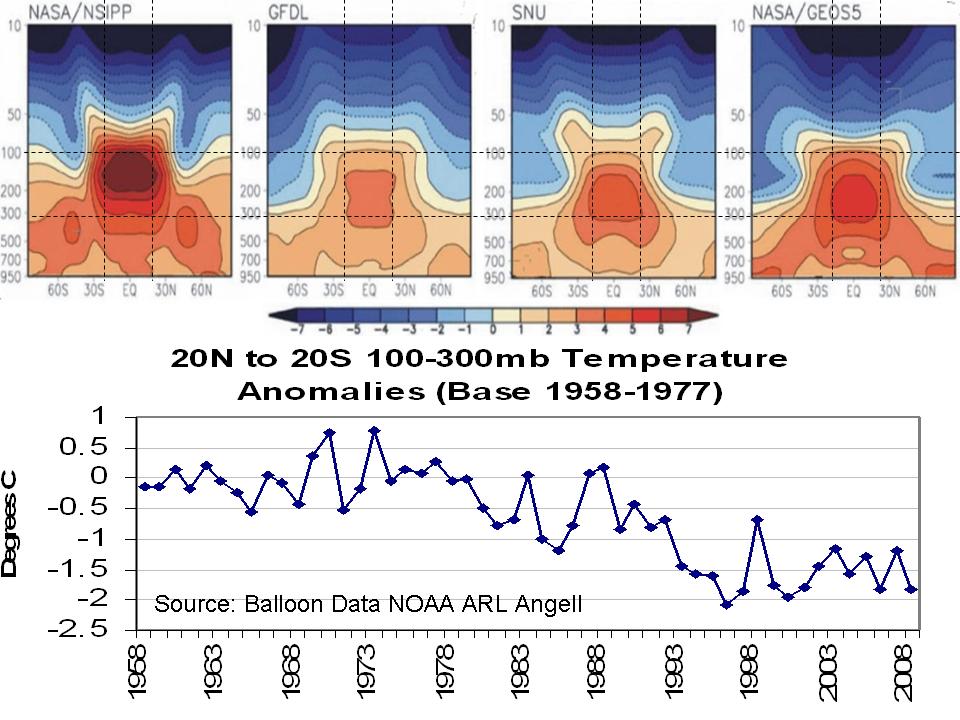
7. Atmosphere will warm faster than surface (because that is where the heat trapping gases are).

Enlarged. Balloon data for actual 100-300 mb from 20S-20N from NOAA ARL Angell (anomalies relative to base period 1968-1977) compared to models forecasts of warming 20S-20N 100-300mb. Note the cooling observed where models suggest most GHG warming. This is similar to depictions from Singer etal NIPCC 2007 and others.
8. Record highs and heat waves are increasing
9. Sea levels are rising at an increasing, alarming rate
10. Droughts and floods will worsen
We have actually made a list of 30 such ‘failures’ or ‘shortcomings’, but decided to focus on the first ten.