


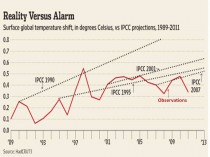
By Chris Horner, The Daily Caller
We’ve got a new entrant in the push to tie down the U.S. economy once and for all in the name of saving the environment, and skeptics of the green boondoggle could not have chosen a better advocate to make their case, however inadvertently. More on this new entrant in a moment. First, a refresher of what it is they’re pushing. With the legislative death of cap-and-trade energy rationing, President Obama telegraphed his re-branding effort in that delightful “shellacking” press conference last November by saying “there are other ways to skin that cat.”
That cat is the long-held left-liberal goal of riding the global warming issue to a place that free people will never go if given an honest sales pitch. It is now to be skinned by something that also has a few names, just in case one becomes the punch-line that “global warming” has become.
As per a poll taken by Democrat pollster Stanley Greenberg, these labels are a “clean energy economy” and, with economic times being what they are, “green jobs.”
The latest proponent of this Plan B is our old friend, the United Nations Intergovernmental Panel on Climate Change (IPCC). And, with the Senate actually pondering a CES push before summer, this comes just in time. That is, it comes just in time for those of us arguing for more individual liberty, less state control over our lives and the economy. Short of Al Gore making a movie about green jobs that, too, got all of its money claims tossed by the UK’s high court as unsupportable, a helpful assist from the IPCC is all a skeptic could hope for.
The IPCC is often touted as 2,500 of the world’s leading climate scientists (whose “chief scientist” is in fact a railway engineer, and whose ranks include anthropology T/As, transport policy teachers and instructors in group-huggy things like “the human dimension of climate change"). It was in defense of the IPCC’s “smoking gun” from its 2001 Third Assessment Report, the thoroughly debunked “Hockey Stick,” that scientists affiliated with the IPCC enterprise engaged in all of their perversion of science and transparency laws later exposed by an apparent whistleblower in ClimateGate.
In short, theyre the best friend anyone opposing this cat-skinning ruse could ask for. But it gets better.
Today the IPCC released a “Special Report on Renewable Energy Sources and Climate Change Mitigation.” Actually, it only released its summary because, as is always the case with these IPCC products, the “Summary for Policymakers” is produced before the actual work it purportedly summarizes. Here’s our answer, now let’s set about propping it up!
Right up front are the paper’s four “coordinating lead authors.” Representative of the world of global warming schemes, these include two Germans, an African, and a Cuban, as no economic plan is complete without an expert from Cuba.
First among them, however, just happens to be IPCC official Ottmar Edenhofer. You may remember him for his recent gem - also from last November, come to think of it - of admitting that “one has to free oneself from the illusion that international climate policy is environmental policy.” Instead, climate change policy is about how “we redistribute de facto the world’s wealth...” I couldn’t have said it better myself (though I have tried).
As Daily Caller readers already know, these efforts are to culminate with a “green jobs” treaty that the U.S. will have sprung on it next spring, three weeks before the confab of global leaders, the UN Conference on Sustainable Development, takes place in Rio de Janeiro. There will be a great flood of media puffery about the supposed wonders of the state “creating jobs” (particularly with the encouragement of supranational entities, no doubt) by mandating economic inefficiencies.
Read more.
By Joseph D’Aleo, CCM, WeatherBell Analytics
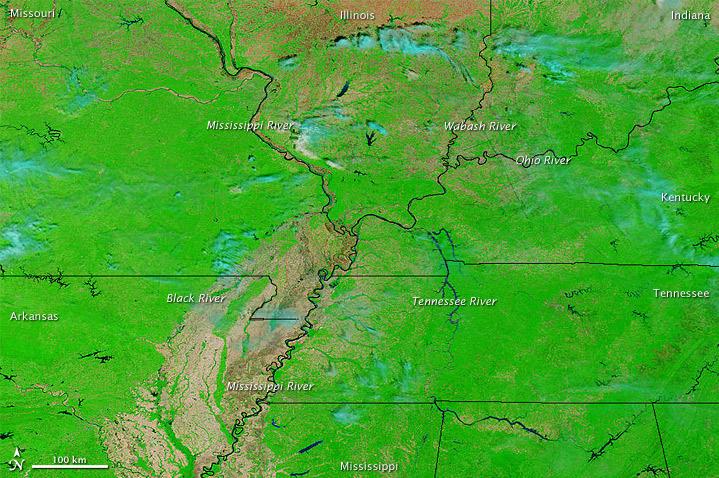
The Mississippi River Basin is the third largest drainage basin in the world. It drains an area of 1,245,000 square miles, including all or part of 31 states and two Canadian provinces. The Mississippi River is vital to mid-continent transportation and supplies water for drinking, irrigation, and industries. Major floods on the Mississippi River have caused billions of dollars in property damage.
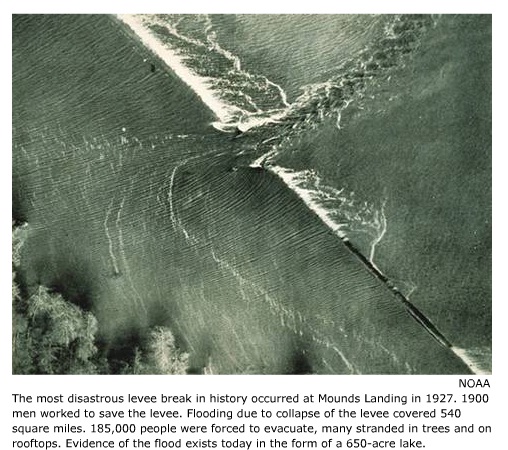
The Great Flood of 1927 did the equivalent of over 5 billion dollars (at current value). It was one of the most powerful natural disasters of the 1900s. Following several months of unusually heavy rain during late 1926 and early 1927, the Mississippi River flooded. During the height of the flood, the river was over 80 miles wide at some locations.
After the failure of a levee at Mounds Landing, Mississippi, the flooding river flowed with the force of Niagara Falls.

The levee failure eventually resulted in the flooding of an area the size of Connecticut. Ten feet of water covered towns up to 60 miles away from the river. Even after 5 weeks, the area around Mounds Landing was covered with 100 feet of water.
In the end, the Flood of 1927 affected an area of 27,000 square miles, about the size of all the New England states combined. Over 130,000 homes were lost and 700,000 people were displaced. 246 flood-related deaths were reported.
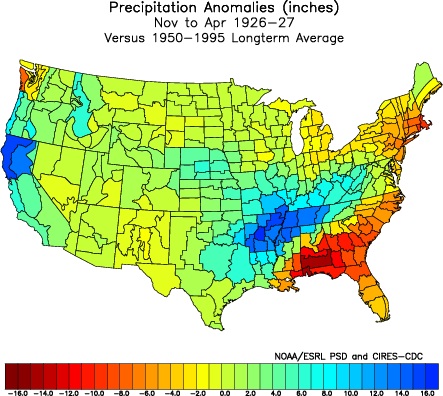
The rains that year actually began falling in late 1926 and continued into the spring. The November to April anomaly map looked like this.
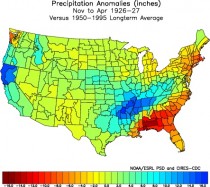
Note the greatest anomalies (up to 16 inches) were right over the northern Delta region - the mid Mississippi and Tennessee Valleys.
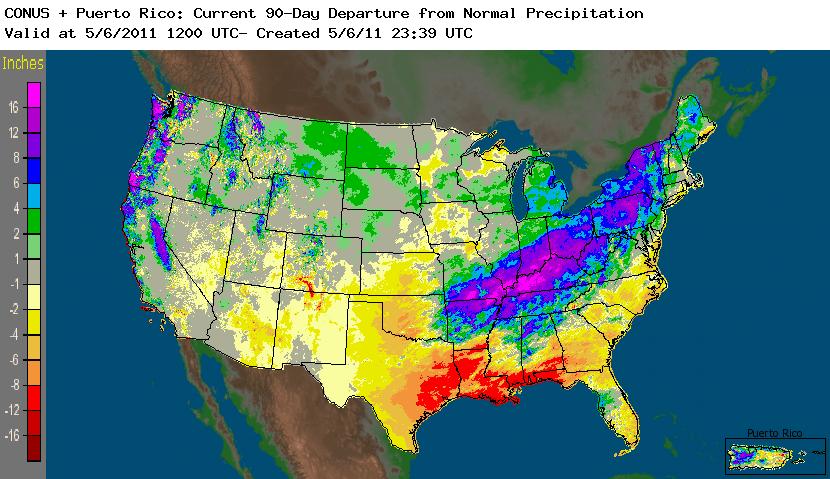
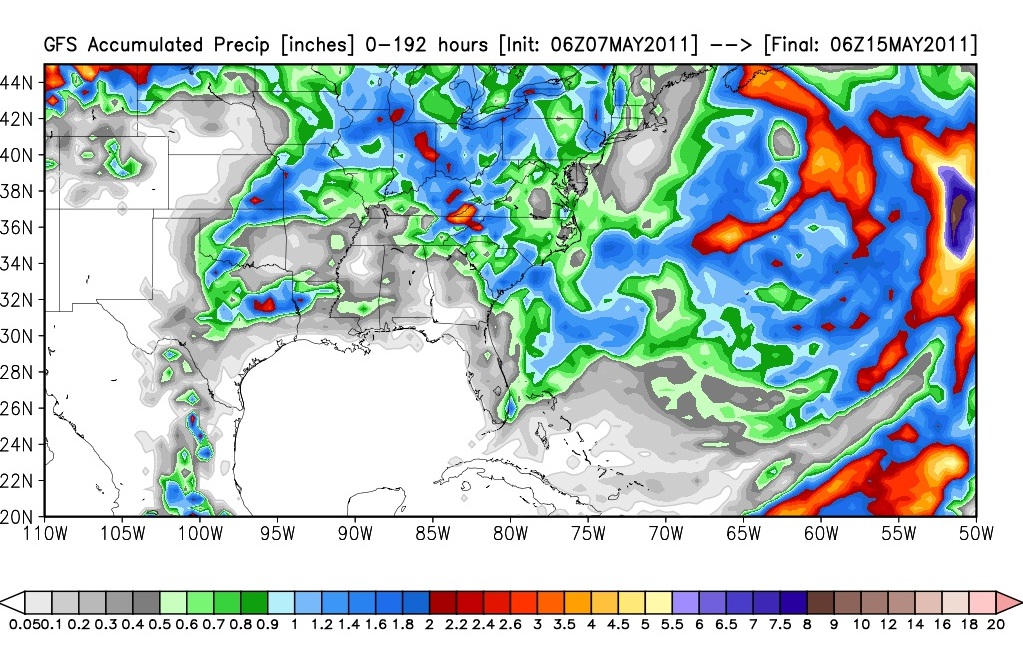
This years the rains really picked up in the spring. The last 90 days is when the bulk of the heavy rains fell. Ironically some of the area most affected by flooding along the southern Mississippi Valley has large (over 8 inch) negative rainfall anomalies.

The heaviest rains this year occurred from the Mid Mississippi Valley northeast right along the Ohio River which feeds the Mississippi.
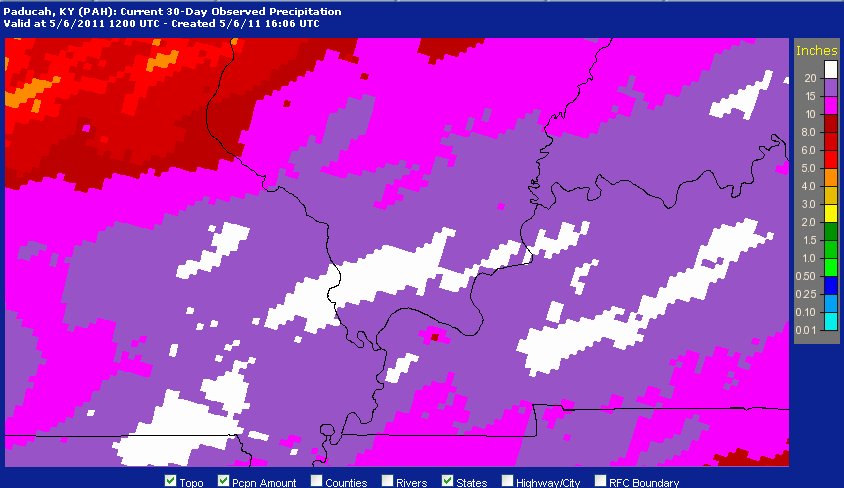
The National Weather Service in Paducah, Kentucky showed this map of rainfall from April 6 to May 6, 2011:

Most areas got 400 to 500% of normal. See a report on the rainfall and severe weather in that region here.
That is what is making 2011’s flood potentially the worst on record in terms of total area affected and impact. See some amazing photographs of the flood from the ground and aerial including the intentional break of the Birds Point levee and the 130,000 acres of flooded farmland here.
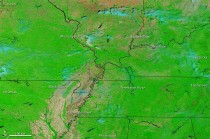
Here is a picture from space by NASA of the swollen rivers.
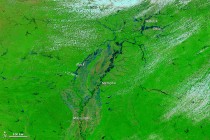
Compared to 2010 on the same date.
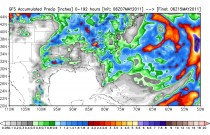
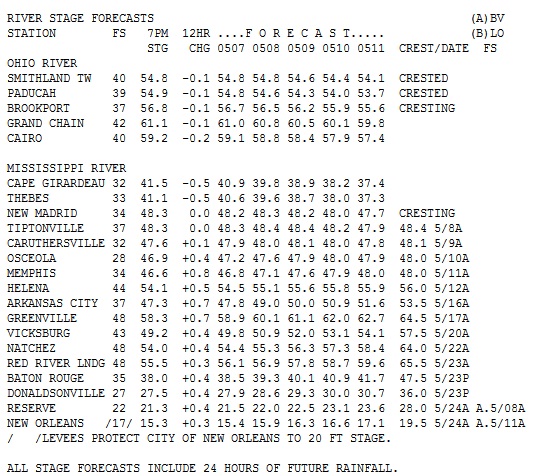
The River Forecast Center in Slidell, LA has this outlook for the gauge locations along the Ohio and Mississippi River. Some locations have crested. Others downstream will see crests as late as May 24th. Notice has much above flood stage (first column) the river gauge locations are forecast to be. Osceola is expected a crest 20 feet above flood stage (currently they are 18.9 feet above).

Fortunately the pattern has changed with the action shifting further north. The flooded region will not get excessive rainfall and runoff to further enhance this flood crest the next 8 days.
Indications are the action stays there week 2. Flooding more localized is likely to increase in the eastern Ohio Valley and the northern Appalachians in NY and PA, where they have been very wet this spring. (Ironically in October and early November in 1927, extreme flooding followed the Mississippi flooding in New England focused on Vermont.)
The rains are increasing north and east of the flood area as we have noted together with snowmelt is already causing significant flooding. See Meteorologist Bill Steffen’s WOOD-TV post here on the lake level rises in the Great Lakes and Champlain Valley.
Of course the Ohio River and its tributaries feed the Mississippi and runoff into the Ohio River will slow the decline of river levels and produce a much smaller, secondary crest that runs down the river system at some point as the rains continue.
A large section of Mississippi River is closed for barge traffic. The latest river forecast would keep the river closed for 8 days at Caruthersville, Missouri, with other closures possible as the water flows south to the Gulf. The Mississippi is a key transportation route for 500 million tons of cargo each year - including chemicals, coal, oil, timber, iron, steel and more than half of the nation’s grain exports.
The Port of New Orleans is America’s gateway to the global market. New Orleans has been a center for international trade since 1718 when it was founded by the French. Katrina disrupted transport for many weeks in 2005.
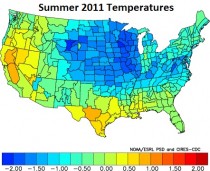
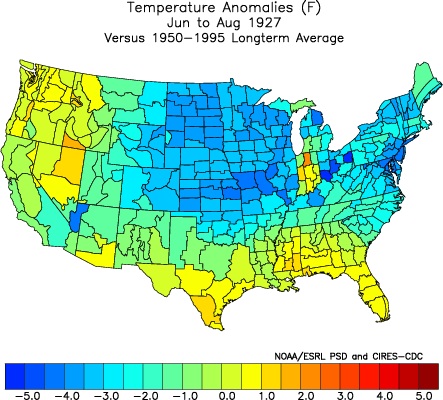
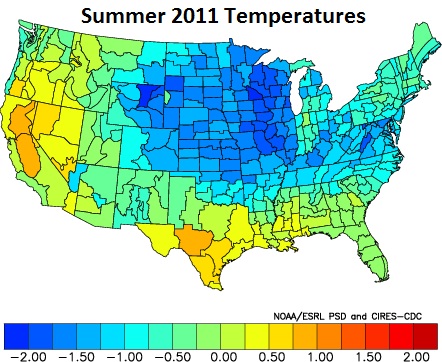
One final addendum. See the summer temperature pattern in 1927, not unlike our view of this summer. The anomaly in Indiana is likely a bad data point.
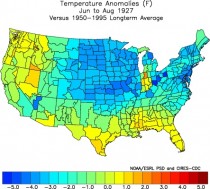
It also fits the soil moisture based model that uses current soil moisture and past weather that followed similar conditions. 1 STD in ORD would be -2.1F. It approaches 1.8 STD near St. Louis.
It fits our analog summers (June through August).
See this and much more on WeatherBell Analytics, still free blog here.
Dr. Tim Ball, A Different Perspective
Traditionally, the older scientists held to the prevailing wisdom and were challenged by the new, skeptical graduates looking for wider answers. In climatology, the opposite has happened. The so-called skeptics challenging the prevailing wisdom are the professors who have researched and taught the subject for 30 years or longer. Their knowledge is much wider than that of the new young scientists because climate science has stagnated for thirty years. All the funding was directed to only one side of climate science, and that was the side promoted by the Intergovernmental Panel on Climate Change (IPCC) and accepted as the ‘official science’ by governments.
It’s now frightening how little climate science is known by both sides of the debate on human causation of global warming. I wrote this sentence before I saw a paper from Michigan State University that found,
Most college students in the United States do not grasp the scientific basis of the carbon cycle - an essential skill in understanding the causes and consequences of climate change.
The professor says students need to know because they must deal with the buildup of CO2 causing climate change. This discloses his ignorance about the science of the carbon cycle and the role of CO2 in climate. It’s not surprising, and caused by three major factors:
(1) a function of the emotional, irrational, religious approach to environmentalism;
(2) the takeover of climate science for a political agenda; and funding directed to prove the political, rather than the scientific, agenda.
(3) The dogmatism of politics and religion combined to suppress openness of ideas and the advance of knowledge critical to science.
We now have a generation (30 years) of people teaching, researching, or running government that has little knowledge because of lack of fundamental education. Because of them, the public is ill-informed, doesn’t understand the problem, and doesn’t even know the questions to ask. Correcting the education process will take time, because there are insufficient people with the knowledge or expertise. Correcting and widening the research functions will take longer because of removing or re-educating current personnel and the lack of qualified replacements. Even if achieved, success is unlikely because there is the massive problem of inadequate data.
Reduction in the number of weather stations, elimination of raw data by national governments, unexplained manipulations of existing data, and deliberate loss of data were all done to predetermine and justify results. This couples with failure to fund research to recover and reconstruct historical data. In his autobiography, Hubert Lamb said he founded the Climatic Research Unit (CRU) in 1972 because
...it was clear that the first and greatest need was to establish the facts of the past record of the natural climate in times before any side effects of human activities could well be important.
The situation is worse now, sadly, due to the people at the CRU and government weather agencies.
The blame begins with the political manipulations of Maurice Strong, but he only succeeded because of the so-called climate scientists. Among them, computer modelers caused the biggest problem. They needed to know the most, but knew the least. If they knew anything, they would know there is inadequate data and understanding of the major components and mechanisms on which to build the models.
A former editor of an enlightened environmental journal said we need a committee of scientists from the many disciplines involved in climate science. Such a committee existed 25 years ago, and produced groundbreaking work. It was a joint project funded by The National Museum of Canada and Environment Canada under the title Climatic Change in Canada During the Past 20,000 Years. Each year a specific topic was considered, and scientists presented material that was published in Syllogeus. For example, Syllogeus 55 examined Critical Periods in the Quaternary of Climatic History of Northern North America. All the problems that plague climate science, such as tree rings, ice cores, circulation patterns, and proxy data, among many others, were identified and researched. In the last meeting, I was elected Chair, and in my acceptance speech I said we needed to consider, carefully and scientifically, the claims of global warming. Environment Canada cut the funding, apparently, because it challenged the political position the agency had already taken; the project died. Canada should reconstitute it, because it was producing useful and non-political science.
People who totally accepted the corrupted, limited and narrowly focused science of the IPCC have taught climate science for the last 30 years. They should all read H.H. Lamb’s monumental two-volume set Climate: Present, Past and Future. Vol. 1: Fundamentals and Climate Now (1972) and Climate: Present, Past and Future. Vol. 2: Climatic History and the Future (1977).
They’d learn that all issues now put forward as ‘new’ are not new at all. They only appear new because of the black hole that politicians, aided by a few climatically uneducated political scientists, have dragged climate science into over the last 30 years.
By Tom Jacobs, Miller McCune
Measuring a person’s ecological footprint or carbon footprint is a popular tool among environmentalists. Many see it as a way to educate people about the damage they inflict on the environment on an everyday basis - information that may prompt them to change their behavior.
But newly published research suggests that for many people - perhaps most - the receipt of such data may produce the opposite result.
In an experiment described in the journal Social Influence, “Only people who had invested their self-esteem in environmentalism - a strong form of commitment - reacted to negative environmental-footprint feedback by engaging in a pro-environment behavior,” writes Santa Clara University psychologist Amara Brook. “Others were less likely to engage in a pro-environmental behavior after negative feedback.”
Given that “for most people in developed countries, environmental-footprint feedback is very negative,” Brook’s study calls into question the wisdom of providing such information.
Two hundred and twelve students (median age 19) participated in the experiment, which was conducted over a two-week period. First, they answered a set of questions measuring their self-esteem level and the degree to which their self-worth was contingent upon a commitment to preserving the environment.
The following week, they completed a version of the standard environmental-footprint questionnaire, which was slightly adapted to apply to student life. (It covers such issues as the number of miles you drive per year and the amount of locally-grown food you consume.)
The students then received their “score.” In fact, they were randomly chosen to receive either a high number or a low one.
Those receiving negative feedback were informed that, “In comparison to previous studies we have done with University of Michigan students, your footprint measures 140.23 percent of the footprint of the average University of Michigan student.” Those receiving positive feedback were told their footprint was only 55 percent of the average Michigan undergrad.
Finally, after reading a newspaper article about the environmental impact of various behaviors, “participants were given the opportunity to write a letter to the state governor on any public policy issue of their choice.” Brook wanted to see how many of them would address that topic.
Just under 44 percent of them did so - not a surprising figure, given the fact the issue was on their minds. Those for whom environmentalism and self-esteem were closely linked were more likely to choose the topic - and if they received negative feedback on their environmental-footprint report, they were the most likely to do so.
But it was a different story for the others. Among the noncommitted, those told they had a heavy environmental footprint were less likely to write about that subject. Perhaps they were eager to shove uncomfortable feelings of guilt or complicity out of their minds by focusing on another issue.
“These results suggest that environmental-footprint feedback only promotes sustainable behavior for people who are already committed to environmentalism and may discourage sustainable behavior among people who are not already committed to environmentalism,” Brook concludes.
Granted, this is one small study, and one can question whether the subject of one’s letter to the governor is a precise marker of environmental activism. (You could be pro-environment but still feel so strongly about another issue that you choose to focus on it in your plea to the state capital.)
But the findings track with those of an unpublished 2009 paper that found information regarding one’s environmental footprint led to “reduced feelings of self-efficacy,” which in turn “predicted lower intentions to engage in behaviors that reduce global warming.”
“Some psychological theories suggest that instead of changing their environmentally damaging behavior to match their environmental goals, people may react to negative feedback by changing their environmental views to match their behavior,” she notes. Her study suggests this thesis has merit.
So the environmental-footprint concept may have to be rethought, or at least placed in a context where it doesn’t lead to denial or despair. Brook suggests “giving specific, feasible recommendations” about how to live in a more environment-minded manner might produce more positive results.
That question awaits further research. What we know at this point is that encouraging environmentally friendly behavior remains a tricky, problematic endeavor. It seems admonishing someone for their large footprint can produce a big backlash.
Global Warming: Good for Bad, Bad for Good - Except (Surprise!) Wind EnergyBy Marlo Lewis, GlobalWarming.org
If you’ve been following the global warming debate for any length of time, you know how boringly predictable the “consensus” narrative has become. Global warming is good for bad things - poison ivy, ticks, toxic algae blooms, malaria-carrying mosquitoes - but bad for good things - polar bears, ski resorts, Vermont’s maple sugar industry, and the weather patterns on which agriculture (hence human survival) allegedly depend.
And supposedly, one of the cures for global warming is to “repower” America with zero-carbon energy, especially electricity generated from wind turbines.
But that creates a bit of a conundrum for warmists. If global warming is going to play havoc with the weather, how do we know that the best locations for siting wind farms today will remain optimal (or even marginally productive) in the allegedly topsy turvy greenhouse planet of tomorrow?
Never fear! A new study funded by the National Science Foundation finds that global warming will not significantly change America’s wind patterns over the next 50 years. From the NSF’s press release:
Rising global temperatures will not significantly affect wind energy production in the United States concludes a new study published this week in the Proceedings of the National Academy of Sciences Early Edition.
But warmer temperatures could make wind energy somewhat more plentiful say two Indiana University (IU) Bloomington scientists funded by the National Science Foundation (NSF).
They found warmer atmospheric temperatures will do little to reduce the amount of available wind or wind consistency - essentially wind speeds for each hour of the day - in major wind corridors that principally could be used to produce wind energy.
“The models tested show that current wind patterns across the US are not expected to change significantly over the next 50 years since the predicted climate variability in this time period is still within the historical envelope of climate variability,” said Antoinette WinklerPrins, a Geography and Spatial Sciences Program director at NSF.
“The impact on future wind energy production is positive as current wind patterns are expected to stay as they are. This means that wind energy production can continue to occur in places that are currently being targeted for that production.”
“The greatest consistencies in wind density we found were over the Great Plains, which are already being used to harness wind, and over the Great Lakes, which the U.S. and Canada are looking at right now,” said [Principal Investigator Sara] Pryor.
Such predictions could prove crucial to American policymakers and energy producers, many of whom have pledged to make wind energy 20 percent of Americas total energy production by 2030. Currently only about 2 percent of American energy comes from wind.
So the world is not coming to an end after all - at least not if you are an investor in taxpayer-subsidized, state-mandated wind energy. Global warming will change the monsoon season in southeast Asia. It will cause drought and desertification in Africa. It will flood millions of people out of their homes in Bangladesh. But it will not - repeat not - change U.S. wind patterns. In fact, global warming will have a “positive impact” on the wind patterns “currently being targeted” for wind-energy “production.”
Climate change “threatens the survival of our civilization and the habitability of the Earth,” according to Al Gore. But climate change will not disturb U.S. wind patterns and may even improve them. How convenient for corporate rent seekers and their congressional patrons!
Verily, Gaia is great. She not only whips up hurricanes and tornadoes to punish our sins of emission, she also insulates the wind from our corrupting influence so that green job creators can begin the process of planetary healing.
Okay, if you find that farfetched, try this thought experiment. What would happen if the NSF study concluded that climate change would significantly reduce the efficiency of wind energy production in the Great Plains? Those same rent seekers and their congressional buddies would be up in arms.
And who funds NSF? Congress, of course. Anyone see a pattern here? Bob Dylan said it long ago: “You don’t need a weather man to know which way the wind blows.”
Hockey Schtick, Sunday, May 1, 2011
New Paper: Greenland ice sheet didn’t melt despite temperatures much hotter in the past
A new paper from the 2011 Antarctic Science Symposium presents new ice core data from Greenland and finds that not even the southern portion of Greenland was ice-free during the Eemian period, despite temperatures much higher than the present (5C or 9F) lasting for 16,000 years (from 130,000 to 114,000 years ago). Meanwhile, alarmists such as Richard Alley (buddy of Michael Mann at Penn State) and James Hansen claim “The entire ice mass of Greenland will disappear from the world map if temperatures rise by as little as 2C.” Note global temperatures have recovered by a mere 0.7C since the end of the Little Ice Age in 1850 and have been flat to declining since 1998.
Eemian Period from 130,000 to 114,000 years ago was est. to be at least 5C hotter than the present
The role of the Greenland Ice Sheet in future sea levels - Based on palaeorecords from ice cores and present observations
A new Greenland ice core has been drilled. The first results from the NEEM ice core are presented and then combined with results from other deep ice cores from the Greenland Ice Sheet.
All of the ice cores drilled through the Greenland Ice Sheets have been analyzed, and the results show that all contain ice from the previous warm Eemian period near the base. Is it thus clear that the Greenland Ice Sheet has existed for over 120,000 years, going back to the previous warm period, when it was 5 deg C warmer over Greenland?
The difference between Eemian and Holocene stable oxygen isotope values has been combined with an ice sheet flow model constrained by the ice core results and internal radio echo sounding layers, to estimate the volume of the Greenland Ice Sheet 120,000 years ago.
The results show that South Greenland has not been ice-free during the Eemian period, and that the sea level contribution from the Greenland Ice Sheet has been 1 to 2 meters.
See post.
See also A 225-year reconstruction of Greenland ice melt by World Climate Report on the Greenland ice melt which likewise concludes no cause for alarm.
-------------------
Record Snow Season in Western Ski Country
The season is now over at most US resorts but for several famous name areas it has been a record-breaking winter for snowfall, and those that are still open are racking up fresh snowfall even now.
In Colorado Vail, which closed at the weekend, has reported more snow than ever before. Vail has received 511 inches (12.8m) of snow this winter, beating the previous record of 505 inches set in the 1977-78 season.

Two nearby resorts that are still open - Arapahoe Basin and Loveland - have both recently passed the 100 inch (2.5m) base level and, in Loveland’s case at least, may also set all time snowfall records.
Loveland has had a foot (30cm) of new snow in the past few days and a similar amount is forecast for the next few days. So far it has received 536 inches of snow this winter and needs to pass 572 inches (the 1995/96 season total) to break records. Its season continues to May 8th. Arapahoe Basin has seen similar snowfalls recently although its season-to-date total is less than 400 inches (10 metres). It currently expects to stay open until at least June 5th.
In California several resorts have set all-time snowfall records, including Mammoth Mountain which plans to remain open in to July. Squaw Valley is open weekends through May.
Other still open options include Snowbird in Utah, Crystal Mountain in Washington state (which announced a foot of snow earlier this week and hopes to stay open to July) and Timberline in Oregon which aims to stay open almost year round (Closing for a few weeks in September). It issued a powder alarm for 41cm of new snow on Tuesday.
Snowbird also just reported it has received the most snow in its 40 year history at 690 inches (17.25m)
“This has been a remarkable season for Snowbird,” said resort president Bob Bonar. “We’ll be celebrating with skiing until Memorial Day and most likely beyond, with conditions that are anything but typical spring skiing.”
And the snowpack was said to be diminishing especially in the early spring in the Pacific Northwest. Here courtesy of Steve Goddard are two images from Mt. Rainier.
By Kenneth Green, IPCC Reviewer
While the climate is largely unpredictable, the actions of climate-change catastrophists are utterly predictable. When I heard about the wave of tornadoes that devastated the South, I predicted (to my wife) that they would quickly be attributed to climate change by activists seeking (as they regularly do) to capitalize on human death and misery to advance their political agenda.
Well, that didn’t take long. Over at Think Panic, er, Think Progress, the blog of the Center for American Panic, er, Progress, Brad Johnson posts:
“Given that global warming is unequivocal,” climate scientist Kevin Trenberth cautioned the American Meteorological Society in January of this year, “the null hypothesis should be that all weather events are affected by global warming rather than the inane statements along the lines of ‘of course we cannot attribute any particular weather event to global warming.’”
While I believe that the climate is changing and that human greenhouse-gas emissions cause some part of that change, the shrill attribution of things like Japans earthquake and tsunami to climate change, and tying the recent tornadoes to climate change, rings a bit like dialogue from Ghostbusters:
Dr. Peter Venkman: This city is headed for a disaster of biblical proportions.
Mayor: What do you mean, “biblical”?
Dr Ray Stantz: What he means is Old Testament, Mr. Mayor, real wrath of God type stuff.
Dr. Peter Venkman: Exactly.
Dr Ray Stantz: Fire and brimstone coming down from the skies! Rivers and seas boiling!
Dr. Egon Spengler: Forty years of darkness! Earthquakes, volcanoes…
Winston Zeddemore: The dead rising from the grave!
Dr. Peter Venkman: Human sacrifice, dogs and cats living together… mass hysteria!
Mayor: All right, all right! I get the point!
Of course, there is fiction, and there is reality. As Guillaume Decamme posts over at Physorg.com:
US meteorologists warned Thursday it would be a mistake to blame climate change for a seeming increase in tornadoes in the wake of deadly storms that have ripped through the US south.
“If you look at the past 60 years of data, the number of tornadoes is increasing significantly, but it’s agreed upon by the tornado community that it’s not a real increase,” said Grady Dixon, assistant professor of meteorology and climatology at Mississippi State University.
“It’s having to do with better (weather tracking) technology, more population, the fact that the population is better educated and more aware. So were seeing them more often,” Dixon said.
By Joseh D’Aleo, CCM, WeatherBell
SEE ALSO today’s post April 30 Blizzard warning in North Dakota and the coldest April in 36 years in Pacific Northwest. Alarmists said as late as 2006 “Springtime melt now starts some 20 days earlier than a half-century ago, which is “pretty unequivocally” seen as a signature of climate change.” Snowmelt has been at least 30 days LATER than normal this year and it is typical of the last 4 cold springs there. Pretty unequivocally COOLING is taking place but I am sure they will figure out a way to claim that this was expected or consistent with their models.
--------------------------
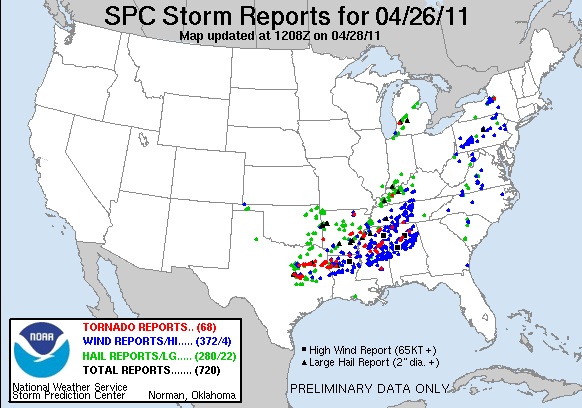
Epic severe weather week
We talked about this would be a season of major floods and severe weather in our first posts on WeatherBell and Icecap in early March. Last week we warned the middle of this week would see another outbreak like the one in Mid April. And earlier this week we predicted the count would top 200 tornadoes before it was all said and done.
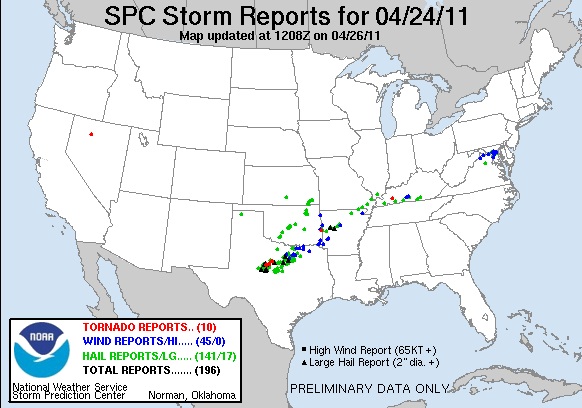
It started Sunday in the southern Plains with 10 tornadoes and 196 severe storms reports.
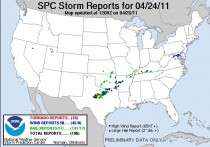
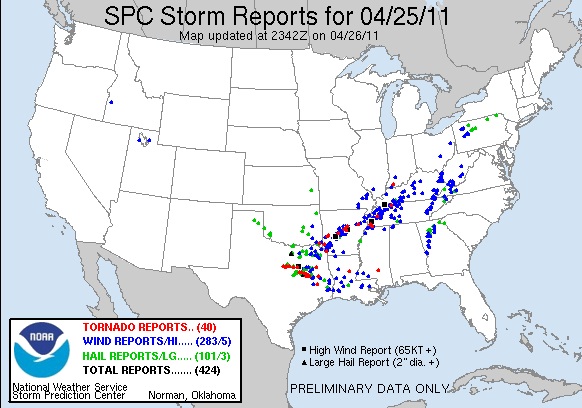
Monday it ramped up with 40 tornado and 424 severe weather reports.
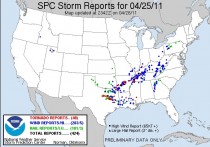
Tuesday action shifted slightly east and increased further with 61 tornadoes among 702 severe weather reports.
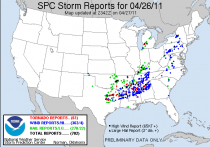
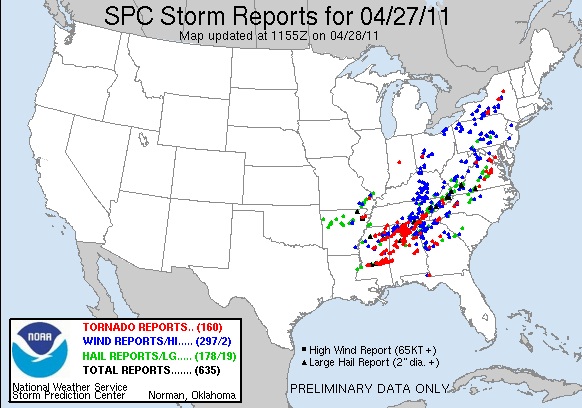
For yesterday, the preliminary count is an amazing 160 tornado tornadoes and 635 severe weather reports. The Gulf States were especially hard hit but with tornadoes up to Virginia and even New York State.
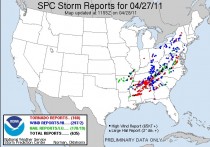
The preliminary total for the 4 days came to 278 tornado reports and an amazing 1970 reports of severe weather.
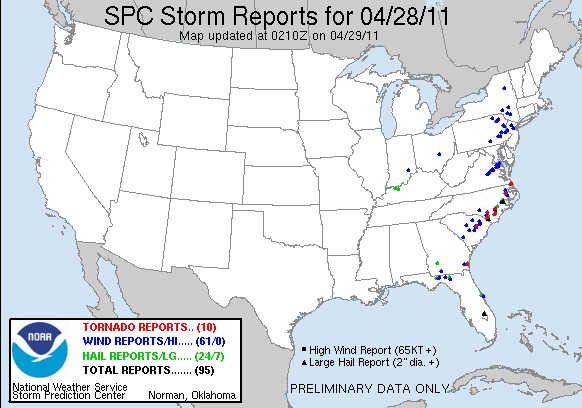
Thursday was the last day if this onslaught. Friday saw additional tornadoes near the east coast before the storms moved offshore. Preliminary reports had 14 tornado and 114 severe weather reports, bringing the total for the week to 282 tornado and 2084 severe weather reports.

The actual number of tornadoes will be reduced as with the longer track storms like we often see in this kind of situation, the same tornado can be reported multiple times. It will take them awhile to sort this out. Especially given the same people will be busy with the next severe weather. It looks like it will be mostly associated with squall lines ahead of more rapidly moving cold fronts in this new pattern with increased blocking at least for the next week or so.
Clearly though this week’s onslaught will rank among the most significant outbreaks in history Sadly the death toll this morning stood at over 337 and climbing.
The devastation from the severe weather mentioned is made worse with the massive flooding occurring in the nations midsection and in the interior parts of the northeast. The cooling and stabilizing air mass off the still cold Atlantic usually knocks the legs out from the thunderstorms that move east and even diminish the rains so eastern and southern New England will probably get off relatively easy.
One last point. the great Stanley Changnon, formerly director of the Illinois Water Survey had done a study probably in the 1990s that I reported on about how although the media attention was mainly on the feared El Ninos, that La Ninas were far more dangerous and costly with more cold and heavy winter snows that paralyze economies and transportation, more spring flooding and deadly and damaging severe weather outbreaks and more landfalling hurricanes than El Nino. The last few years and especially this year is an illustration of this. The severe weather season is not over and then we have the hurricane season which both JB and I think will be more impactful.
See posts on Weatherbell.com.
No doubt there will be some suggesting the severe weather and floods is due to global warming but as we discussed in numerous posts on Weatherbell (like this from last week advertizing this outbreak), it was a combination of the most spring snowcover across the hemisphere in a quarter century, unusual cold across the north (Billings MT 118 straight days with lows below 40, a new record and soil temperatures in Iowa and other parts of th Upper Midwest still mostly in the 40s, which is why corn planting is well behind normal) which increases the contrast and enhances the jet stream which energizes the storms that ride along it, and finally warm dry air flowing out of the droughty southern plains into mid levels making the air convectively unstable. These classic severe weather iongredients were common in the last cold PDO when the La Ninas occurred (1965 Palm Sunday outbreak, the 1967 Belvidere and St Louis outbreaks and then the 1974 Superoutbreak). The last time we had these active springs was the last time the globe was COOLING - from the late 1940s to the mid 1970s. Don’t let them tell you its warming.
SEE THIS EXCELLENT APPINSYS ‘TORNADO LIES’ POST that explains why climate hucksters like Peter Gleick in the predictably clueless HUFFPO Green have it all wrong as usual. Gleick is the one who just a few months ago was cautioning the media not to make too much of cold and snow because that was weather not climate> See this Roger Pielke Jr. post.
By Willis Eschenbach on Watts Up With That
I took a lot of flak last year for my post saying that the global 50% drop in phytoplankton claimed by Boyce et. al was an illusion. I had said:
So where did the Nature paper go wrong?
The short answer is that I don’t know ...but I don’t believe their results. The paper is very detailed, in particular the Supplementary Online Information (SOI). It all seems well thought out and investigated ...but I don’t believe their results. They have noted and discussed various sources of error. They have compared the use of Secchi disks as a proxy, and covered most of the ground clearly ...and I still don’t believe their results.
In other words, I took my chances on my experience and went way, way out on a limb with my statements. And of course, people didn’t let me forget it.
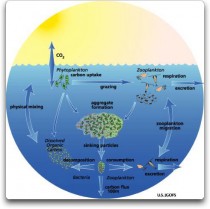
Figure 1. Life Cycle enlarged of Phytoplankton
Now we get these two “Brief Communications Arising”, from Nature magazine (emphasis mine).
Nature Volume: 472, Pages: E6-E7
Brief Communication Arising (April, 2011) Arising from D. G. Boyce, M. R. Lewis & B. Worm Nature 466, 591-596 (2010)
Phytoplankton account for approximately 50% of global primary production, form the trophic base of nearly all marine ecosystems, are fundamental in trophic energy transfer and have key roles in climate regulation, carbon sequestration and oxygen production. Boyce et al.1 compiled a chlorophyll index by combining in situ chlorophyll and Secchi disk depth measurements that spanned a more than 100-year time period and showed a decrease in marine phytoplankton biomass of approximately 1% of the global median per year over the past century. Eight decades of data on phytoplankton biomass collected in the North Atlantic by the Continuous Plankton Recorder (CPR) survey2, however, shown increase in an index of chlorophyll (Phytoplankton Colour Index) in both the Northeast and Northwest Atlantic basins 3, 4, 5, 6, 7 (Fig. 1), and other long-term time series, including the Hawaii Ocean Time-series (HOT)8, the Bermuda Atlantic Time Series (BATS)8 and the California Cooperative Oceanic Fisheries Investigations (CalCOFI)9 also indicate increased phytoplankton biomass over the last 20-50 years. These findings, which were not discussed by Boyce et al.1, are not in accordance with their conclusions and illustrate the importance of using consistent observations when estimating long-term trends.
Along with this one:
Nature 472, E5-E6 (14 April 2011)
Brief Communication Arising (April, 2011) Arising from D. G. Boyce, M. R. Lewis & B. Worm Nature 466, 591-596 (2010)
Closer examination reveals that time-dependent changes in sampling methodology combined with a consistent bias in the relationship between in situ and transparency-derived chlorophyll (Chl) measurements generate a spurious trend in the synthesis of phytoplankton estimates used by Boyce et al.1. Our results indicate that much, if not all, of the century-long decline reported by Boyce et al. is attributable to this temporal sampling bias and not to a global decrease in phytoplankton biomass.
OK, so I was right. The Boyce paper was nonsense, the claimed trend was spurious, plankton biomass is holding somewhere near steady or even increasing, and a number of independent records show that the Boyce et al. paper is garbage built on bad assumptions.
I bring this up for three reasons. The first is to show the continuing shabby quality of peer-review at scientific magazines when the subject is even peripherally related to climate. Nature magazine blew it again, and unfortunately, these days that’s no news at all. It’s just more shonky science from the AGW crowd… and people claim the reason the public doesn’t trust climate scientists is a “communications problem”? It’s not. It’s a garbage science problem, and all the communications theory in the world won’t fix garbage science.
The second reason I posted this is just because I enjoy it when it turns out that I’m right, particularly on a risky statement made with no data and in the face of opposition, and I wanted to enter that fact into the record. Childish, I know, but at least I’m adult enough to admit it.
The third reason is a bit more complex. It is to emphasize the value of actual experience. I didn’t disbelieve Boyce et al. because I had any data. I had no data at all.
What I did have was a lifetime spent on and under the ocean. Phytoplankton form the basis of all life in the ocean. If the phytoplankton had actually gone down by 50%, all life in the ocean would have gone down by 50% and my experience said no way that was true. Fish catches haven’t gone down like that, numbers of species on the reef and along the coast haven’t gone down like that, I would have noticed, people around the world would have been screaming about it.
So I put my neck on the chopping block, and I trusted my experience ...and in the end, despite the people who laughed at me and abused my claims, my experience won out over Boyce’s “science”.
Does this mean that we should always trust our experience over science? Don’t be daft. Science is hugely valuable, and often shows that our experience has misled us completely.
But far too many scientists forget to check the obvious - their own experience. Not one of the Boyce authors thought “Wait a minute ... since the oceans live almost entirely off the phytoplankton, if plankton is down by half why haven’t I seen oceanic populations from krill to whales and octopuses dropping by half?” Or perhaps they just didn’t have the experience to check the obvious.
The moral of this story? Well, the moral for me is that trusting my experience over the “science” of high-powered scientists living in an ivory tower far above the ocean worked out well ... this time.
But the real moral is that scientists need to pay more attention to the “laugh test”. I know when I first heard the Boyce claim, I busted out laughing...and when our experience is that strong in saying that science is wrong, it’s likely worth checking out.
Read more and especially his added commentary on “the smell test, the laugh test, and the eyeball test:” as they apply to plethora of shoddy AGW science and epitomized in the advocacy rag that Nature has become.
See Tom Nelson reports “Warmist Revkin admits that he knew last year about problems with highly-publicized, peer-reviewed plankton alarmism, but he failed to write about it”. On Plankton, Warming and Whiplash - NYTimes.com
By Joseph D’Aleo, CCM, AMS Fellow
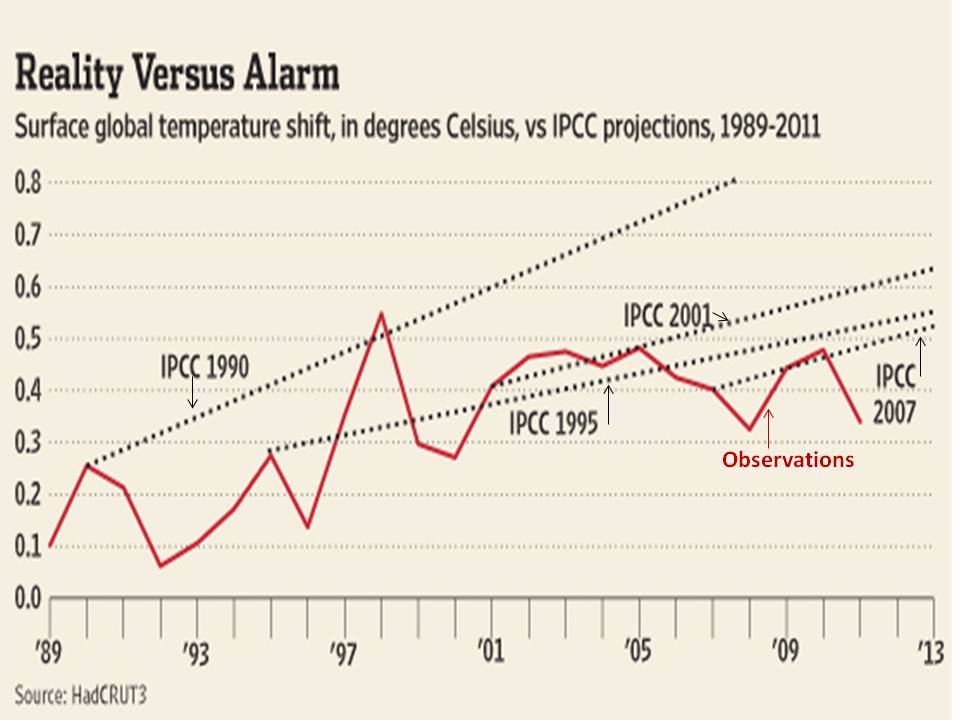
The 2010 as expected caused a global spike in temperatures. The subsequent La Nina caused a cooling. The stasis is going on a decade. Even Phil Jones admitted little significant change since 1998 (and a cooling of 0.12C from 2002-2009).
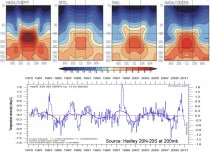
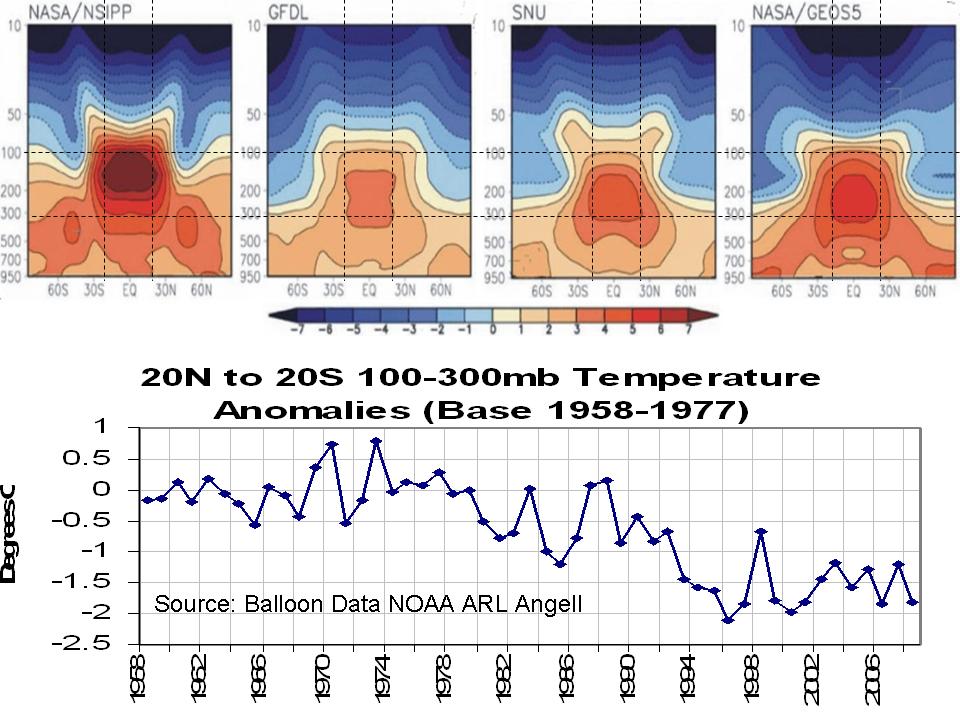
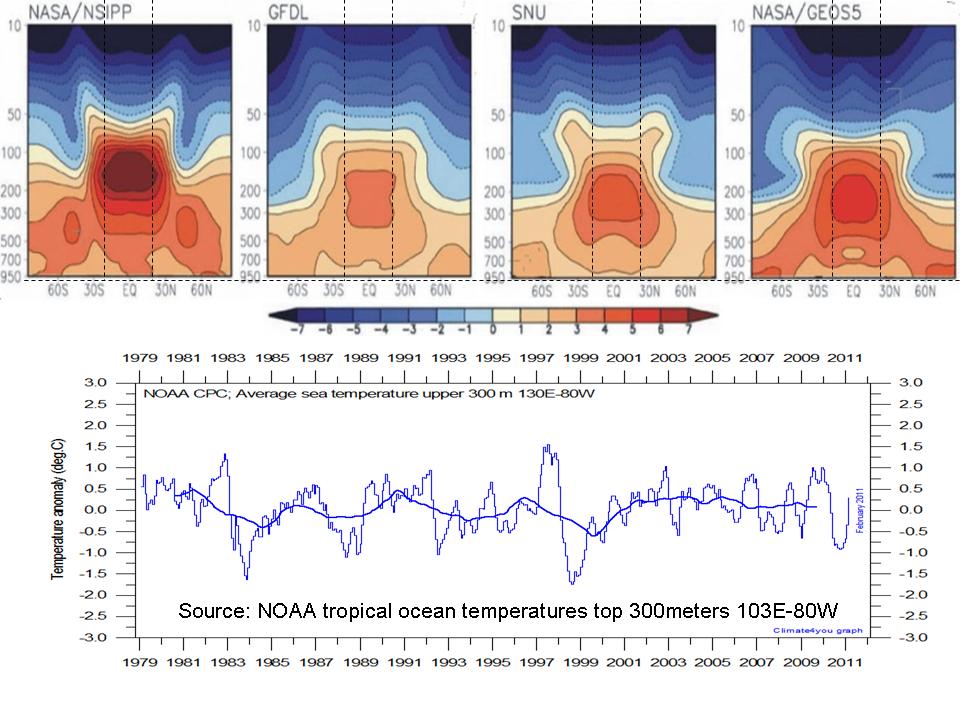
The greenhouse models as shown in the top of the following graphs forecast the greatest global warming high up in the tropics where the greenhouse gas ‘heat trapping’ and condensation from enhanced convection and increased moisture is greatest. Notice however in this hart how weather ballooons don’t see the warming at that level. The data here is NOAA ARL data from Angell. Other radiosonde compilations such as RICH show less cooling but no warming.

Enlarged.
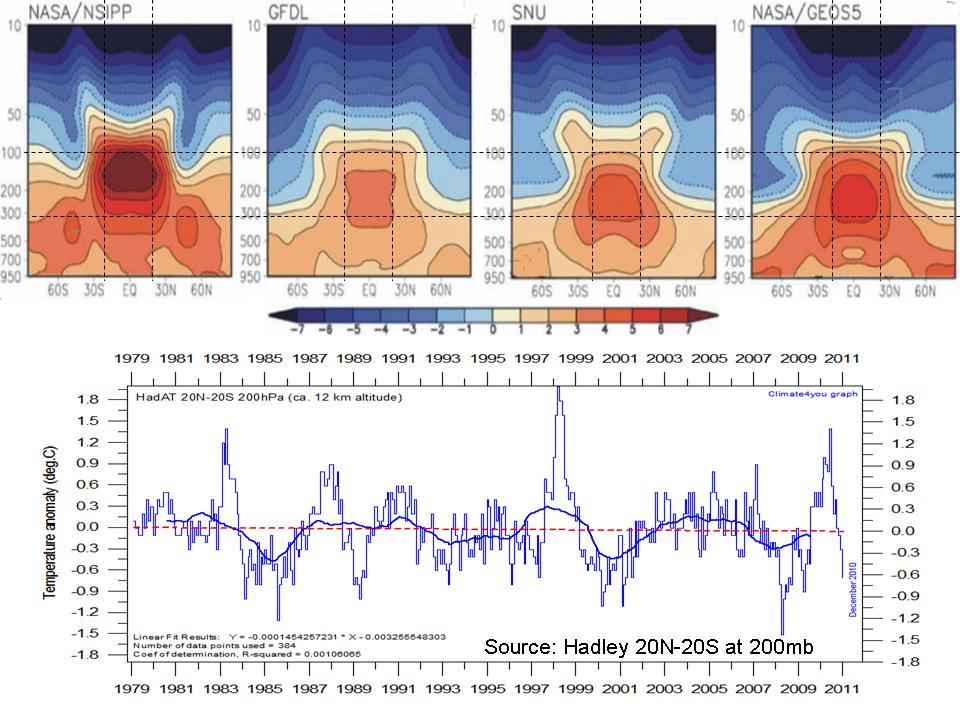
The Hadley 20N-20S data compilation in the same tropical belt (20N-20S) at 200mb show also no warming (actually a slight cooling) in over three decades.
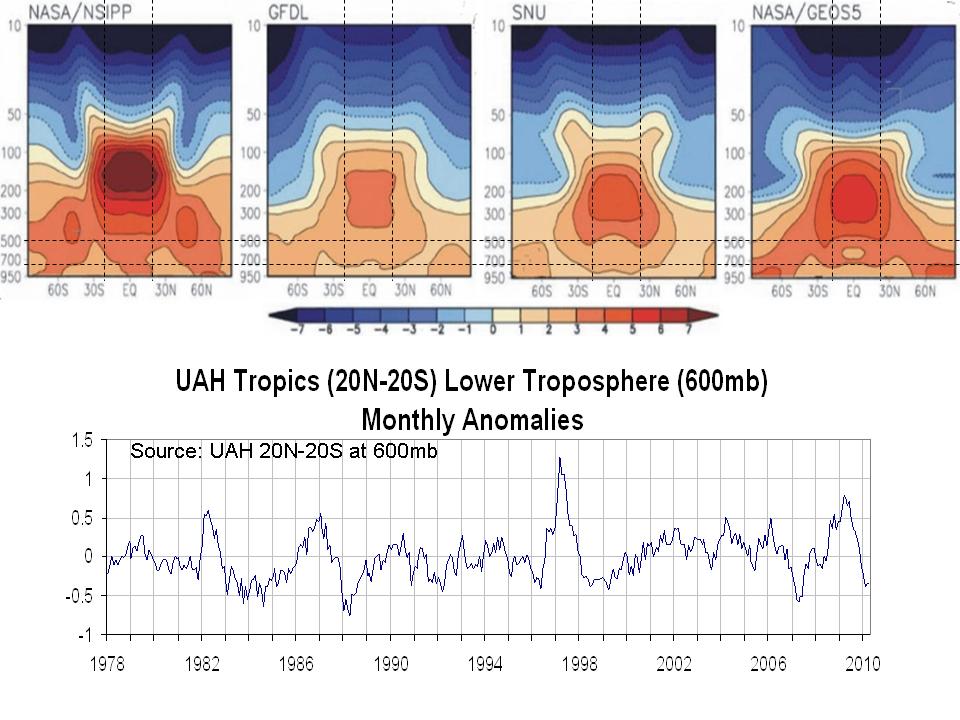
The University of Alabama MSU satellite data is optimized lower down at 600mb. See how they show little change in the 32 years.

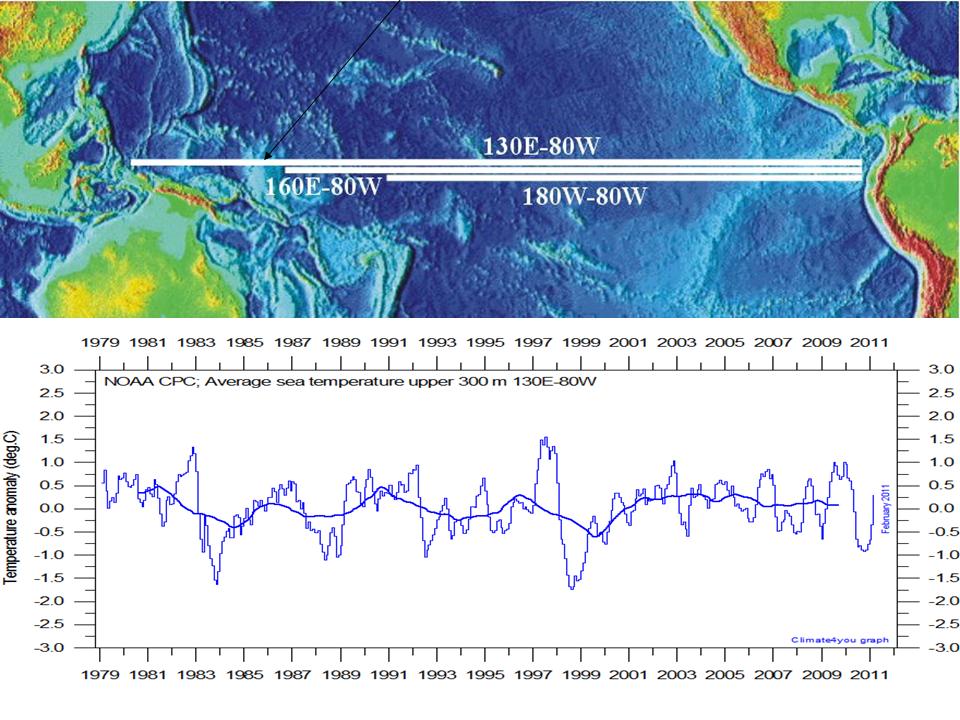
The oceans are modelled to warm significantly due to greenhouse gases with increased heat content. Buoys provide a very good depiction of ocean temperature profiles (not contaminated by factors like urbanization). The average temperature of the sea in the belt from 5N to 5S and through the depth of 300m shows a slight not statistically significant cooling since 1979.
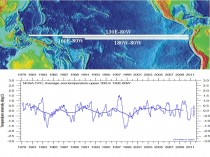
Again see how that matches up with model forecasts here.

This is another series of facts that call into serious question the greenhouse models and theory. See story here.
By Dr. William Briggs
Since I am away out west, I sent intrepid reporter and number two son John Henry Briggs to the Center for Place, Culture and Politics at CUNY Graduate Center, where he witnessed the event “Nature Has Rights”, in which a panel asks questions like, “Does a river have a right to flow?” Happy Earth Day!
I arrived at the CUNY Graduate Center in midtown Manhattan five minutes early. I found my way to the auditorium where about 200 people were already sitting, idly chatting. In one conversation from the group in front of me, I caught the words “Republican”, “recount” and “election.”
The white-bearded David Harvey, a professor at CUNY, and this evening’s moderator begins introductions. First up, Shannon Biggs, a chipper looking lady with glasses and red-black hair. She works with an NGO called Global Exchange, their motto is “Building people-to-people ties”.
Second, a man in a garish shirt named Cormic Cullinan, a South African Environmental lawyer who just published his book “Wild Law: A Manifesto for Earth Justice” which is available on the table outside for just $5.
Thirdly, Vandana Shiva, a self-described ecofeminist and environmental activist dressed in traditional Indian garb.
Next up, a very nondescript Maude Barlow, who holds the position of Chairperson to the Council of Canadians and is the Senior Advisor to the President of the 63rd UN General Assembly.
Last, but not least is Pablo Solon, the Bolivian ambassador to the UN.
Mr. Harvey puts the first question to his panelists: “What do we mean by rights of Nature? And why is it significant?” Each member ignored this and instead said what they came there to say. Biggs gets the ball started and complains that, “Nature can be owned, nature is property-like a slave.” Not missing a beat, she turns to the BP spill, complaining that only people could sue BP, but Nature could not. If Nature had rights, then Nature herself could get her cut from BP as well.
Continuing along the same vein, Cullinan stresses that, “We’ve become autistic to the natural world.” He insists in three different ways that there is an order to nature we must adhere to.
Shiva is the audience favorite. She is passionate and she ignores all questions. She begins ranting about the agriculture company Monstano and their genetic modification of plants. The audience bursts into applause when she said corporations should be punished for putting “toxic” in their plants. She then goes on to recount proudly the many things shes protested against and ends saying that to be disconnected from nature is a psychiatric disease.
In contrast, Maude Barlow is dull, and only mentions some scary statistics that predict that demand for water is going to be 40% more than the supply in some-thirty years time. She recommends Al Gore’s idea of a “green economy”, the her idea that nature is worth $72 trillion is met with warm chuckles. She reiterates that she’s not saying bugs will should have the same rights as humans, but we can’t push them to extinction.
Ambassador Solon said that on the 28th of July there will be an event at the UN named, “From the human right to water to the rights of water.” Which we gather will be exactly what it sounds like (i.e., water has “rights"). He said that human growth should be limited “Only to satisfy our basic needs.” He signs off with a bombshell that brings down the house, “To fight for nature we have to fight against capitalism.”
The moderator then began his monologue, in which he mentions how silly the idea is of giving rights to something “fictional” like corporations similar to humans. But giving rights to Nature isn’t. He anticipates critics and said that the idea of giving rights to nature “Isn’t that weird.” He went on to mock his colleagues who consult for corporations, insinuating corporations “Willfully want to destroy the environment.” Somewhere in his rambling speech, he blamed world poverty on corporations and on capitalism.
At this point, Shiva comes to the happy realization, “There’s no debate here, everyone agrees with one another!” All smiled.
Cullinan, agreed and stated that the environmental movement is the, “Largest social movement ever.” He likened to the debate over the environment to the Galileo and Copernicus affair, repeating the myth that before these scientists humanity held the view that the universe revolves around humans. He said that, “If we don’t do something now, sometime in the future we may become extinct.” He claimed that, “Our offspring our less likely to survive” than us.
Shiva came back to the microphone and offered this conclusion: “We’ve been made to believe for humanity to succeed we need to destroy nature.” She also blamed India’s problem on capitalism and especially corporations.
As the panelists reiterated themselves for the dozenth time, they finally ended and then invited questions, which prompted the people with the strongest opinions to jump up to the mics and me to leave.
Pass this article on to at least one person. That’s an order!
See how a CNN anchor confesses his eco-sins on Earth Day.
By Joe Bastardi, WeatherBell
I simply cant understand the lack of fact finding in this article but I am going to “help” the author by showing him the facts, if he dares too look.
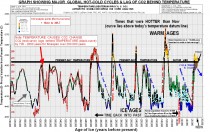
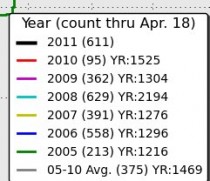
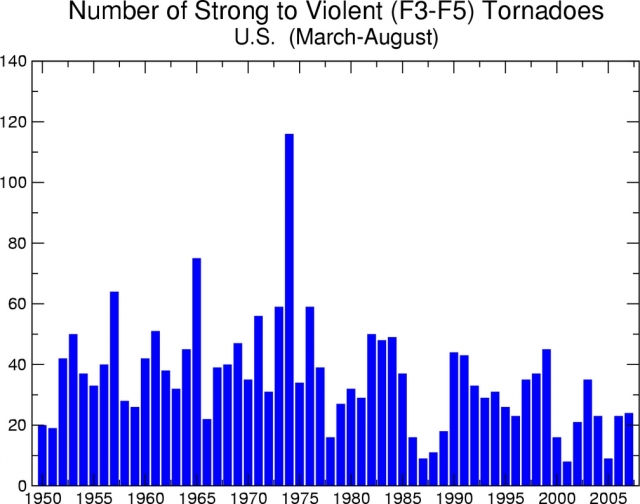
First of all, let’s take a look at actual data on tornadoes
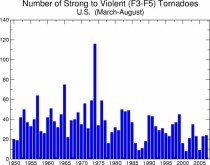
Notice how there were more tornadoes across the US when the climate was colder, the time of the cold PDO back in the 60s and 70s and it has been decreasing since the PDO has warmed...and amazingly since Jim Hansen set the world on Fire in 1988 with his doom and gloom prophecy, the numbers have trended down! The reason they are going up is because we are turning colder again. The last 2 big tornado springs have been after major La Ninas and sharp drops in global temps. Here look at the facts:
THE PDO IS TURNING COLD AGAIN, and when the La Nina came on after the El Nino, 2008 had a major jump from 2007 and now this has occurred. Please look at the facts, here they are:

In fact, I just did a hit on national TV on April 7 th on this very matter,
how last year was so warm and tranquil
And this year had all the ingredients in it for major cold and warm fighting in clash. The evidence of seeing this before global warming got blamed:
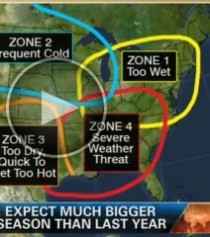
I couldn’t have drawn it up any better, but I guess the author of the article wasn’t watching.
Now let me continue to drive home this point.
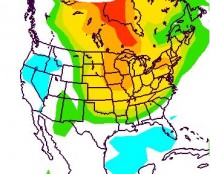
Look at the US temps for the same time period as the warmth you saw above for March 25-Apr 16 2010, the one below, this year
Major cold has been available, and if anything , over the last week has pressed had into the warmth that has been surging northeast.. But the point is that its THE FIGHT BECAUSE ITS GETTING COLDER. that leads to all this!!!
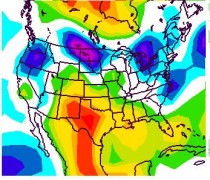
Not that its warm. One needs cold to press to cause the fights, one can see that with the major tornadoes in the globes colder cycle, and we are going back there because of the Pacific cooling now. Remember those low numbers of tornadoes last year. Lets look at this..global temps last year in blue, the average in orange the record LOWS in purple and the current temps in red:

Look closely at what this says:

Only in a fantasy world would cooler mean warmer is causing an occurrence.
Of course the argument can come in, well if it had not been that warm before this would not have happened cause its turning colder. This is the new argument that is being used, and is straight out of the “feelings over facts” that we see going on nowadays. Well I got one for you, if had not been so cold before (then we wouldn’t have such “tranquility” when it warming up.. and since we will (and are) getting our answer on where all this is going (colder as the Pacific and then the Atlantic cool), if you search for the facts over feelings, you will find the answer.
But only if you are willing to look, and do the work! Obviously this article did not see this.
I want to show a close up of those temps and what has happened over the last year BASED ON OBJECTIVE SATELLITE DATA..not proxy reconstructions or whatever
While that “crash” will level off and may even come up in the coming months, a second drop is on the way later in the year. And its not like the climate models, are at least the ones that have the better physics in them aren’t catching this… From the JAMSTEC site:
These are its winter temp forecast...and though I think a) globally its a bit cool and b) its too warm in much of the US, lets look at how it did for
the core of the 2010 warmth
This is from Jan 2010, and its not like it did not see the warmth in advance.
There is a reason to why the weather and the climate behaves the way it does. And while I dont believe any mortal soul has the exact answer, it does help to look instead of mindlessly reciting on a one sided position.
As for me, I will again state my idea. We will get our answer in the next 20-30 years. If the globe does not cool back to where it was in the late 70s by 2030.. USING OBJECTIVE SATELLITE DATA, not against non satellite data that can be adjusted to fit the needs of the adjuster, then you will have no bigger cheerleader for the CO2 argument. But given what is in front of us the next decade or two, and the fact that overall temps have leveled off in spite of the continued increase in CO2, I am confident that the foundational evidence of the overall cyclical nature of the climate will carry the day.
What I am also confident of is global warming, climate change , climate disruption or the man in the moon for all I know is not causing all these tornadoes. And while I will stop short of advocating the idea of cooling causing it, that certainly has more factual basis if one looks and is objective than the article referenced in the link. See full post. See Joe and friends tackle this same topic in a video on Weatherbell.
Both Joe and I are have been warning of an active spring with major outbreaks and more strong tornadoes based on La Nina and a cold PDO, persisting snow and cold in Canada and a warm Gulf. See post from March 11 here. See many other posts by Joe and I on WeatherBell.com on the spring snow and storm season.
By Joseph D’Aleo, CCM
In this special report, NOAA claims rapid warming of the oceans and record ice melt.
”Analysis by the National Climatic Data Center revealed that March 2011 was the 13th warmest on record since 1880. Temperatures in much of the U.S., Siberia, and Africa yielded land surface temperatures that were 1.49 deg F (0.83 deg C) warmer than the 1971-2000 comparison period; Canada, China and Southeast Asia, and Australia were cooler than average. The average global ocean surface temperature was 0.65 deg F (0.36 deg C) above normal, but as La Nina continues to weaken, this number may actually increase.”
Lets look at the UAH plot of temperatures:
Dr. Roy Spencer notes: “The global average lower tropospheric temperature anomaly for March 2011 fell to -0.10 deg. C, with cooling in both the Northern and Southern Hemispheric extratropics, while the tropics stayed about the same as last month. ”This is relative to the 1979-2010 mean. March 2011 was the 15th coldest March in the 33 of satellite data for the globe using the much more reliable UAH data set. That of course can’t be the case and be the 13th warmest in 122 years as NOAA claims.
Ocean temperatures also stayed below normal in March (UAH reports that sea surface temperatures were 0.12C below normal).
The lower atmosphere over the ocean temperatures globally averaged -0.12C versus the 1979 to 2010 climatology. That is the 10th coldest in 33 years, again in sharp contrast to NOAA claims.
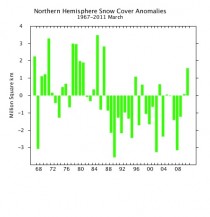
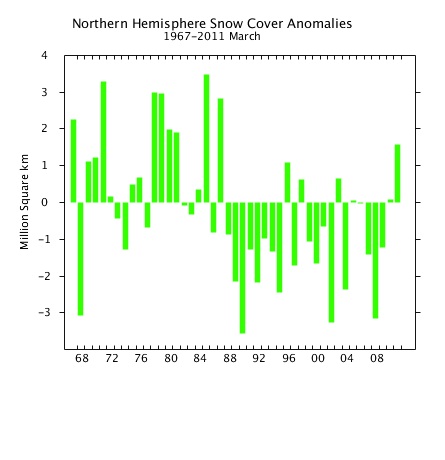
Snowcover remained well above the normal through March and into Mid April.
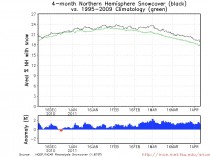
Here is NOAA’s own hemispheric snow data for March. March 2001’s POSITIVE anomaly is the greatest in a quarter century.
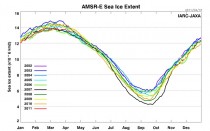
Sea ice actually bounced in March into April and is in the middle of the pack of recent years with the least decline in the record through mid April.
As Steve Goddard comments here “Someone at NOAA is pulling facts out from where the sun never shines.” Another reason why congress needs to continue effort to dedfund the NOAA Climate Service and privatize it.
By Aaron Worthing on Patterico’s Publications
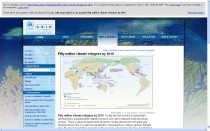
You might remember the other day I pointed out how the UN predicted 50 million climate refugees by 2010, a prediction that came up laughably short of the mark by only around 50 million. Well, if you go to that post and click on the link to the UN page making that claim...something funny happens. You get this:
Of course the great thing about the UN is that even though they are a dishonest-to-evil club for dictators they are also clumsy. Apparently no one at the U.N. knew there was such a thing as a google cache.
A big hat tip to Carlitos. But for his tip, I never would have known the page had disappeared. I had moved on.
Also, I will be putting up screen shots of the google cache (and the full “page not found” screen cap) under the fold, in case someone at the U.N. grows a brain.


See post and comments including one UN apologist here.
-----------------
Ten Major Failures of Consensus Science
By Joe D’Aleo
The US congress sub-committee on Energy and Commerce Committee held hearings on whether to restrict in some way the EPA’s regulatory authority relative to greenhouse gas emissions. There were 7 scientists invited to testify. Three of the four who argued not to restrict the EPA played a key role in the last IPCC report (and will also in the next one) and generally started with the position that IPCC science was sound and there was a consensus of all real scientists.
In this analysis we take a look at the IPCC based science.
Robert Ferguson
Science and Public Policy Institute
202-288-5699
FOR IMMEDIATE RELEASE
Thursday, April 14, 2011
Contact: Christopher Horner, chris.horner@atinstitute.org
Today the American Tradition Institute responded to the American Civil Liberties Union of Virginia and 11 other activist groups - all which are oft-political and always left-leaning - for their new pressure campaign against the University of Virginia, which aims to block ATI’s efforts on behalf of taxpayers to access University records of climate scientist Michael Mann.
In a letter, the advocacy groups ask UVA President Teresa A. Sullivan to deny ATI’s Freedom of Information Act request for emails and other documents related to claims made by Dr. Mann to obtain, and claim payment under, certain taxpayer-funded grants. The groups, which also include Union of Concerned Scientists and People for the American Way, cite phantom exemptions to Virginia FOIA laws such as “academic freedom” and “the exchange of scholarly and scientific ideas.”
ACLU-VA and its collaborators note that ATI’s request “resembles the controversial civil investigative demand, or CID, issued last year by Attorney General Ken Cuccinelli under the Fraud Against Taxpayers Act for Dr. Mann’s records. As a matter of substance the requests are identical, but these same groups are the only instigators of ‘controversy’. ATI simply seeks access to records that belong to taxpayers, under a transparency law that expressly covers state universities and their employees.
“The University was rather candid before, that it reversed course from cooperating with the Attorney General because these same groups instituted a pressure campaign against it,” said Christopher Horner, senior director of litigation for American Tradition Institute’s Environmental Law Center. “But this has no bearing on the University’s obligations under the Freedom of Information Act. If they and pressure groups like Union of Concerned Scientists and People for the American Way want to rewrite FOIA law to exempt the academic class, which uniquely depends on transfers from the taxpayer, the appropriate place to do that is in the legislature.”
The American Association of University Professors and the Council of Environmental Deans and Directors also signed of the ACLU-VA letter.
ATI’s FOIA request is not on behalf of government, but of taxpayers, who have the right to know how and where their dollars are spent - or misspent. “Academic freedom” is not a legitimate exemption, any more than “bureaucratic freedom” is an acceptable exemption for state government employees. The coverage of state universities is very clear in Virginia’s Freedom of Information laws.
ATI notes that the outrage over “academic freedom” by the 12 groups was absent when Greenpeace sought similar records from Mann’s former colleague in the UVA Department of Environmental Sciences, the well-known climate alarmism skeptic Patrick Michaels. They were likewise silent when Greenpeace demanded the records of Professor David Legates at the University of Delaware, and those of Dr. Willie Soon and Dr. Sallie Baliunas at Harvard, as well as when pressure campaigns were instituted against climate scientist-academics in Washington state and Oregon who were also skeptical of alarmism.
“But of course those previous efforts were different,” said ATI’s Horner. “These groups didn’t like those scientists’ beliefs or their speech. Apparently this is an objection of convenience, and is therefore not serious.”
“The ACLU and their doppelgangers call for two classes of people: Those who are covered by laws, and those who aren’t - the academic class, or at least selected academics,” Horner added.
Notably UVA counsel is proceeding on ATI’s request with the highest integrity, though there are disagreements and ATI expects to have to litigate some questions. While ATI expects records soon on a rolling basis, the university has not provided a date certain on which it will produce them.
For an interview with American Tradition Institute senior director of litigation Christopher Horner, email chris.horner@atinstitute.org or call (202)670-2680.
See the American Spectator story Bird Brains and Other Defend Michael Mann.