
|
Sep 19, 2008
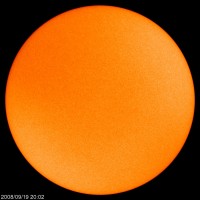
News: NASA to Hold Press Conference on the State of the Sun
By Anthony Watts, WattsUpWithThat
This is unusual. A live media teleconference on the sun. Even more unusual is this statement: “The sun’s current state could result in changing conditions in the solar system.”
As you may recall, I posted an entry about the Ulysses mission back on June 16th and the findings of a lowered magnetic field in the sun, from the JPL press release then: “Ulysses ends its career after revealing that the magnetic field emanating from the sun’s poles is much weaker than previously observed. This could mean the upcoming solar maximum period will be less intense than in recent history.” Here is the Media Advisory:
Dwayne Brown
Headquarters, Washington
202-358-1726
dwayne.c.brown@nasa.gov
DC Agle
Jet Propulsion Laboratory, Pasadena, Calif.
818-393-9011
agle@jpl.nasa.gov
Sept. 18, 2008
MEDIA ADVISORY : M08-176
NASA To Discuss Conditions On And Surrounding The Sun
WASHINGTON — NASA will hold a media teleconference Tuesday, Sept. 23, at 12:30 p.m. EDT, to discuss data from the joint NASA and European Space Agency Ulysses mission that reveals the sun’s solar wind is at a 50-year low. The sun’s current state could result in changing conditions in the solar system. Ulysses was the first mission to survey the space environment above and below the poles of the sun. The reams of data Ulysses returned have changed forever the way scientists view our star and its effects. The venerable spacecraft has lasted more than 17 years - almost four times its expected mission lifetime.
The panelists are:
- Ed Smith, NASA Ulysses project scientist and magnetic field instrument investigator, Jet Propulsion Laboratory, Pasadena, Calif.
- Dave McComas, Ulysses solar wind instrument principal investigator, Southwest Research Institute, San Antonio
- Karine Issautier, Ulysses radio wave lead investigator, Observatoire de Paris, Meudon, France
- Nancy Crooker, Research Professor, Boston University, Boston, Mass.
Reporters should call 866-617-1526 and use the pass code “sun” to participate in the teleconference. International media should call 1-210-795-0624. To access visuals that will the accompany presentations, go here. Audio of the teleconference will be streamed live here.
See post and comments here.
Sep 19, 2008
End-of-the-World Nonsense
By David Kerst, Tracy Press
EDITOR:
Larry Venner’s column (His Voice, Saturday, “The icy truth about global warming") is wrong and shows a lack of knowledge of the facts.
A recent report said that a huge chunk of sea ice had broken off an island in the Arctic, and all the “man-made” global-warming extremists jumped up and started crying about how we are all doomed, and how this sea ice was just another sign of the end of the world.
But if they had bothered to read to the end of the article, it also reported that the island had at one time been free of sea ice about 1,000 years ago. What does that mean? Well, it means that Earth was once so warm that that island had no sea ice attached, and that the increase or decrease of sea ice is not connected to man’s impact on Earth.
How many cars were driving around 1,000 years ago? How many coal plants were running? Only ignorant, uninformed people believe that man is causing global warming.
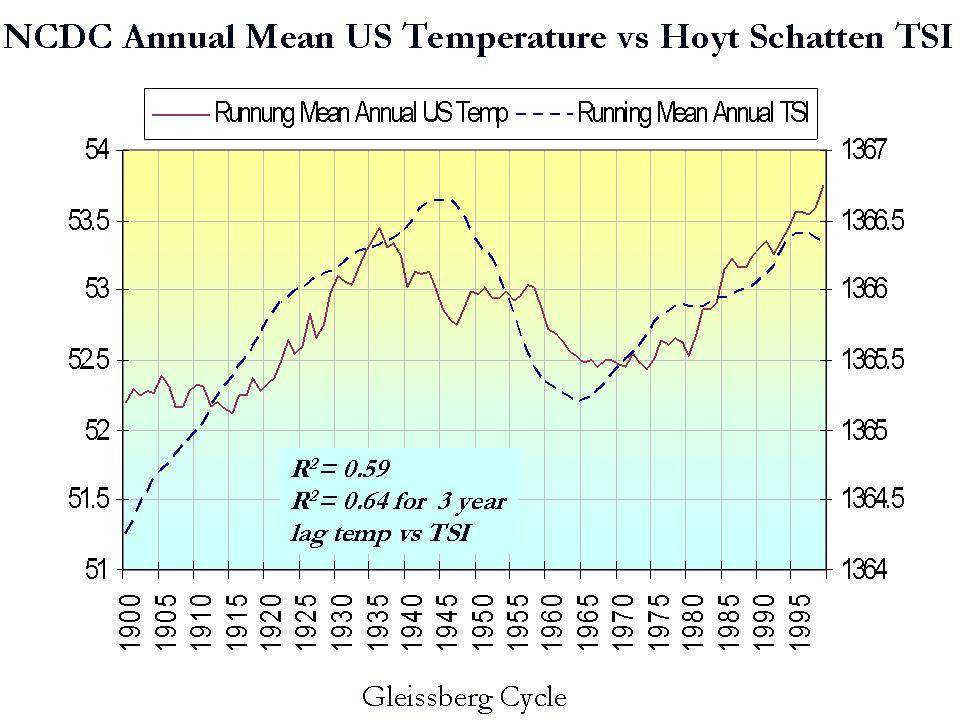
The effect of the sun is the major reason for global warming, to the exclusion of all others. Solar flares and sun spots are the real reason Earth gets warmer or cooler.
If you chart the cycle of Earth’s rising and falling temperatures and superimpose a chart of the solar temperature increases and decreases, they match perfectly.
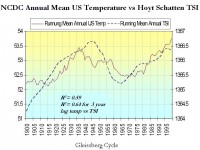
See larger image here
The “man-made” global-warming crowd wants America to spend billions to reduce a naturally occurring gas (carbon dioxide) that has a virtually zero effect on global warming. This is insane. People who willfully set aside common sense and allow themselves and their children to be brainwashed and never question what they are hearing are without excuse. See story here.
Sep 18, 2008
Astronomical Influences Affect Climate More Than CO2, Say Experts
By Kevin Mooney, Staff Writer , CNS News
Warming and cooling cycles are more directly tied in with astronomical influences than they are with human-caused carbon dioxide (CO2) emissions, some scientists now say. Recent observations point to a strong link between “solar variability” - or fluctuations in the sun’s radiation - and climate change on Earth, while other research sees the sun as just one of many heavenly bodies affecting global warming in the later half of the 20th century.
Contrary to what has been stated in a “Summary for Policymakers” attached to the United Nation’s International Panel on Climate Change (IPCC 2007) report—and in subsequent press coverage of the report—there is scant evidence in favor of human-caused global warming, according to geologists, astrophysicists, and climatologists who have released updated studies.
An examination of warming and cooling trends over the last 400 years shows an “almost exact correlation” between all of the known climate changes that have occurred and solar energy transmitted to the Earth, while showing “no correlation at all with CO2,” Don J. Easterbrook, a geologist with Western Washington Univers ity in Bellingham, Wash., told CNSNews.com.
The isotopes located in Greenland’s ice core, along with layering features, make it possible to date and track some of the climate changes that have occurred, he explained. Consequently, he has identified about 30 warming and cooling cycles that have taken place reaching back over the past several hundred years. “Only one in 30 shows any correlation with CO2,” he said. “So if you’re a baseball player with 30 at bats, that’s not a very good average.” The ice core records also show that after the last Ice Age ended, temperatures rose for about 800 years before CO2 increased, Easterbrook pointed out in a recent paper. This demonstrates that “climatic warming causes CO2 to rise, not vice-versa,” he wrote.
“There is no actual physical evidence you can point to that would say CO2 is causing climate change,” he said in the interview. “If CO2 was causing global warming, you would be able to detect this warming in the lower part of the atmosphere (called the troposphere) but there is no warming here, so the answer for some is to look the other way.”
Unfortunately, the media at large is reticent to report on any evidence that contradicts human-caused global warming because there is a lot of money and political influence tied up with the theory, Easterbrook said. As it turns out, this warming trend could be over anyway, according to Easterbrook. A slight cooling period that began to take hold in 1998 could endure for the next 30 years, he forecasts. A phenomenon known as the “Pacific Decadal Oscillation” (warming and cooling modes in the Pacific Ocean) points the way, in his view. “It’s practically a slam dunk that we are in for about 30 years of global cooling,” he said. Read more here.
Sep 16, 2008
Scientist Uncovers Miscalculation In Geological Undersea Record
Science Daily
The precise timing of the origin of life on Earth and the changes in life during the past 4.5 billion years has been a subject of great controversy for the past century. The principal indicator of the amount of organic carbon produced by biological activity traditionally used is the ratio of the less abundant isotope of carbon, 13C, to the more abundant isotope, 12C. As plants preferentially incorporate 12C, during periods of high production of organic material the 13C/12C ratio of carbonate material becomes elevated. Using this principle, the history of organic material has been interpreted by geologists using the 13C/12C ratio of carbonates and organics, wherever these materials can be sampled and dated.
While this idea appears to be sound over the last 150 million years or so, prior to this time there are no open oceanic sediment records which record the 13C/12C ratio, and therefore, geologists are forced to use materials associated with carbonate platforms or epicontinental seas.
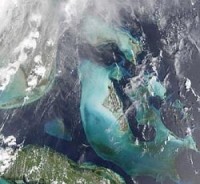
In order to test whether platform-associated sediments are related to the global carbon cycle, a paper by University of Miami Professor Dr. Peter K. Swart appears in the Proceedings of the National Academy of Sciences. This paper examines changes over the past 10 million years at sites off the Bahamas (Atlantic Ocean), the Maldives (Indian Ocean), and Great Barrier Reef (Pacific Ocean). The variations in the 13C/12C ratio are synchronous at all of the sites studied, but are unrelated to the global change in the 13C/12C ratio.
It appears that records related to carbonate platforms which are often used throughout the early history of the Earth are not good recorders of the 13C/12C ratio in the open oceans. Hence, the work presented suggests that assumptions made previously about changes in the 13C/12C ratios of carbonate sediments in the geological record are incorrect.
“This study is a major step in terms of rethinking how geologists interpret variations in the 13C/12C ratio throughout Earth’s history. If the approach does not work over the past 10 million years, then why would it work during older time periods?” said Swart. “As a consequence of our findings, changes in 13C/12C records need to be reevaluated, conclusions regarding changes in the reservoirs of carbon will have to be reassessed, and some of the widely-held ideas regarding the elevation of CO2 during specific periods of the Earth’s geological history will have to be adjusted.” Read full story here.
Sep 16, 2008
Problems with the Climate Models
By Michael R.Fox Ph.D., in the Hawaii Reporter
Recalling that people such as Robert F. Kennedy have called climate skeptics “traitors”, David Suzuki calls for their jailing, the Grist website called for Nuremburg trials for them, NASA’s Dr. Jim Hansen calling for their trials for treason, along with the habitual insults from Al Gore, its been difficult for anyone to respectfully dissent. It’s been difficult to stick to the rules of hard science, by demanding evidence and replication, both of which require questioning but are often followed by insults and threats.
The world owes a lot to many climate sci entists who are closely studying and reviewing the claims of the global warming lobby. They are also attempting to replicate some of these findings without the traditional support of the originating authors. Ordinarily, in the world of hard nosed science, such scrutiny and replication has been historically welcomed. No longer. The well-known name calling, the dismissiveness, the ad hominem attacks, is regrettably now the standard level of discourse. Additionally, these include many laboratory directors, media editors, and Ph.D.s who for whatever reasons adopt the same low roads of discourse and the abandonment of science.
These are difficult times for traditional climate scientists who do practice good science, serious peer review, welcome scrutiny, replication, and the sharing of data. Thanks to the whole world of the global warm-mongers and indentured PhDs, the integrity of the entire world of science is being diminished, followed by a loss of trust and respect. Among the giants challenging the global warming dogma has been Christopher Monckton. He has been a strong international leader, spokesman, and expert in unraveling the complexities of the man-made warming hypothesis.
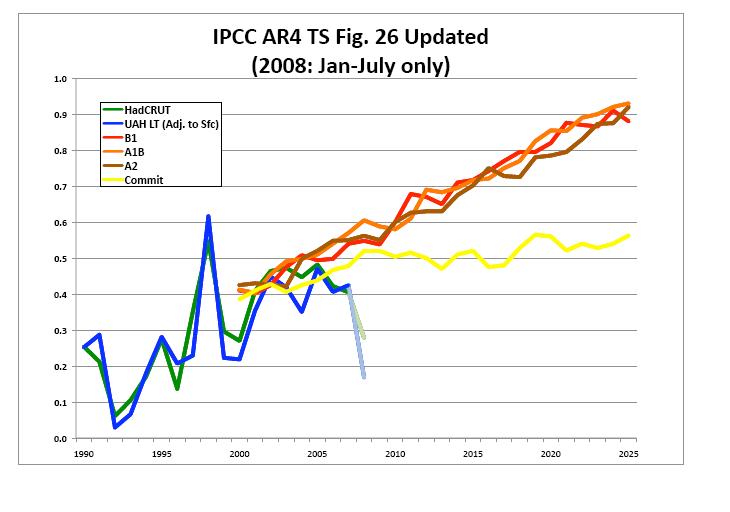
The greatest drivers behind the hypothesis have not been the actual evidence, but computer models. Relative to the largely unknown climate complexities, these are still known to be primitive and incapable of replicating climate data as measured from observations. If a hypothesis can’t explain actual evidence and climate observations, it is wrong, and needs to be modified or abandoned.

IPCC models in the 2007 report are already falsified. See larger image here.
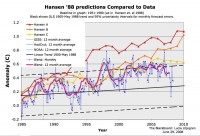
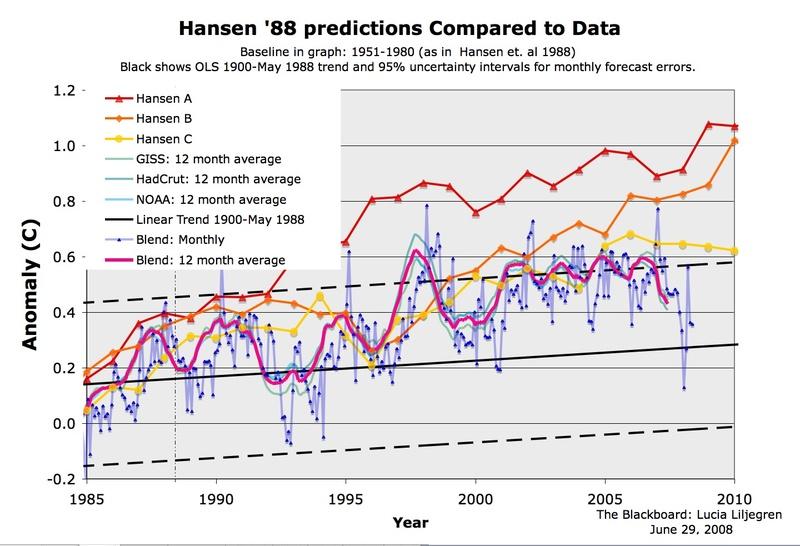
Hansen’s model versus reality. Also being falsified. See larger image here.
In a recent exchange with an expert modeler and believer of global warming, Monckton responded in incredible detail by identifying many of the problems found with the computer models themselves. Monckton is impressively expert in the minutiae of computer modeling, a skill which applies directly to the analyses of the computer climate models. Monckton has performed a detailed analysis of the IPCC’s hypothesis of global warming and identified a long list of failings. They deserved much wider distribution, with an understanding of the serious implications. They and literature references can be found here .
Monckton is not alone in his concerns with computer modeling. Tens of thousands of scientists and engineers who have taken basic mathematics know of the problems and complexities with modeling even simple situations. This author has met a fellow scientist (a bit nerdy admittedly) who carried a long multi-variable multi-term equation on a paper kept in his wallet, which was the equation of the outline of his wife’s face. The modeling problem is delightfully defined by atmospheric physicist Dr. James Peden, who recently said Climate Modeling is not science, it is computerized Tinkertoys, with which one can construct any outcome he chooses. And for my nerdy modeler above, it’s easy to change his wallet equation if he gets a new wife! Read much more here.
|
|
|
|

