
|
Sep 16, 2008
Spotless Sun, Freeze Warning
By Al Fin
Letter by David Watt of Brentwood in Essex to the Belfast telegraph (Mr. Watt is not connected with the Armagh Observatory)
After all the hype over catastrophic anthropogenic global warming (CAGW) doom, it may come as a shock to many readers that scientists do not understand the Earth’s climate very well. Forget Al Gore, forget James Hansen, forget Michael Mann. Pay attention to what the sun is telling us, by its quietness. The observatory [Armagh] notes that solar cycles 21 and 22, which were characterized by being short and intense in their activity, led to the natural global warming observed in the 80’s and 90’s.
“Cycle 23, which hasn’t finished yet, looks like it will be long (at least 12 to 13 years) and cycle 24, which has still to start, looks like it will be exceptionally weak,” writes one observatory scientist.
“Based on the past Armagh measurements, this suggests that over the next two decades, global temperatures may fall by about 2 degrees C - that is, to a level lower than any we have seen in the last 100 years. “Temperatures have already fallen by about 0.5 degrees C over the past 12 months and, if this is only the start of it, it would be a serious concern,” concludes David Watt. See PrisonPlanet_via_Tom Nelson.

Natural climate variation is driven by multiple overlapping solar cycles, by the ocean multidecadal oscillations, by volcanic activity, by chaotic biological cycles on land and in the sea, all influencing and being influenced by ice and snow cover. None of these factors are well understood. Yet the wholly warmer climate orthodoxy claims to be able to simplify climate to one parameter: anthropogenic greenhouse gases! These high priests of the orthodoxy exhibit a sad combination of laziness and arrogance.
They are like the lazy and incompetent physician who jumps at the first diagnosis that enters his mind, and refuses to consider any other factors. But having jumped onto the political and media bandwagon of climate doom, these alarmist orthodoxers have set their course, regardless of how the reality may develop. See blog here.
Sep 12, 2008
Atlantic Basin Hurricane Counts Related Significantly to Solar Activity
By Paul Biggs, Climate Realist Blogspot
There is a new GRL paper in press by Elsner and Jagger entitled: ‘United States and Caribbean tropical cyclone activity related to the solar cycle.’
The Abstract states:
The authors report on a finding that annual U.S hurricane counts are significantly related to solar activity. The relationship results from fewer intense tropical cyclones over the Caribbean and Gulf of Mexico when sunspot numbers are high. The finding is in accord with the heat-engine theory of hurricanes that predicts a reduction in the maximum potential intensity with a warming in the layer near the top of the hurricane. An active sun warms the lower stratosphere and upper troposphere through ozone absorption of additional ultraviolet (UV) radiation. Since the dissipation of the hurricane’s energy occurs through ocean mixing and atmospheric transport, tropical cyclones can act to amplify the effect of relatively small changes in the sun’s output thereby appreciably altering the climate. Results have implications for life and property throughout the Caribbean, Mexico, and portions of the United States.
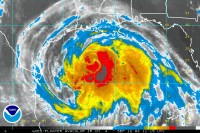
Hurricane Ike. See larger image here
Icecap Note: This same factor could well be a contributing factor in last winter’s record snows and the unusual number of thunderstorm and tornadoes and the heavy rains of the spring. A cooling upper atmosphere makes the atmosphere more unstable and aids convection. Also interestingly, Hurricane Ike is occurring 108 years after the great Galveston Hurricane at the start of the last quiet solar period associated with the ~106 year cycle. 1901 had two zero sunspot months. August by some observatories was a zero sunspot month. Maybe just coincidence but then again.
Sep 09, 2008
OPINION: Man-made global warming? Worry about the sun
By Nigel Calder in Belfast Today
Last week Environment Minister Sammy WIlson caused anger among some environmentalists by questioning whether global warming was caused by man. The Green Party has already hit back - now NIGEL CALDER, former editor of the New Scientist defends Mr Wilson’s position.
There are warnings of gales in Shannon, Rockall, Malin. When shipping forecasts like that occur repeatedly in summertime, you have to wonder if the global cooling feared by the best-informed climate experts has already begun to bite. The UK’s rotten summer weather of 2007 and 2008 is a good reason to reopen the debate about global warming, as Northern Ireland’s Environment Minister Sammy Wilson proposes.
Unseasonable storms plagued the Spanish Armada too. After the fights in the English Channel, it escaped homeward around Scotland and Ireland. But high winds, in the late summer of 1588, wrecked two dozen ships on the north and west coasts of Ireland. As Queen Elizabeth’s Armada medal put it ‘God blew and they were scattered’.
Why is that 420-year-old weather bulletin relevant today? Because a worldwide cooling event, the Little Ice Age, was just then becoming serious. A local symptom was summer storms tracking across the British Isles, rather than passing to the north as in warmer medieval times. The gloomy and wet weather brought misery to farmers, and between 1550 and 1600 the price of wheat in England went up by 200 per cent. With occasional intermissions, and a maximum chill around 1700, the Little Ice Age continued until about 1850.
A lazy sun explains it. The solar magnetic shield was weak, and the Earth suffered a larger influx of swift atomic particles coming from exploded stars.
Those cosmic rays helped to make more low clouds, which cooled the world during the Little Ice Age. But in the 20th century the sun doubled its magnetic strength and cut the influx of cosmic rays. That meant fewer clouds and a warmer world.
This is no crackpot theory. A string of discoveries by the physicist Henrik Svensmark at the Danish National Space Institute backs it up. He and his small team have even traced the chemical action of cosmic rays involved in cloud-making. Evidence for the cosmic-ray theory is now far stronger than for the politically fashionable notion that carbon dioxide drives global warming. Dr Svensmark and I explain it all in plain language in our book The Chilling Stars, published by Icon Books in 2007.
So what’s the problem? Precisely the lack of debate that Mr Wilson complains about. A group of scientists who make fanciful computer models of the climate for the United Nations have allied themselves with politicians in many Western countries, with environmental lobbyists, and with journalists who have forgotten to take official pronouncements with plenty of salt. The science of man-made global warming is settled, they chorus, and there’s nothing to discuss except how to avoid the climatic apocalypse. Read more here.

See also this Anthony Watts story on the SIDC debacle on the August sunspot number.
Sep 09, 2008
Rare Late Winter Snowfall in Southern Brazil
Alexandre Aguiar, MetSul Weather Center
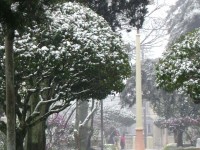
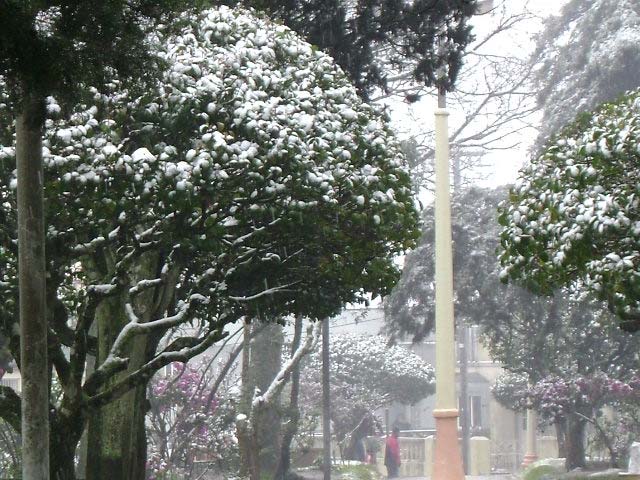
This day will go in our climatic history of the southernmost state of Rio Grande do Sul as one of the coldest ever witnessed in September. It was an amazing day. Temperatures below 5 degrees Celsius during afternoon hours are quite rare even in the coldest months of calendar from June to August, but today temperature dropped to 2 degrees in several cities after midday with the lows occurring during the afternoon. What began in the morning as granular snow and sleet quickly became moderate to heavy snow in the afternoon. The city of Pinheiro Machado (450 meters) never could expect to be whitened, despite the snow forecast from MetSul Weather Center, the only public or private weather institution in Brazil to warn on the snow.

See larger image here.
People could not believe the scenes of cars covered by ice and the fields whitened just after three days the region experienced a warm spell that brought highs over 30 degrees Celsius. MetSul surveyed 14 cities with observations of sleet, granular snow and snow. In the cities of Pinheiro Machado, Piratini and Canguçu the snow accumulated in the ground. Snow events in these areas are rare due to the lower altitudes compared to the mountains of 1.000 to 1.800 meters further north in Southern Brazil, but this time nature gifted the people of Southern Rio Grande do Sul. If snow is rare, to get accumulation is astonishing. It was the most impressive snow event in some areas since the 80’s. Pinheiro Machado was the city to get more snow in this historic day.
Snow mixed with rain was also observed in Northern Uruguay. In the southern areas of Rio Grande do Sul, temperature dropped in the afternoon to 2,5ºC in Bagé, 2,7ºC in Santana do Livramento, 2,2ºC in Canguçu and 3,1ºC em Caçapava do Sul. MetSul’s chief meteorologist Eugenio Hackbart notes that it was for sure one of the coldest ever recorded afternoons in September in a century. Hackbart explained that the synoptic pattern that favored this Friday snowfall in Rio Grande do Sul (Brazil) was very similar to the one that produced the first snow in Buenos Aires since 1918 last year. The region was covered by a very cold air mass and a low pressure system advanced from North Argentina, bringing rain that converted to snow under the influence of the frigid polar air.
Meteorologist Eugenio Hackbart, a long time declared skeptic on manmade global warming, observed that extreme cold or snowfall events tend to occur during winter with negative PDO, solar minimums and La Nina. The most important snow events in Southern Brazil during the last 50 years, according to him, occurred at or around the 11-year cycle solar minimum. “Of course, it snow in year of heightened solar activity and El Nino, but history tells the most impressive episodes took place in winters either with La Nina or negative PDO in the Pacific or during periods of lowered solar activity”, he says. MetSul’s meteorologist also notes that the return of the colder winters and the major snow events to the area of the Southern Cone of South America may be the result of the ongoing cooling trends observed in the planet this decade. “This is no coincidence”, he says.
See larger image here. See full story and many more photos here.
Sep 09, 2008
Dispelling Delusions: Human-Caused Climate Change and Carbon “Pollution” Mythology
By Dr G LeBlanc Smith, PhD, AIG, AAPG
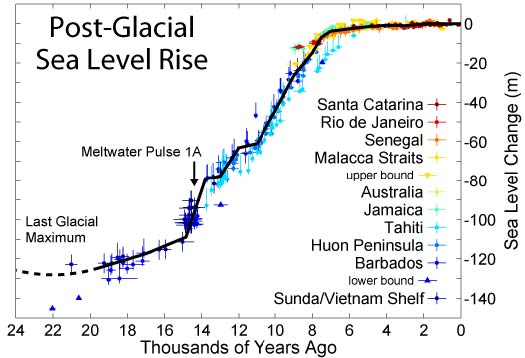
As a retired CSIRO Principal Research Scientist (geosciences - sedimentology), I make this observation and comment on Minister Wong’s statement, (and Professor Garnaut’s commentary): “Climate change threatens icons like the Great Barrier Reef, the Kakadu wetlands and the multi billion dollar tourism industries they support.” Knowing and understanding the past is a vital key to the future, and earth scientists can present much of this information in a context that can assist in exposing the truth and misrepresentations of the current “Climate Change” debate. It is fact that the vast bulk of the Great Barrier Reef area was exposed land and above sea level, prior to 10,000 years ago, when sea levels were over 70m lower than present. There was no great coral reef there until recently, and Kakadu was probably not a swampy wetland then either.
I suggest that statements from Ms Wong and Professor Garnaut should be challenged for veracity by all responsible Government advisors and the CSIRO at the very least, and by any observant scientist to test their logic against evidence.
The evidence can be seen from the history of sea level variations mapped as a time-curve derived from joining dots of observed and dated sea levels that track the natural melt-out of the last glaciation ice sheets. Sea level has risen about 130m in the 10,000 years between 17,000 and 7,000 years ago; with a maximum observed level ~8m above present sea level in marine deposits dated ~ 6000 years old in perched Antarctic lakes. It has subsequently fallen in steps as the planet has cooled to our present level. This is in the published science literature and much can be readily “Googled”.
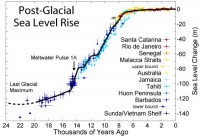
See larger image here
More solid facts from the past: It is established fact that the ice core data from both Greenland and Antarctica show information that carbon dioxide variation lags behind temperature variation, throughout the nearly half a million year record contained in the ice cores.
In summary, I have yet to see credible proof of carbon dioxide driving climate change, yet alone man-made CO2 driving it. The atmospheric hot-spot is missing and the ice core data refute this. When will we collectively awake from this deceptive delusion? I contend that those professional scientists and advisors that are knowingly complicit in climate science fraud and all that is derived from it, will continue to be exposed by the science itself. There is no atmospheric hot-spot from “greenhouse CO2” despite over 20 years of serious looking for it (read Dr Evans and Dr Spencer’s recent media and US Senate evidence statements). Occam’s razor would point to the sun as the driver of climate change of significance. Human generated carbon dioxide is arguably around 3% of the total carbon dioxide budget, and in the light of the above, we are effectively irrelevant to the natural climate change continuum.
Read more here.
|
|
|
|

