Sep 03, 2008
Big Chill a Symptom of Climate Chaos
Sydney Herald
Forget global warming - the latest problem is global cooling. (see other story here on Australia’s cool August).
Conservation group WWF has blamed climate change for the coldest August in Sydney for more than 60 years (64 years since 1944).

The freezing temperatures are proof of the urgent need to cut carbon pollution, according to WWF development and sustainability program manager Paul Toni. “We can expect more extremes in climate,” Mr Toni said. He said climate records had tumbled over the past year. Australia had its driest May on record, Perth had its wettest April on record, and Tasmania recorded its hottest ever temperature, according to Mr Toni.
He said climate extremes were affecting southern Australia in particular. “This is consistent with climate modelling showing the southern states will feel the effects of climate change most severely,” he said. Mr Toni said if action was not taken, more volatile weather would be on the radar.

See the story here.
See here where Adelaide also has recorded its coldest August in more than 35 years. The city had an average temperature of 14.8C for the last month of winter. That compared with a usual average of 16.6C for August. Bureau of Meteorology senior forecaster Allan Beattie said the previous record for a cold August was in 1970 when the average temperature was 14.4C. But the coldest August was in 1951 when the average temperature was 14.1C. Adelaide’s winter this year also had a below-average temperature of 15.5C, compared with the usual average of 16C. Last month was also wetter than usual for August. Adelaide received 85mm of rain compared with an average of 66.5mm, the wettest August since 2005. More climate chaos at work. Seems to me we used to call that a cold winter.
Aug 31, 2008
Michaels: Record Low for Climate Science
By Pat Michaels, Washington Times
Ever since Soviet and Western climate scientists published the first international compendium on global warming, back in 1985, we have known that scaring people to death is very good for the environmentalist business. Such documents appear once or twice a year under the aegis of sundry governmental and international agencies, such as the United States’ Climate Change Science Program (CCSP). Remember that acronym, CCSP. If its latest “Synthesis Report” on climate change sees the light of day, we may one day thank CCSP for policies that drive America into the poor house.
The sum of my analysis: This is the worst document in this genre I have ever seen. Virtually every sentence can be contested or simply ignores published science that disagrees with CCSP’s preconceived message. In its own words: “Aggressive near-term actions would be required to alter the future path of human-induced warming… future generations will inherit the legacy of our decisions.” If “future generations” and “legacy of our decisions” sound more to you like politics rather than science, you’re correct. The CCSP report isn’t a science document at all. Not unless global warming science is a virtually one-sided world where almost everything is bad and getting worse, and where a moderate response dishonors our progenitors.
Of course, this can’t be. Global warming lengthens growing seasons. Carbon dioxide, the cause of (part of the) warming (dormant for 11 years now) clearly improves crop yields in a world where stupid global warming policies (like burning our food supply in cars) are increasing food scarcity. If they have the money, by and large, Americans move to a warmer climate. And so on - which is why the CCSP document and the delete key should become intimate friends. How did such a remarkable distortion see the light day? The “product lead” is Tom Karl, who heads the Commerce Department’s National Climatic Data Center in Asheville, N.C. He is perhaps the most political and politically savvy climate scientist in U.S. history. When Al Gore was vice president, he would issue monthly briefings on the horrors of climate change. When Mr. Gore exaggerated some local flood, or claimed Florida would burn because of global warming, Mr. Karl stood by and remained mute. But now, with the prospect of an increasingly Democratic Senate, and a president who will go along with the madness of climatically futile policies (Barack Obama or John McCain on global warming? Pick em!), Mr. Karl and CCSP have picked up the scent.
From a policy viewpoint, it’s even worse. The current administration has punted to the next president the question of what rules EPA should make about global warming. All the levers of political power - the presidency, Congress and the relevant agencies - are therefore all pointed in the same direction. All will cite the CCSP as their bible, and anyone who voices a more factual opinion will in fact be marginalized as insane. Want more evidence as to the perfidy of the CCSP process? The senior editor is no climate scientist; it’s Susan J. Hassol, who wrote the HBO global warming “documentary,” “Too Hot Not to Handle.” Laurie David, the force behind Al Gore’s “An Inconvenient Truth,” was the executive producer. This isn’t science, it’s science fiction.
There’s a wonderful picture on Page 55 of two senior citizens, captioned: “The elderly are especially vulnerable to extreme heat.” If that’s true, then there must be massive and increasing numbers of heat-related fatalities in hot cities with old populations. In fact, Tampa and Phoenix have a disproportionately elderly population and very few heat-related deaths; statistically, Tampa has the fewest of any major U.S. city. It may shock the CCSP, but when heat waves become more frequent, people change their habits and localities adapt their infrastructure to better deal with the heat. Trash the entire report. It’s neither scientific nor logical. It’s a political document. Send the product lead back to Asheville and the senior editor back to Hollywood.
But of course, that won’t happen. Instead, the CCSP report and its production team will be lionized. It will serve as the basis for the most onerous environmental legislation and regulations in U.S. history. And when historians look back at a nation made poorer by foolish policies (which themselves will have no effect on warming), they will wonder how climate science could have gone so far into the wilderness of politics. Read full opinion with which every real scientist I know would agree with here.
Aug 30, 2008
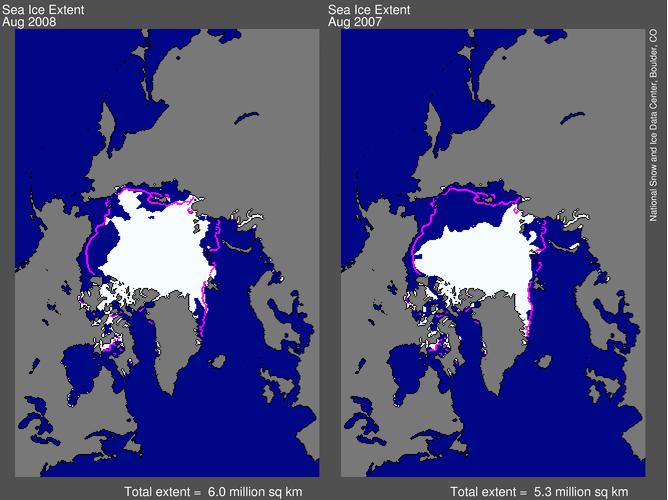
Arctic Sees Massive Gain in Ice Coverage
By Michael Asher, Daily Tech
Data from the National Snow and Ice Data Center (NSIDC) has indicated a dramatic increase in sea ice extent in the Arctic regions. The growth over the past year covers an area of 700,000 square kilometers: an amount twice the size the nation of Germany. With the Arctic melting season over for 2008, ice cover will continue to increase until melting begins anew next spring.

See larger image here
The data is for August 2008 and indicates a total sea ice area of six million square kilometers. Ice extent for the same month in 2007 covered 5.3 million square kilometers, a historic low. Earlier this year, media accounts were rife with predictions that this year would again see a new record. Instead, the Arctic has seen a gain of about thirteen percent.
William Chapman, a researcher with the Arctic Climate Research Center at the University of Illinois, tells DailyTech that this year the Arctic was “definitely colder” than 2007. Chapman also says part of the reason for the large ice loss in 2007 was strong winds from Siberia, which affect both ice formation and drift, forcing ice into warmer waters where it melts.
Earlier predictions were also wrong because researchers thought thinner ice would melt faster in subsequent years. Instead, according to the NSIDC, the new ice had less snow coverage to insulate it from the bitterly cold air, resulting in a faster rate of ice growth.
Most concern has focused on the Arctic regions, rather than Antarctica. Recent research has indicated Antarctica is on a long-term cooling trend, for reasons which remain unclear. Earlier this year, concerns over global warming led the US to officially list the polar bear a threatened species, over objections from experts who claimed the animal’s numbers were increasing. Read more here.
Aug 28, 2008
Is Earth Still Recovering from the “Little Ice Age?”
By Syun-Ichi Akasofu, International Arctic Research Center
An almost linear global temperature increase of about 0.5C/100 years (~1F/100 years) seems to have started at least one hundred years before 1946, when manmade CO2 in the atmosphere began to increase rapidly. This value of 0.5C/100 years may be compared with what the International Panel on Climate Change (IPCC) scientists consider to be the manmade greenhouse effect of 0.6C/100 years. This 100-year long linear warming trend is likely to be a natural change.
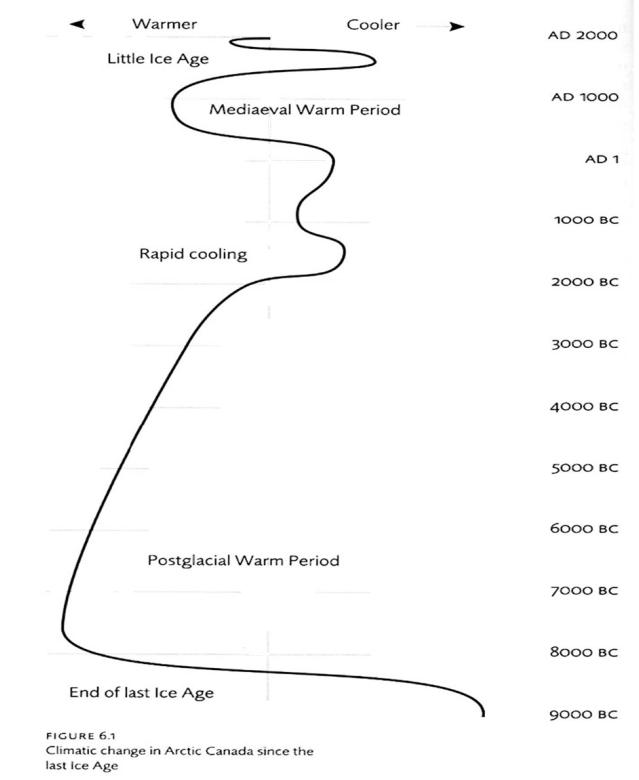
One possible cause of the linear increase may be Earth’s continuing recovery from the Little Ice Age (1400-1800). This trend (0.5C/100 years) should be subtracted from the temperature data during the last 100 years when estimating the manmade contribution to the present global warming trend. As a result, there is a possibility that only a small fraction of the present warming trend is attributable to the greenhouse effect resulting from human activities. Note that both glaciers and sea ice in the Arctic Ocean that had developed during the Little Ice Age began to recede after 1800 and are still receding; their recession is not a recent phenomenon. One lesson here is that it is not possible to study climate change without long-term data. In fact, one way to learn about natural changes is to examine climate change before the greenhouse effect of CO2 became significant in about 1946.
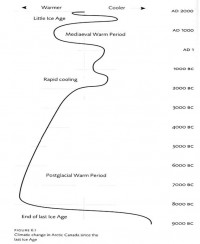
Climate change in arctic Canada after the last major ice age (McGhee, 1941). Larger image here.
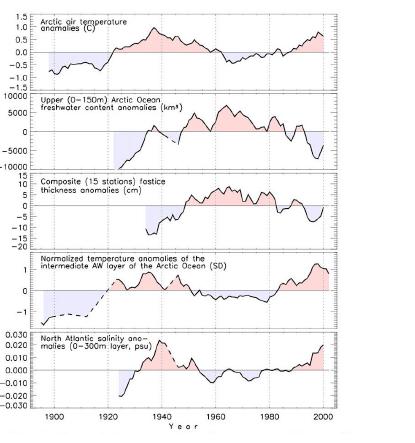
The present rapid retreat of sea ice in the Arctic Ocean, particularly in 2007, is caused by the inflow of the warm North Atlantic water into the Arctic Ocean and the effects of winds. Figure below shows the results of the ocean monitoring effort by an international group, led by the International Arctic Research Center.
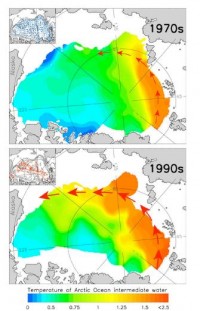
Inflow of warm North Atlantic water into the Arctic Ocean (Polyakov, 2006). Larger image here.
This warm water is melting sea ice from the bottom. The resulting thin ice tends to break up easily by stormy water and is easily forced to flow by winds; nothing can move sea ice (which covers an area of the United States) in the Arctic Ocean, if it is a single plate. This was exactly what happened in the fall of 2007, resulting in a large recession of sea ice toward the Canadian side (some expected further shrinking in 2008, but that is unlikely). It was shown by Polyakov (2006) that this inflow is a quasi-periodic phenomenon.

Air temperature and various conditions of the Arctic Ocean between 1895 and 2000 (Polyakov et al., 2008). Larger image here.
The Earth as a whole experienced a relatively cold period, the Little Ice Age (LIA), between 1400 and 1800. The Earth is still recovering from the LIA. There is nothing unusual or abnormal about the present global warming trend and temperature. There were a number of periods when the temperature was higher than the present.The predicted temperature in 2100 by the IPCC is not reliable, because the present GCMs are adjusted or “tuned” to result in the 0.6C/100 years increase by hypothesizing the CO2 effect. Read this very detailed note here.
Aug 26, 2008
Snowpack Study Shows No Long-Term Climate Change Signal
By Phyllis Fletcher, KUOW News
A new study from the University of Washington indicates that climate change may not be the reason snowpack is shrinking in the Cascade Mountains. The finding is in contrast with science and policy that have dominated the discussion of snowpack, flood, and water resources.
The new study is authored by several atmospheric scientists, including KUOW regular Cliff Mass. Mass says the amount of snowpack has not changed appreciably in the last 30 years. He and his colleagues argue that much of the change in the last century could be attributed to a weather pattern that has nothing to do with global warming caused by human activity.
It’s a conundrum for policymakers. And for everyone else who’s not a scientist. Alan Hamlet is a research hydrologist at the University of Washington. He says lawmakers want to hear from scientists before they decide what to do. Hamlet said: “And this whole debate that has been going on about the snowpack was really spawned by a number of policy people citing numbers like a 50% downward trend in snowpack (based on Mote 2005 BAMS) Which some people felt was overstated, and really they were worried about the policy kind of going too far in the other direction.”
Hamlet’s opinion is that the most recent paper may overstate the case against global warming as a cause for snowpack shrinking in the cascades. He says this kind of disagreement is hard for people who want to regulate water supply and carbon emissions. But it’s not so hard for people like him and Cliff Mass. According to Hamlet, “These kinds of debates are normal in the scientific community. And I think there’s a lot of consensus here too. So we’re wrangling back and forth and I think over time a clearer picture will emerge.” Ten years ago it was easy to find scientific reports with confident claims that linked a shrinking snowpack in the northwest to global warming. You could even find policy recommendations in some of them. Today the discussion is more nuanced, and scientists try to keep policy out of their papers. The latest study from U.W. scientists awaits peer review.
See recent story by George Taylor here and earlier story on Mote’s paper here. It will be interesting to see if the AMS which quickly accepted Mote’s paper for publication because it fit their AGW advocacy position will accept the Mass etal submission to the Journal of Climate. Dr. Mass is highly regarded in the AMS which will help the cause.
|

