
|
Apr 03, 2008
Dust Plays a Role In Climate Change
By Robert C. Cowen , Christian Science Monitor
Scientists know that dust affects climate. Tiny particles create veils that reflect sunlight and cool the atmosphere. Dark particles absorb sunshine and warm things up. But as scientists look deeper into the dust-climate connection, they find that they have underestimated its importance. Research published April 3 in Nature reveals the tight linkage between atmospheric dust flows and Antarctic temperatures during ice ages over the past 800,000 years. A research review published March 23 in Nature Geoscience online shows that black carbon particles in the atmosphere have a more powerful global-warming effect than any of the greenhouse gases except carbon dioxide. And these particles are 60 percent as effective as CO2 itself. That’s far more powerful than the estimate in last year’s report of the UN-sponsored Intergovernmental Panel on Climate Change (IPCC).
The good news is that black carbon particles such as diesel soot or wood-stove smoke only stay airborne for weeks. (It takes a century to get rid of today’s CO2 emissions.)(Icecap Note: Not true: Lifetime of CO2 is more like 5-7 years) This fact offers an opportunity for instant payback, say study authors V. Ramanathan at Scripps Institution of Oceanography in San Diego and Gregory Carmichael at the University of Iowa in Iowa City. In an announcement from Scripps, the authors note that commercially available technologies exist to cut back soot emissions substantially. Using them would rapidly reduce black-carbon warming.
Meanwhile, Fabrice Lambert at the University of Bern in Switzerland and colleagues are taking advantage of an unbroken 800,000-year climate record in an Antarctic ice core to track dust flows into the region. They find what they call “a significant correlation” between dust coming into the region and Antarctic cooling. They suggest that the 25-fold increase in dust inflow they see during glacial times relates to stronger South American dust sources. Also, less rainfall during those times allows dust to stay airborne longer than when more abundant rain washed it out. It’s what the research team calls “a progressive coupling of the climates of Antarctic and lower latitudes” during glacial times. Read More here.
Mar 31, 2008
The Two Theories of Climate Change
By Jim Clarke, Clarke’s Climate
The amount of money flowing into the study of man-made climate change has multiplied time and again over the years, solely because man-made climate change has been perceived as a crisis. The study of natural climate change, on the other hand, has not enjoyed a similar windfall. In fact, those insisting that natural climate variability is still dominant have had a very difficult time getting funding at all. Natural climate change is not considered a problem requiring a solution, so governments are not interested. Meanwhile, the scientific community has been downright hostile to those arguing against the AGW theory, for they threaten to kill the goose that is laying the golden eggs.
The AGW theory is based on human knowledge of every process of the sun-earth-atmosphere system. It attempts to create a mathematical calculation for everything that happens in this system and then calculate how all of those different equations interact with each other when set into motion, creating what are called ‘feedbacks’. There are two major problems with this technique: we do not understand everything that is happening (by a long shot), and the feedbacks are not always products of the equations, but are based on assumptions that govern the equations. In other words, the supposed crisis is based on positive (warming) feedbacks and the positive feedbacks are based on assumptions. There is little evidence that these positive feedbacks actually exist in nature and growing evidence that negative (cooling) feedbacks begin to dominate in a warming world.
The NGW theory recognizes that humans are playing a role in climate change and the increasing CO2, all else being equal, will tend to warm the atmosphere. In the NGW theory, however, the amount of warming is not expected to be any greater than the ‘direct’ warming produced by a doubling of CO2, which is probably close to 0.6 degrees centigrade. In other words, there are no assumptions about huge positive feedbacks in the NGW theory. Also, the NGW theory includes processes for which there is a large amount of physical evidence, but no well defined mathematical equations to describe what is happening. The reason is that we do not know exactly what is happening in the depths of the oceans, in clouds, the sun and with cosmic rays. What we do know is that all of these things have an affect on global climate change. For example, we do not know why the Pacific Decadal Oscillation (PDO) shifts every 30 years or so, but we do know that each phase has a significant impact on the number of El Nino’s that occur, and El Nino’s have a significant impact on global climate. These facts are ignored in the AGW theory for reasons I do not quite understand.
The bottom line is that the AGW theory ignores real world evidence in favor of incomplete equations and unsupportable assumptions. One the other hand, the NGW theory weighs all evidence and tries to avoid assumptions about processes; well aware that there are physical processes occurring which we do not yet understand and for which we can not write equations. Instead, the affect of these processes is determined by the available, real world evidence. Read more here.
Mar 28, 2008
Increased Knowledge About Global Warming Leads To Apathy, Study Shows
ScienceDaily
The more you know the less you care—at least that seems to be the case with global warming. A telephone survey of 1,093 Americans by two Texas A&M University political scientists and a former colleague indicates that trend, as explained in their recent article in the peer-reviewed journal Risk Analysis.
“More informed respondents both feel less personally responsible for global warming, and also show less concern for global warming,” states the article, titled “Personal Efficacy, the Information Environment, and Attitudes toward Global Warming and Climate Change in the USA.”
The study showed high levels of confidence in scientists among Americans led to a decreased sense of responsibility for global warming. The diminished concern and sense of responsibility flies in the face of awareness campaigns about climate change, such as in the movies An Inconvenient Truth and Ice Age: The Meltdown and in the mainstream media’s escalating emphasis on the trend.
Kellstedt says the findings were a bit unexpected. The focus of the study, he says, was not to measure how informed or how uninformed Americans are about global warming, but to understand why some individuals who are more or less informed about it showed more or less concern. “In that sense, we didn’t really have expectations about how aware or unaware people were of global warming,” he says. But, he adds, “The findings that the more informed respondents were less concerned about global warming, and that they felt less personally responsible for it, did surprise us. We expected just the opposite.”
Read more here.
Icecap Note: This is why the alarmists and their cheerleaders in the media try to paint the issue as settled and suppress alternative information. The public is too smart.
Mar 28, 2008
Sorry Media and Alarmist Websites: Antarctica Ain’t Cooperating
By World Climate Report
Literally thousands of websites on global warming claim that the icecaps are melting at an unprecedented rate due to emissions of greenhouse gases (particularly from the United States), and in case you cannot picture what that looks like, the sites feature an endless number of pictures of blocks of ice floating away from Antarctica (the really effective pictures have a few penguins floating away as well). National Geographic magazine featured a cover story entitled “The Big Thaw,” and based on what you would see in that issue, you would think there is absolutely no debate about rapid and undesirable changes occurring in Antarctica all due to the dreaded global warming phenomenon. As we have shown over and over, nothing could be further from the truth!
When discussing changes (or the lack thereof) in Antarctica, the United Nations Intergovernmental Panel on Climate Change (IPCC) most clearly states in their 2007 summary report “Antarctic sea ice extent continues to show inter-annual variability and localized changes but no statistically significant average trends, consistent with the lack of warming reflected in atmospheric temperatures averaged across the region.” Furthermore, IPCC just as clearly states “Current global model studies project that the Antarctic ice sheet will remain too cold for widespread surface melting and is expected to gain in mass due to increased snowfall.” It would take anyone with internet access no more than a few seconds to download the summary from the IPCC website, but once again, the facts are too inconvenient regarding what is reportedly happening in Antarctica according to the greenhouse advocates.
Another major article on temperature trends in the Antarctic has appeared in a recent issue of the Journal of Geophysical Research by a team of scientists from Ohio State University, the University of Illinois, and the Goddard Space Flight Center; the research was funded by the National Science Foundation Office of Polar Programs Glaciology Program. Monaghan et al. begin their lengthy (21 pages - quite long for geophysics) article noting that a previous research team studying Antarctica examined “station temperature records for the past 50 years and report statistically insignificant temperature fluctuations over continental Antarctica excluding the Antarctic Peninsula, with the exception of Amundsen-Scott South Pole Station, which cooled by -0.17 K decade-1 for 1958–2000.” That is correct [ despite all you have heard elsewhere on the subject, the South Pole has been cooling over the past half century. The previous research team also reported that any warming in Antarctica has slowed and the cooling has accelerated in the more recent three decades.
Literally hundreds of articles could appear tomorrow re-confirming their results, the IPCC could continue to report emphatically that Antarctica is not warming (and may well be cooling), and somehow, this will all translate into claims that “Antarctica is warming and melting.” The truth from Antarctica is hard for the greenhouse crusade to accept (although certainly they try hard to fit it in), and in the long run, the truth from Antarctica might melt away the flimsy, well-publicized claims about global climate change-especially the concerns of a rapid sea level rise.
Mar 25, 2008
The IPCC: On the Run at Last
By OnTheWeb: Bob Carter
UN climate body is in panic mode as satellite temperatures turn down and a hard winter lashes both hemispheres.
Recently, in their Fourth Assessment Report (4AR), and faced with their failure to convince the public that the sky is falling, the IPCC delivers even more preposterous advice in ever shriller tones, saying that “Most of the observed increase in global average temperatures since the mid-20th century is very likely (>90% probable) due to the observed increase in anthropogenic greenhouse gas concentrations”. The press, most of whom have firmly identified with the alarmist cause, continues to appease the Green gods by faithfully running IPCC’s now unrealistic scientific propaganda, thereby stoking public alarm; the science is a done deal, they say, and the time has come to stop talking. According to UK journalist, Geoffrey Lean, all that is lacking to solve the global warming “crisis” is political will from governments.
“Global warming theory indicates that temperature rise due to increasing carbon dioxide emissions should be most prominent at heights of 5-10 km in the lower atmosphere; instead, more warming is occurring at the surface. For the lower atmosphere, the satellite data indicate that, since the 1998 El Nino when temperatures spiked 10C due to a rise in water vapour emissions (the principal “greenhouse gas"), global temperatures dropped sharply, then stabilized and now show signs of continuing down - is global cooling next? (data courtesy of Professors John Christy and Roy Spencer, University of Alabama, Huntsville; a best-fitted spline curve represents longer term temperature trends).”
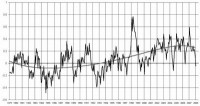
See larger image here
That there is a mismatch between model prediction and 2007 climate reality is again unsurprising. For as IPCC senior scientist Kevin Trenberth noted recently: “there are no (climate) predictions by IPCC at all. And there never have been”; instead there are only “what if"projections of future climate that correspond to certain emissions scenarios. Trenberth continues, “None of the models used by IPCC is initialized to the observed state and none of the climate states in the models corresponds even remotely to the current observed climate”.
For the last three years, satellite-measured average global temperature has been declining. Given the occurrence also of record low winter temperatures and massive snowfalls across both hemispheres this year, IPCC members have now entered panic mode, the whites of their eyes being clearly visible as they seek to defend their now unsustainable hypothesis of dangerous, human-caused global warming. Read more here.
|
|
|
|

