Apr 18, 2022
Met Office Changed Global Temperatures to Add 14% to Warming
Chris Morrison
Enlarged
Satellite data show that global warming started to run out of steam two decades ago, but the U.K. Met Office’s record of surface temperature from 1975 was boosted by 14% at the end of 2020. At the same time, the period between 1880-1975 was cooled. The move accentuates the rise in the global temperature recorded in the 1980s and 1990s that forms the basis of much of the current hysteria about the so-called climate emergency.
The disclosure of the apparent warming and cooling is contained in the latest State of the Climate report from Emeritus Professor Ole Humlum of the University of Oslo, and published by the Global Warming Policy Foundation. Professor Humlum says the post-1975 warming is about +0.1C and the pre-1975 cooling about -0.1C. The version-change to the fifth HadCRUT Met Office database “conveys the impression of a somewhat more rapid global temperature increase following the relatively cold period terminating around 1975”. When the Met Office first announced the change in December 2020, it admitted to 0.16C extra warming, although it didn’t give specifics about cooling and warming either side of the 1975 mark.
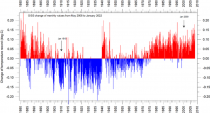
Professor Humlum also draws attention to significant retrospective changes in the American GISS surface temperature record. The graph below shows the effect of the changes made since May 2008 on the monthly temperature record, with increases in red and decreases in blue. As with HadCRUT, the changes warm the early part of the record, cool the period from 1900 to 1970, and heat up the later recordings.
Enlarged
Humlum notes that the changes in annual values are often quite substantial, ranging from about +0.15C to -0.15C. He goes on to note that the temperature difference between 1915 and 2000 increased from 0.45C to 0.67C. “This represents an increase of about 49% over this period, meaning that about half of the apparent global temperature increase from January 1910 to January 2000 is due to administrative adjustments to the original data made since May 2008” he writes.
Recent boosts to global temperatures databases are of course very helpful to activists in the media and politics keen to report ‘record’ warm years at a time when accurate satellite data reveal a pause of 88 months (and counting). In addition, work continues across a number of fronts to promote the climate emergency agenda, including extreme weather events.
Last week, the BBC reported that southern African storms were fuelled by climate change. According to the BBC, the results of a study from the World Weather Attribution group show that damage inflicted by storms in the region was exacerbated by global warming. According to the press release, the group used “computer simulations” to arrive at its findings. The BBC ran the scare story, without a byline, despite noting that “the precise contribution of climate change to the event could not be quantified, due to the absence of comprehensive historical records of rainfall in the region”.
In fact, attributing single episodes of bad weather to long-term changes in the climate is highly unscientific, since it is just an opinion. In 2014, Associate Professor Jennifer Fitchett from the University of the Witwatersrand published a paper in which she said she found “no statistically significant trends in the frequency of tropical cyclone landfalls over Madagascar and Mozambique over the past six decades”. Furthermore, much of the perceived changes in storm numbers could be attributed to recent improvements in storm detection methods.
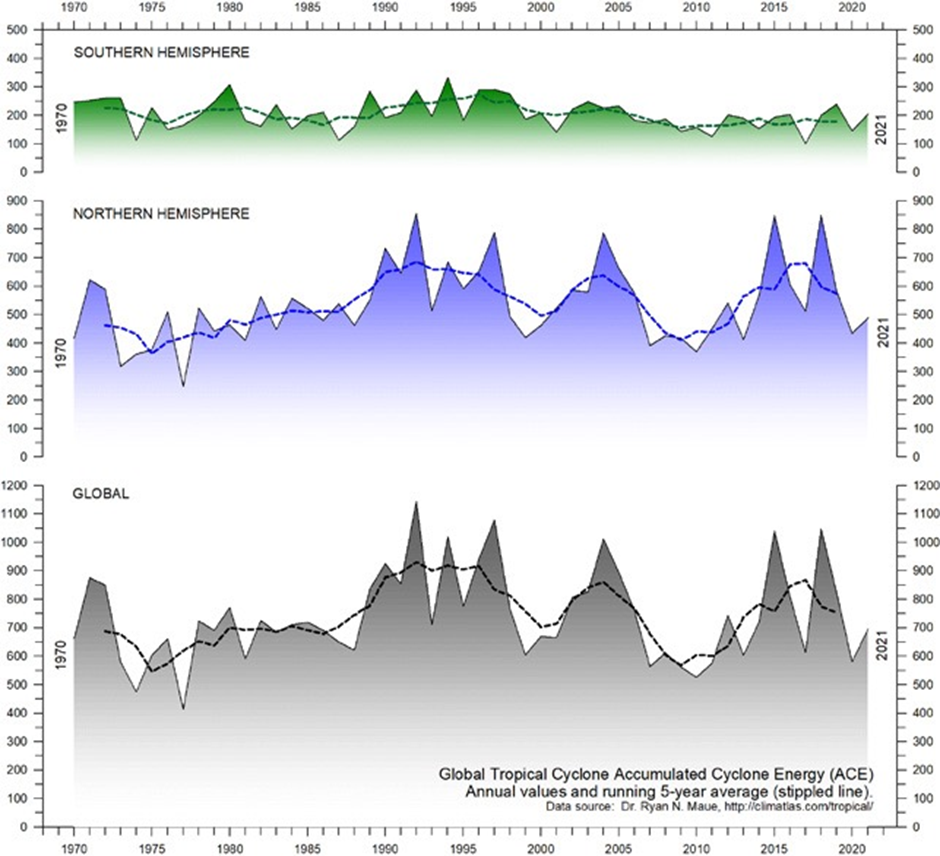
Professor Humlum’s excellent and measured climate report provides further context in which to evaluate the constant media scare stories about hurricane and cyclones.

Enlarged
The above graphs plot accumulated cyclone energy (ACE), as used by the U.S.-based National Oceanic and Atmospheric Administration (NOAA). Humlum notes that ACE gives a measure of the damage potential of an individual storm or a season. If climate change is affecting the southern hemisphere, and causing more severe problems in southern Africa, the trend does not yet appear to have shown up in the actual data. Overall, Humlum notes, “existing records do not suggest any abnormal cyclone activity in recent years”.
Another fashionable scare story is the loss of snow, particularly in the Alps, a favoured winter holiday destination of many Guardian, BBC and Extinction Rebellion supporters. In 2017, the Guardian reported that according to “experts” Alpine ski resorts could lose up to 70% of their snow cover by 2100. Last year, Justin Rowlatt reported on Panorama that snowy U.K. winters could become a thing of the past.
Enlarged
Back on Planet Reality, the thin blue lines above, show weekly northern hemisphere snow data, while the thicker blue line shows a 53 week average. There is practically no change going back 50 years
Humlum concluded: “A year ago, I warned that there was great risk in using computer modelling and immature science to make extraordinary claims. The empirical observations I have reviewed show very gentle warming and no evidence of a climate crisis.”
Chris Morrison is the Daily Sceptic’s Environment Editor
Apr 10, 2022
Don’t Look Up!
Paul Driessen
A real rock from outer space (not manmade climate change) is causing perceived rising seas
Paul Driessen, CFACT
In the Netflix movie, Washington politicians “Don’t Look Up” because they prefer to remain oblivious to a special effects meteor that’s about to obliterate Planet Earth. Not surprisingly, the film is really about our refusal to recognize the “existential threat” of “manmade climate change.”
Director Adam McKay recently tweeted, “We’ve got 6-8 years before the climate is so chaotic we [will] live in a permanent state of biblical catastrophe.”
Not to be outdone, UN Secretary General Antonio Guterres called the latest UN climate report “a file of shame, cataloguing the empty pledges that put us firmly on track toward an unlivable world.” Drilling for more oil and gas is “moral and economic madness,” he insisted. If humanity doesn’t stop using fossil fuels, we will be overwhelmed by devastating floods, heat waves, droughts, fires and crop failures.
Global sea levels have already risen “a shocking nine inches,” the PurpleOrange PR Agency proclaimed, promoting a client’s Climate Neutral Certified label, which is designed to channel more money to “authentic, immediate climate action.”
Back on the non-parallel-universe Planet Earth, a truly unlivable world would be one without fossil fuels. Not just to generate electricity, cook food, heat homes and water, and power cars, boats, trains and planes - but for fertilizers and insecticides to grow more food on less land, and for plastics, pharmaceuticals, paints, cosmetics, clothing and other essential products. For us today; for billions more tomorrow.
Fossil fuels to extract and process trillions of tons of raw materials, too, and manufacture the millions of wind turbines, billions of solar panels, billions of battery modules and millions of transmission line towers that would blanket our croplands, scenic areas and wildlife habitats if we didn’t have fossil fuels.
In fact, far worse than a warmer planet with more airborne plant-fertilizing carbon dioxide would be a colder planet with less CO2. That would mean less arable land, shorter growing seasons and much lower crop yields, on top of losses from a devastated Ukraine and sanctioned Russian wheat crops.
(Why is it that Twitter twits never cancel, suppress or even fact-check climate fear porn? Why is it never just climate change, but always climate cataclysms? Why always manmade climate change, as though past natural climate changes never happened? Why do Guterres, Gore, Kerry, Biden and AOC always have to top his, her, hir, ver, zir fellow alarmists in hysteria? Why is the fear-mongering always based on computer models, never on actual data and evidence? Why does it always ignore China’s massive fossil fuel use and greenhouse gas emissions?)
One of the prevalent climate alarm themes is sea level rise.
Back on real Earth, if the DC Swamp inhabitants of 35 million years ago had looked up, they’d have been transfixed in their last moments by a non-special-effects meteor hurtling into what is now Cape Charles, Virginia on the Chesapeake Bay. The 2-mile-wide meteor obliterated and pulverized sediments and bedrock, vaporized plants and animals, sent rock fragments hundreds of miles in every direction, and launched tsunamis into West Virginia’s eastern mountain slopes.
Shattered rock settled back into a crater 4,300 feet deep and 53 miles in diameter. Over the ensuing millennia, river and ocean sediments poured into the crater - and mile-high glaciers pulled 10-million cubic miles of water out of the oceans, burying half of North America, Europe and Asia under trillions of tons of ice. Land under the ice was pressed down, while land outside the glacial zones was lifted up. Then, some 12,000 years ago, the last Pleistocene glaciers began melting.
Oceans slowly rose - some 400 feet! Land masses underwent “isostatic rebound.” Areas that had been under the ice began rising; those that had bulged upward began sinking. In much of the Chesapeake Bay region, post-glacial subsidence is compounded by continued compression of pulverized crater rock - and by the ongoing withdrawal of groundwater from sedimentary aquifers beneath urban and agricultural areas that depend on groundwater.
The aquifers include layers of porous sandstone (with water between sand grains) interspersed among layers of impermeable but water-soaked shale and clay. As water is pumped out of the sandy layers, the shale-clay layers get squeezed by hundreds of feet of overlying rock and sediment, and their water is forced into the sandstones, and then into pumps. The overlying land steadily subsides.
In the Chesapeake Bay area, subsidence averages nearly 3 mm/year; 11.5 inches per century. That’s in addition to almost 4.5 inches per century in isostatic subsidence, plus 7 to 9 inches per century in actual sea level rise. The total perceived sea level rise can be 24 inches per century - although two-thirds of that total has nothing to do with actual sea level rise. Indeed, the Norfolk Naval Station tide gauge at Sewell’s Point shows that the rate of actual sea level rise has not changed since the gauge was installed in 1927.
The situation in Houston-Galveston, Texas, Santa Clara Valley, California, and other places around the globe is similarly complicated, even without post-glaciation issues. To single out actual sea level rise and blame the rise on humans and fossil fuels -is simply disingenuous.
However, salt-water intrusion and coastal flooding are serious, recurrent, growing problems, especially during hurricanes and as more expensive homes are built along coasts. Some communities have slowed subsidence by relocating groundwater pumping stations away from the coast, reducing withdrawal rates, increasing aquifer recharge, or substituting surface water for groundwater. Others have installed sea walls, improved drainage systems, and pipelines to bring water from nearby lakes and rivers. Other options include desalination plants to create more fresh water, recycling household “gray water” to agricultural use, and switching to less water-intensive irrigation methods, as Israel does.
These approaches are far more practical and cost-effective than trying to stop seas from rising any further, like a modern King Canute, by banning fossil fuels, especially if it’s done only in some Western nations.
Meanwhile, inhabitants of Tuvalu, the Maldives and other Pacific islands and coral atolls worry about rising seas due to fossil fuels. However, most of them are increasing in land area, not decreasing ‘ as corals grow, sediments are laid down off their coasts, and volcanic lava flows expand land masses.
Moreover, few of these islands and coral reefs even existed 12,000 years ago, when the Wisconsin Glaciation extracted 400 feet of seawater from the world’s oceans. The islands and atolls began growing as the seas rose. They’ve continued growing with every additional foot of sea level rise since the last Ice Age and the Little Ice Age (1350-1850) - and show no signs of stopping.
Cosquer Cave’s Paleolithic paintings near Marseille, France (the entrance is 115 feet below current sea level) and a Mel Fisher dive team’s discovery of charred tree branches and pine cones from a forest fire 8,400 years ago in 40 feet of water off the Florida coast further attest to steadily rising seas.
Yet, experts tell us. (1) “Snows are less frequent and less deep. The rivers scarcely ever freeze over now. There is an unfortunate fluctuation between heat and cold in the spring, which is very fatal to fruits.” (2) “We were astonished by the total absence of ice in Barrow Strait. I was here at this time [six years ago] still frozen up - and doubts were entertained as to the possibility of escape.” (3) “The Arctic Ocean is warming up, icebergs are growing scarcer, and in some places the seals are finding the water too hot.”
It behooves to take action. Or perhaps not. Quotation (1) is from Thomas Jefferson’s diary, 1799; (2) from Sir Francis McClintock’s ship’s log, 1860; (3) from a Washington Post article, November 2, 1922.
Instead of parroting scare stories - and demanding that fossil fuels be replaced by pseudo-clean, pseudo-renewable energy - it really behooves us to think, analyze, ponder the many ways fossil fuels improve our lives, and demand real evidence instead of GIGO computer models for any supposed climate crisis.
Paul Driessen is senior policy analyst for the Committee For A Constructive Tomorrow (www.CFACT.org), and author of Eco-Imperialism: Green power - Black death and articles on energy, climate and other issues.
Apr 04, 2022
From the archives - Pew Research Findings of what real scientists believed…
By Kenneth Richard, No Tricks Zone 2016
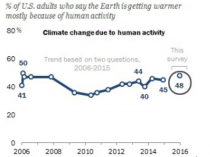
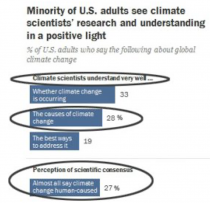
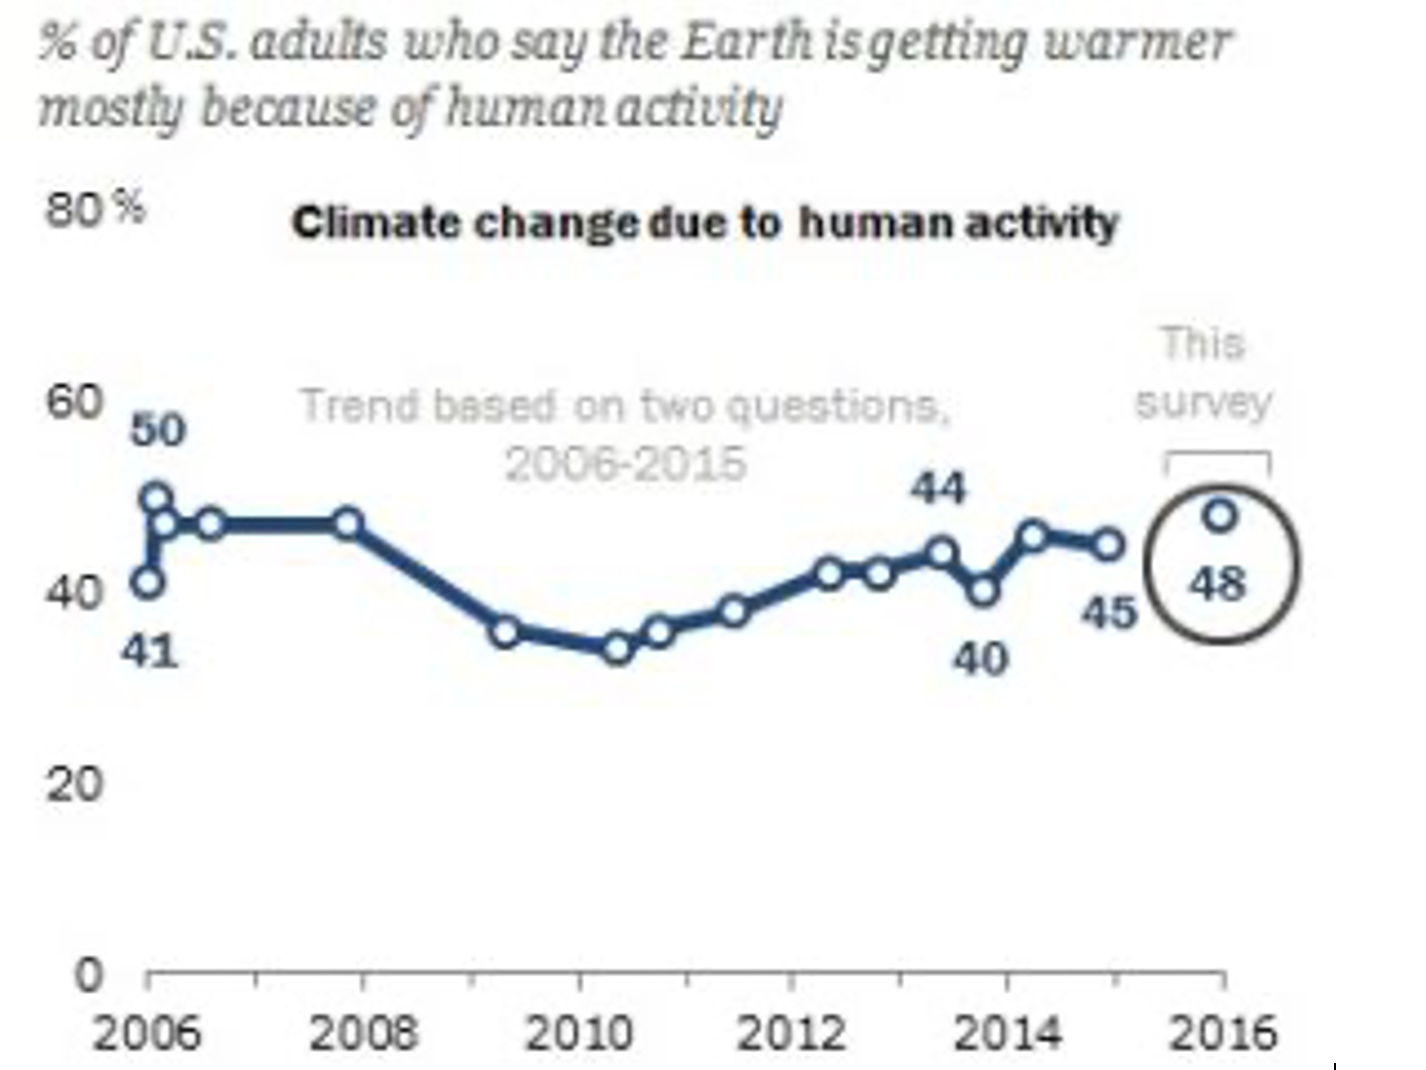
Americans’ beliefs about climate change were recently surveyed by the Pew Research Center, and the results were made public a few days ago. Pew pollsters found that a combined 51% of Americans agree that (a) there is no clear evidence the Earth is warming, or (b) natural factors are the main cause of climate changes. Therefore, just 48% of Americans believe the Earth is getting warmer, and this warming is mostly caused by humans. This belief percentage has essentially remained unchanged for the last 10 years, or since the survey was first conducted in 2006.
Enlarged
One key question in the survey pertained to American’ perception of the scientific “consensus”. The Pew Research Center found that just 27% of Americans believe that “almost all” climate scientists maintain the belief that changes in climate are mostly caused by humans.
Of course, the presupposition underpinning this opinion question is the claim that upwards of 97% climate scientists - translated into “almost all” for the Pew survey - believe that climate changes since the mid-20th century have been mostly (i.e., more than 50%) caused by humans. This oft-cited 97% figure was derived from a subjective abstract-counting exercise conducted by “SKeptical Science” blogger John Cook and colleagues (Cook et al., 2013, “Quantifying the Consensus..."). Selected abstracts from 11,944 scientific papers published between 1991 and 2011 were used for the sample size, and of those papers just 65 (0.5% of the 11,944) were classified by Cook and his fellow raters as endorsing the specified Category 1 position that “Explicitly states that humans are the primary cause of recent global warming” (Legates et al., 2013). This wouldn’t do, of course. So, to ultimately reach the 97% endorsement percentage the Cook team had set out to obtain in the first place, they intentionally combined the (65) Category 1 quantified “consensus” statement papers with the (934) Category 2 and (2,933) Category 3 endorsement papers that only needed to state (2) or just imply (3) that humans are a cause of climate changes. These Category 2 and 3 papers did not quantify the contribution or indicate humans are a primary (>50%) cause of climate change, but they were nonetheless combined with Category 1 papers anyway.
Of course, nearly all scientists would agree that a human contribution greater than 0% exists, or that humans can be a cause - however modest - of some degree of climate change. So by combining the very high endorsement rates from Categories 2 and 3 (that even most skeptics acknowledge, as they agree humans contribute to climate change to some degree) with the negligibly small endorsement rates for Category 1 (just 65 papers), and by excluding many hundreds of papers from consideration that were published by scientists questioning the theory, Cook et al. (2013) were ultimately able to get away with proclaiming that 97% of scientists believe that climate changes since 1950 have mostly been caused by humans.
But as the evidence from the Pew survey indicates, despite their best efforts, John Cook and cohorts have not been able to convince the general public that subjective abstract-counting exercises are a sound or scientific means to gauge “consensus.” As mentioned, only 27% of Americans believe that “almost all” (i.e., 97%) climate scientists maintain the belief that humans are the primary cause of changes in the climate system. Not only that, just 28% Americans agree that climate scientists even understand ("very well") what factors cause climate changes.
Enlarged
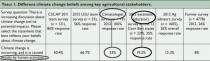
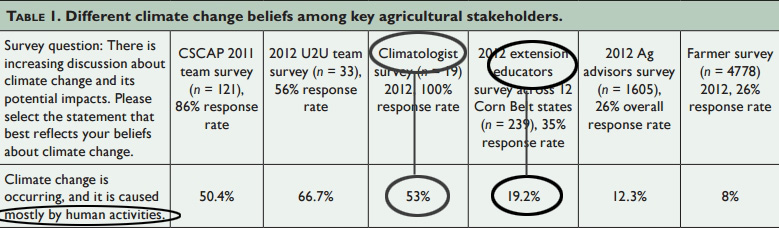
And Americans may be right. According to analysis found in the peer-reviewed scientific literature (Prokopy et al., 2015, Lefsrud and Meyer, 2012, Stenhouse et al., 2016), surveys of professional climatologists, engineers, geologists, and agronomists indicate that the percentage of these scientists who believe that changes in the climate system are primarily caused by humans falls abysmally short of the claimed 97%. In fact, these studies reveal that only 53% of climatologists and meteorologists, 36% of professional engineers and geoscientists, and 19% of agronomists believe that changes in the climate system are mostly human-caused.
53% Of Climatologists Believe, 19% Of Agronomists Believe
In a survey of Midwest-based climatologists and agronomists (here called “extension educators” who have “at least a Masters degree” in agronomic sciences), just 53% of climatologists and 19.2% of agronomists believe that changes in the climate system are primarily caused by humans.
Prokopy et al., 2015
“In 2012, a total of 22 state and extension climatologists were selected through a purposive sample to represent main outlets of publicly available and location-specific climate information in the region. About 53% attributed climate change primarily to human activities.”
“Extension educators are a unique set of agricultural advisors who serve to connect and translate research from universities to farmers in order to decrease risk to the farm enterprise and increase productive capacity and resilience. Typically, Extension educators have at least a Masters degree and are trained in agronomic sciences, which may not include climate sciences. [O]ver 19% attribut[e] climate change primarily to human activities.”
Enlarged
36% Of Engineers, Geoscientists Believe
Among professional engineers and geoscientists trained in the physical sciences, only 36% are believers in the “consensus” position that humans are the “main or central” cause of changes in the climate system.
Lefsrud and Meyer, 2012 ”The largest group of APEGA respondents (36%) ,,, express the strong belief that climate change is happening, that it is not a normal cycle of nature, and humans are the main or central cause.”
53% Of Professional Meteorologists Believe
Stenhouse et al., 2016
Conflict about Climate Change at the American Meteorological Society: Meteorologists’ Views on a Scientific and Organizational Controversy
“A web-based survey was sent to all professional (i.e. non-student) members of the AMS in December 2011. Members who said the global warming of the last 150 years was mostly caused by human activity (53% of full sample). Members who are convinced of largely human-caused climate change expressed that debate over global warming sends an unclear message to the public. Conversely, members who are unconvinced of human-caused climate change often felt that their peers were closed-minded, and were suppressing unpopular views.”
Ninety-Seven Percent Bunk
To summarize, the American public is about as likely to believe that climate changes are mostly caused by humans as are meteorologists and climatologists (48% vs. 53%, respectively). And Americans in general are much more likely to believe that humans are the primary cause of climate changes as professionals trained in the physical sciences: 48% of U.S. citizens are believers, whereas ~20-35% of professionals with physical science degrees (engineers, Earth scientists, agronomists) are believers.
To put it non-delicately, the claim that “almost all” scientists (i.e., 97%) believe that most changes in the climate system are caused by humans is… bunk.
And most Americans already knew that.
Mar 02, 2022
Increasing Cold Extremes Worldwide: Is Global Cooling on the way?
Madhav Khandekar, Ray Garnett
Note: Update from UAH on February global lower tropospheric temperatures:
Enlarged
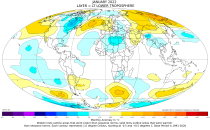
And January 2022:
Enlarged
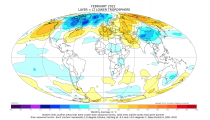
February Temperatures (preliminary)
Global composite temp.:+0.00F equal to seasonal average
Northern Hemisphere:+0.02F above seasonal average
Southern Hemisphere:-0.04 F below seasonal average
Tropics: -0.43F below seasonal average
------------
In an earlier commentary, Madhav Khandekar pointed out that the year 2018 was one of the coldest and snowiest winters in Canada, especially in western Canada. For example, Calgary witnessed one of the largest snowfalls in recorded history, and Edmonton witnessed 127 consecutive days with below freezing temperatures. In Atlantic Canada, several snowstorms were recorded with snow falls amounting to 10 to 25 cms. Khandekar also pointed out extreme cold weather in Europe during late February 2018 with Moscow reporting 45 cm of snow and temperatures of at least -17C, and France shivering at below freezing temperatures between February 26 and 28.
Fast forward to last Christmas, when bitterly cold weather with wind-chill values of -50C and lower over much of western Canada. Since the new year 2022, we are in the throes of another dose of extreme cold weather from Vancouver to St. John’s, and even to the southeast USA to Greece and Turkey, to Japan, and northeast China.
Over North America, brutal and dangerous snowstorms made two visits in the first week of week of February producing dangerous winter conditions from Nova Scotia, Illinois, and Texas with power outages for over half a million residences. Surface transportation was disrupted in many US Midwest States, and over 6000 flights were cancelled on February 4th.
Even the tropical regions of northern India were not spared from brutally cold weather, where over 200 people died, most of the dead were elderly living in poorly built houses with no insulation or any heating system, unlike we have here in Canada.
What is annoying is that environmentalists and climate scientists (pundits?) keep talking about GW (Global Warming_ and the possibility of extreme heat, floods, and droughts. There is almost no mention of increases in cold extremes either in the climate science community or in the major news media. Climate activists keep talking about Climate Catastrophe or Climate Emergency with more extreme warm weather in future due to human-added CO₂. Many global leaders and multi-national Corporations have become members of the “net-zero by 2050” campaign, urging nations to limit C0₂ emissions to keep the earth’s mean temperature from rising beyond 1.5C. A warmer climate could precipitate a Climate Crisis In their minds.
What is the climate reality?
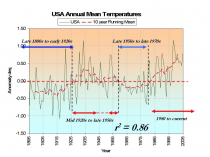
Based on the latest satellite data (Figure 1) the global mean temperature variation for January 2022 is a mere +0.03C above the 40-year average. A close analysis suggests that the earth’s climate may be cooling not warming. Observational evidence over many areas of the world definitely points to a cooling climate.
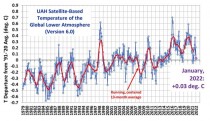
Figure 1. Running Average and January 2022 Average Temperatures
(Courtesy of Roy Spencer)
Has the climate stopped warming? There are many more issues with the hype about GW that needs to be assessed carefully. Unfortunately, the Canadian media and climate science community continues to push Global Warming that totally disregards the reality of the present trends
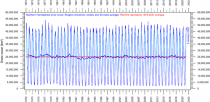
Figure 2 shows one M km2 (2%) increase in Northern Hemispheric (N.H.) snow cover from 1980 to 2021. Five of the 15 years since 2007 have been above the 42-year average. There is no evidence of the disappearing snow cover and milder winters that the IPPC predicted.
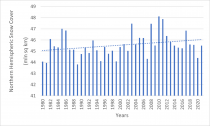
Figure 2. Winter N.H. snow cover extent 1980-2021
Source: Rutgers University Snow Lab
It is worth noting that the spike in N.H. snow cover in 2010 and 2011 coincided with the deepest solar minimum since 1913. The four years from 2007 to 2010 there were fewer than 15 sunspots a month.
On February 7th 2022, the Electroverse website describes how France is bracing for blackouts where old coal fire generating facilities are being fired up to cope the dropping temperatures. The website also reports that this has been Japan’s snowiest winter, and that scores of people have died in New Delhi. India’s cold wave has brought its first snowfall since 1958.
Finally, the important issue of a Climate Catastrophe thinking continues to gather steam with the “net-zero by 2050” theme. The obvious question for world leaders and the climate science community is: Is there a Climate Catastrophe?
There are many other important issues in the climate change science to be addressed but unfortunately they are not on the world’s agenda..
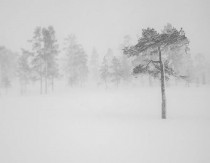
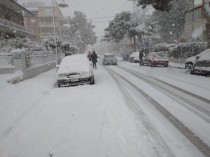
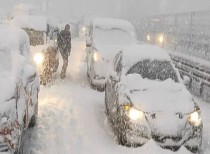
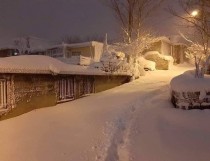
We close with photographs of extreme cold events from around the world courtesy of Electroverse (see www.electroverse.net).
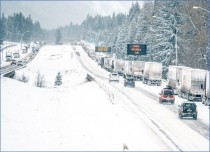
Jan. 6, 2022 Record-breaking snowstorms snarl transport across U.S. shutter the federal government and bring Washington D.C to a standstill with close to 12 inches of snow.
Jan. 21, 2022 Nashville, Tennessee, U.S. experiencing snowiest January since 1985.
Jan. 24, 2022 Heavy snow in Athens, Greece
Jan. 24, 2022 Heavy snow in Athens, Greece
Jan. 25, 2022 Istanbul, Turkey
Jan. 18, 2022 Erbil, Iraq, reports -15C
References
IPCC 2007: Climate Change 2007: The Physical science basis: Contribution to the Working Group 1 to the fourth assessment report of the IPCC: Edited by S Solomon et al, Cambridge University Press,
Khandekar, M.L. and Garnett E.R. 2020 Global Warming (GW) & Extreme Weather (EW) Link: Are Cold Weather Extremes on the Rise? Earth & Environmental Science & Reviews ISSN: 2639-7455.
About authors
Madhav Khandekar holds a Ph D in Meteorology from the Florida State University USA (1968) and an M. Sc. in Statistics from Pune University India (1957). Khandekar has been working in weather and climate science for over 60 years and has published over 150 papers, reports, book reviews, and scientific commentaries. His current interest is global weather anomalies and extremes. He retired as a Research Scientist at Environment Canada in 1997 and lives in Toronto.
Ray Garnett has worked in Agro-Climatology for 45 years as an independent consultant and research analyst at the Canadian Wheat Board’s Weather and Planning Departments. Along with Dr. M.L. Khanderkar he co-founded the ad hoc Long-Range Weather and Crop Forecasting Working Group that organized meetings across Canada. In 2016 he was awarded the Andrew Thompson prize in Applied Meteorology given out by the Canadian Meteorological and Oceanography Society.
-----------
ICECAP NOTE:
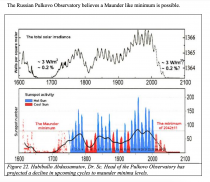
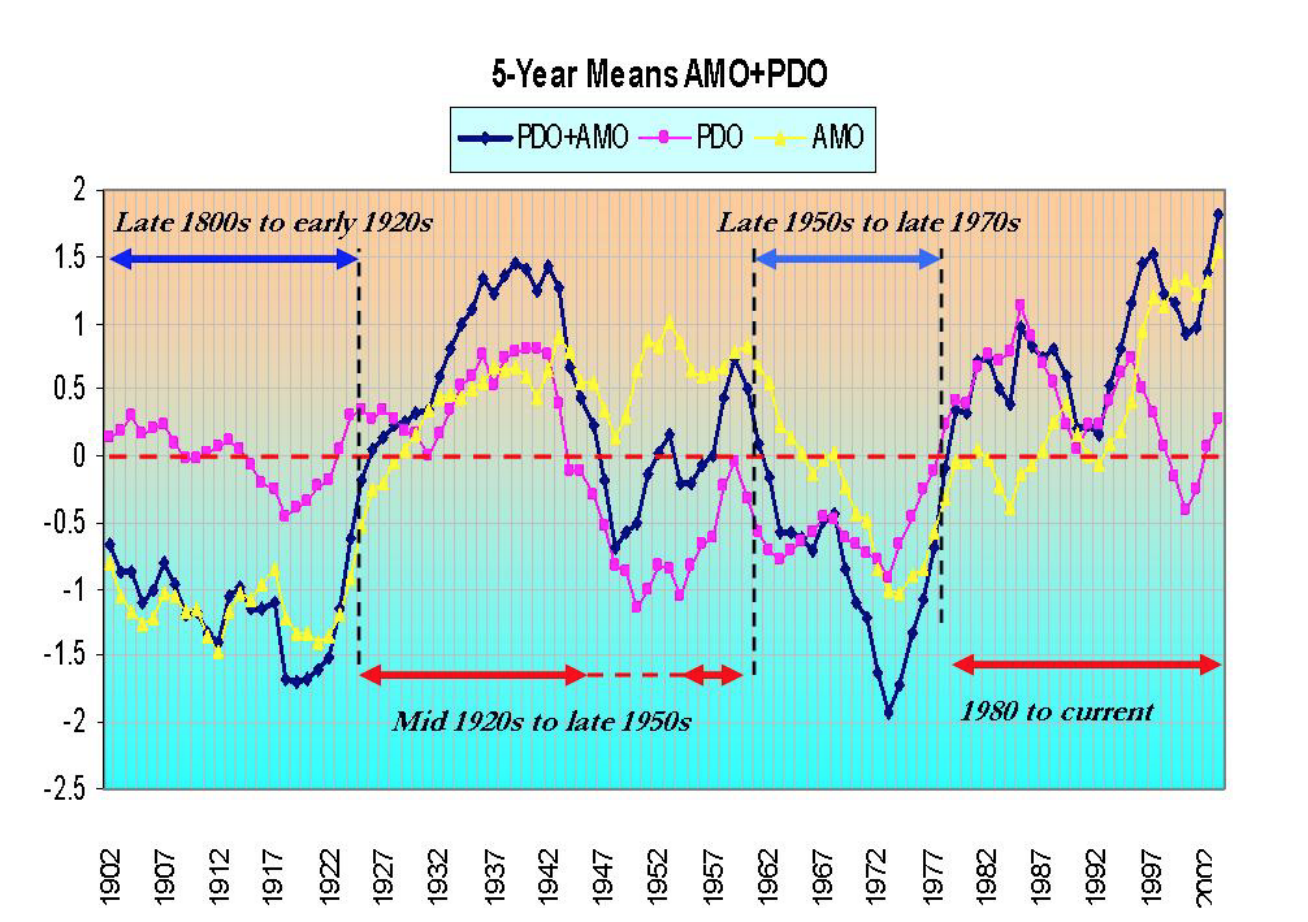
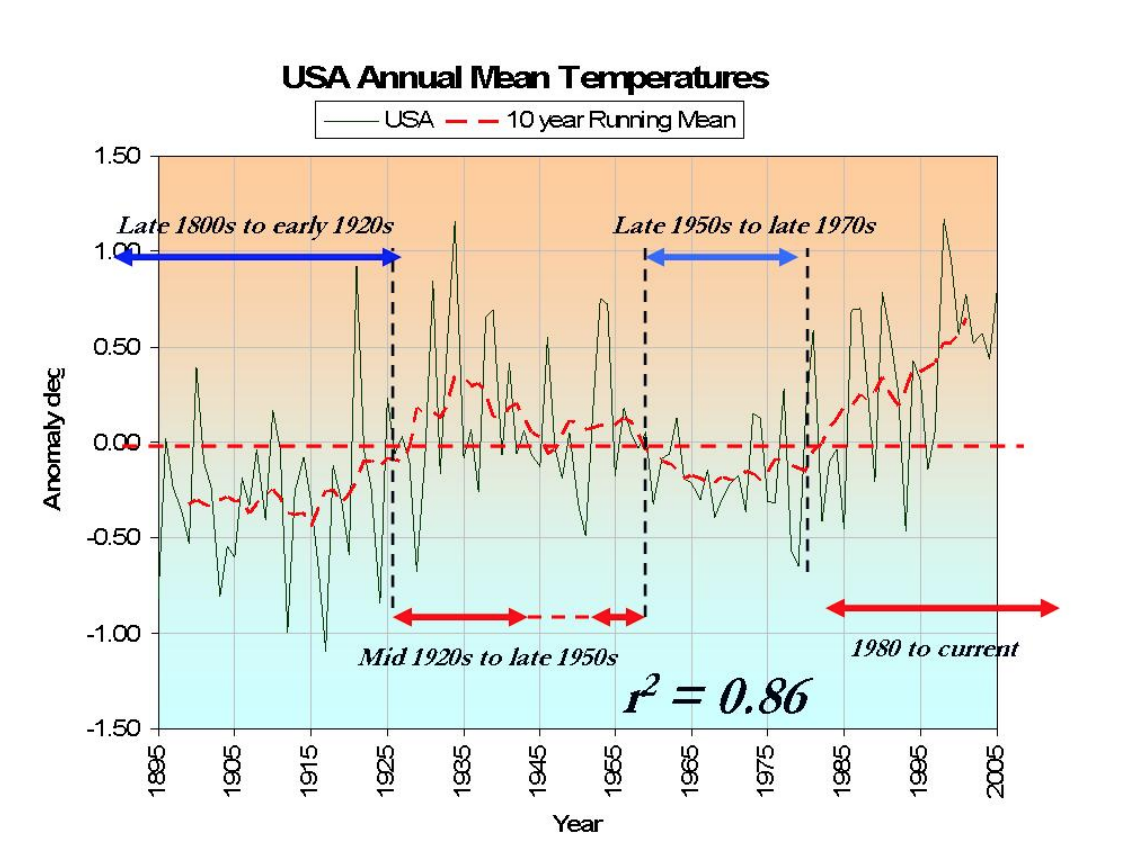
We are at a point where the long term cycles of temperatures and the real drivers, solar and ocean factors should kick us into a cold multi-decadal mode. The Russian Academy believes the sun is likely to enter a deep minimum like the Dalton or even Maunder Minimum.
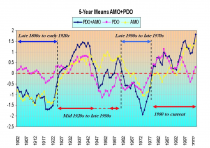
Enlarged
Enlarged
Enlarged
Enlarged
We had a preview in the harsh winters of 2013/14 and 2014/15. Weatherbell provided EIA of forecasts that Heating Degree Days would be 11% above normal (which verified) while the government forecasted normal. See the summary here. 2014/15 was the coldest and snowiest since 1717!
Feb 17, 2022
NOAA Ocean Service: 2022 The Next 30 Years of Sea Level Rise - junk science
Joseph D’Aleo, CCM
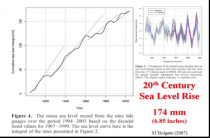
"Sea level along the U.S. coastline is projected to rise, on average, 10-12 inches (0.25 - 0.30 meters) in the next 30 years (2020 - 2050), which will be as much as the rise measured over the last 100 years (1920 - 2020). Sea level rise will vary regionally along U.S. coasts because of changes in both land and ocean height.”
Fact Check:
The claim that global warming is resulting in rising sea levels is demonstrably false. It really hinges on this statement: “Tide gauges and satellites agree with the model projections.” The models project a rapid acceleration of sea level rise over the next 30 to 70 years.” However, while the models may project acceleration, the tide gauges clearly do not.
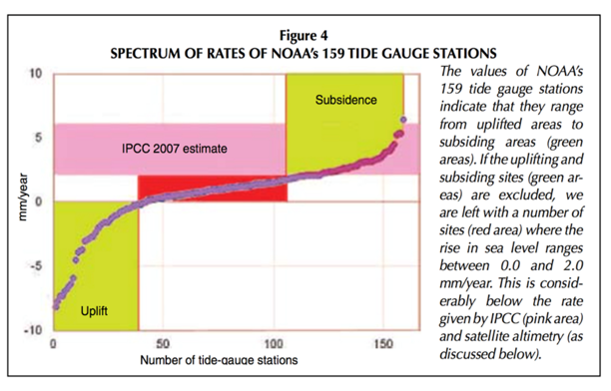
All data from tide gauges in areas where land is not rising or sinking show instead a steady linear and unchanging sea level rate of rise near 4 inches/century, with variations due to gravitational factors.
It is true that where the land is sinking as it is in the Tidewater area of Virginia and the Mississippi Delta region, sea levels will appear to rise faster but no changes in CO2 emissions would change that. The implication that measured, validated, and verified Tide Gauge data support this conclusion remains simply false.
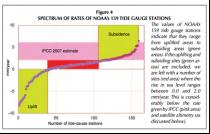
All such references rely on “semi-empirical” information, which merges, concatenates, combines, and joins, actual tide gauge data with various models of the reference author’s choosing. Nowhere on this planet can a tide gauge be found, that shows even half of the claimed 3.3 mm/yr sea level rise rate in “Tectonically Inert” coastal zones. These are areas that lie between regions of geological uplift and subsidence. They are essentially neutral with respect to vertical land motion, and tide gauges located therein show between 1 mm/yr (3.9 inches/century) and 1.5 mm/yr (6 inches/century rise). The late, great Swedish Oceanographer, Nils-Axel Morner, has commented on this extensively, and his latest papers confirm this ‘inconvenient truth’.
(Enlarged)
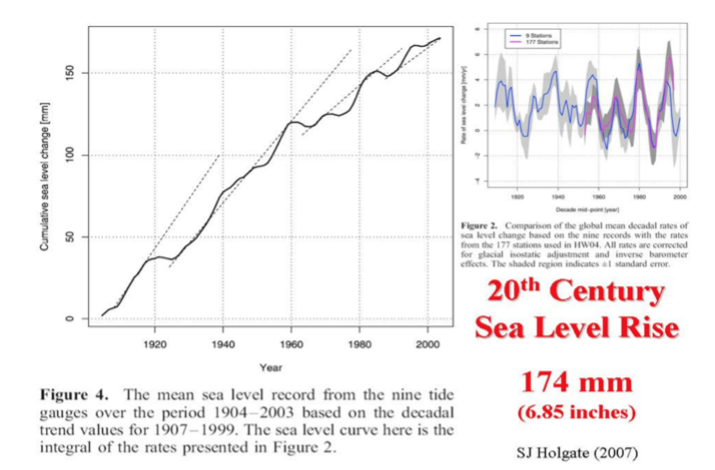
Holgate (2007) actually showed a slowing began in the late 20th century.
Source:
(Enlarged)
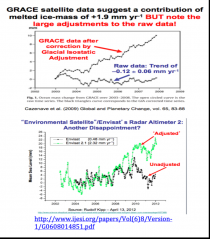
Furthermore, alarmist claims that “Satellites agree with the model projection” are false. Satellite technology was introduced to provide more objective measurement of the sea level rise because properly adjusted tide gauge data was not fitting Alarmists’ claims.
(Enlarged)
However, the new satellite and radar altimeter data lacked the resolution to accurately measure sea levels down to the mm level. Moreover, the raw data from this technology also conflicted with Alarmists’ claims. As a result, adjustments to this data were also made - most notably a Glacial Isostatic Adjustment (GIA). GIA assumes that basically all land is rebounding from long ago glaciations and oceanic basins are deepening. The assumption is that this rebounding is masking the true sea level rise. Alarmists continue to proclaim that their models project a rapid acceleration of sea level rise over the next 30 to 70 years, when those same models have failed to even come close to accurately predicting the past 25 years.
Natural Factors
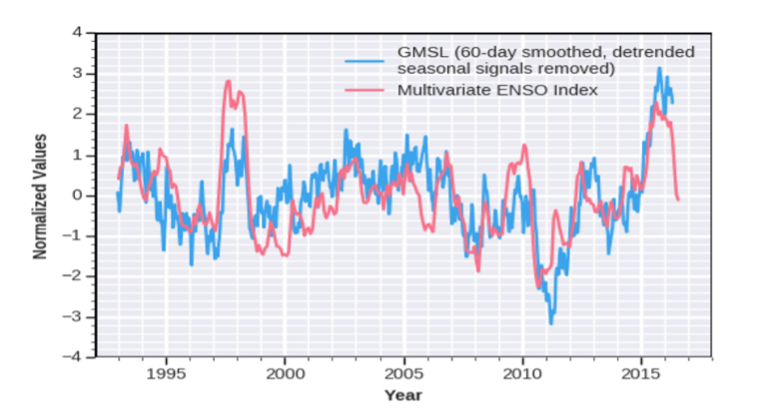
Sea level rises are influenced by factors like El Nino and La Nina. El Nino’s produce warming and ocean expansion, increasing sea levels rises. La Nina’s produce cooling and ocean contraction and slower rises.
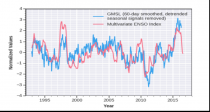
Source: UCO GMSL and the MEI (Enlarged)
Hansen had predicted in the late 1980s, flooding of the West Side Highway and water lapping on the steps of GISS in New York City within 20 years (by 2010). Sea levels have increased a little over an inch over that period. ABC predicted in that Manhattan would look like this by 2014. Again no appreciable change has occurred.

(Enlarged)
Global warming is not resulting in rising sea levels.
For much more detail see. Also see here how scientists were caught adjusting sea level data.
|

