
|
Jul 31, 2008
New Paper Demonstrates Lack of Credibility for Climate Model Predictions
By Paul Biggs on Jennifer Marohasy Politics and Environment Blog
A new paper by Demetris Koutsoyiannis et al has been published, which demonstrates that climate models have no predictive value. The full paper entitled, ‘On the Credibility of Climate Predictions’ is published in the Journal of Hydrological Sciences, and is available for free download. 18 years of climate model predictions for temperature and precipitation at 8 locations worldwide were evaluated.
The Abstract states: “Geographically distributed predictions of future climate, obtained through climate models, are widely used in hydrology and many other disciplines, typically without assessing their reliability. Here we compare the output of various models to temperature and precipitation observations from eight stations with long (over 100 years) records from around the globe. The results show that models perform poorly, even at a climatic (30-year) scale. Thus local model projections cannot be credible, whereas a common argument that models can perform better at larger spatial scales is unsupported.” See post and blog comments here.
As one poster noted : “On a more salient point; this paper by Koutsoyiannis looks to be a polished up version of this one which surfaced in May.I have been banging on about it for some time, and it doesn’t seem to have got much reaction at the usual AGW websites.” Another poster responded “Serious contradictory evidence is usually met with silence at the usual AGW sites for a simple reason - if it isn’t discussed, it cannot therefore exist.”
Jul 29, 2008
The Missing Greenhouse Signature
By David Evans, Science Speak
Each possible cause of global warming has a different pattern of where in the planet the warming occurs first and the most. The signature of an increased greenhouse effect is a hotspot about 10 km up in the atmosphere over the tropics. We have been measuring the atmosphere for decades using radiosondes - weather balloons with thermometers that radio back the temperature as the balloon ascends through the atmosphere. They show no hotspot whatsoever. So an increased greenhouse effect is not the cause of the recent global warming. So we now know for sure that carbon emissions are not a significant cause of the global warming.
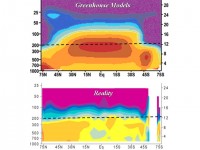
See larger image here.
The theoretical combined signature expected by the IPCC contains a prominent and distinct hotpot over the tropics at 8 - 12 kms. This hotspot is the signature feature of an increase in greenhouse warming. The observed signature at 8 - 12 km up over the tropics does not contain a hotspot, not even a little one. Therefore: 1. The IPCC theoretical signature is wrong. So the IPCC models are significantly wrong. 2. The signature of increased greenhouse warming is missing. So the global warming from 1979 to 1999 was not due predominately to increased
greenhouse warming, and was therefore not due to carbon emissions.
When the signature was found to be missing, alarmists objected that maybe the readings of the radiosonde thermometers might not be accurate and maybe the hotspot is there but went undetected. The uncertainties in temperature measurements from a radiosonde are indeed large enough for a single radiosonde to maybe miss the hotspot. Yet hundreds of radiosondes have given the same answers, so statistically it is not possible that they collectively failed to notice the hotspot. Recently the alarmists have suggested we ignore the radiosonde thermometers, but instead take the radiosonde wind measurements, apply a theory about wind shear, and run the results through their computers to estimate the temperatures. They then say that the results show that we cannot rule out the presence of a hotspot. If you believe that you believe anything.
Jul 28, 2008
Snow Greets Visiting Hikers at Mount Rainier
By Howard Meyerson, Grand Rapids Press
Cool ocean temperatures in the southern Pacific Ocean—a phenomenon known as La Nina—chilled sunny expectations this summer for thousands of visitors to Mount Rainier National Park. Those who arrived here in July planning to backpack or hike its famous sub-alpine wildflower meadows found snow instead, six feet in places, though sunny daytime temperatures reach into the 70s.
The popular mountain that draws 1.5 million visitors each year received 950 inches of snow last winter, 300 inches more than its 650-inch average. Park officials said a cooler than usual spring also pushed back the thaw. “A lot of people were disappointed to come and find snowy meadows,” said Mike Punches, a park interpreter at the Henry M. Jackson Visitor Center at Paradise, located 5,400 feet above sea level. “Normally the wildflower season is all of July and August. The early bloomers come the first of July.

Press Photo/Howard Meyerson
Areas that feature the avalanche lily are limited to certain parts of the mountain."I led wildflower hikes in June on 10 feet of snow. They weren’t listed that way. We shifted them to ecology hikes about life on Rainier, and what it takes to adapt here.” Climate officials said the Pacific Northwest snowpack is the heaviest it has been since 1999. That’s when the last La Nina event occurred. Deep snows remain throughout the region affecting the Olympic and North Cascade mountain ranges along with portions of Oregon, Idaho and British Columbia.
“The main driver is a strong La Nina,” said Dave Garen, hydrologist for the National Water and Climate Center in Portland Oregon, part of the U.S. Department of Agriculture. The agency monitors mountain snowpack for its water content, predicting river flow volumes for agricultural use. Read full story here.
Also see this story on the ongoing chill in nearby Vancouver, British Columbia.
Jul 25, 2008
Gloomy Summer Headed toward Infamy - Anchorage Alaska
By George Bryson
The coldest summer ever? You might be looking at it, weather folks say. Right now the so-called summer of ‘08 is on pace to produce the fewest days ever recorded in which the temperature in Anchorage managed to reach 65 degrees. That unhappy record was set in 1970, when we only made it to the 65-degree mark, which many Alaskans consider a nice temperature, 16 days out of 365. This year, however with the summer more than half over there have been only seven 65-degree days so far. And that’s with just a month of potential “balmy” days remaining and the forecast looking gloomy. National Weather Service meteorologist Sam Albanese, a storm warning coordinator for Alaska, says the outlook is for Anchorage to remain cool and cloudy through the rest of July.
“There’s no real warm feature moving in,” Albanese said. “And that’s just been the pattern we’ve been stuck in for a couple weeks now.” In the Matanuska Valley on Wednesday snow dusted the Chugach. On the Kenai Peninsula, rain was raising Six-Mile River to flood levels and rafting trips had to be canceled. So if the cold and drizzle are going to continue anyway, why not shoot for a record? The mark is well within reach, Albanese said: “It’s probably going to go down as the summer with the least number of 65-degree days.” In terms of “coldest summer ever,” however, a better measure might be the number of days Anchorage fails to even reach 60. There too, 2008 is a contender, having so far notched only 35 such days—far below the summer-long average of 88. Unless we get 10 more days of 60-degree or warmer temperatures, we’re going to break the dismal 1971 record of only 46 such days, a possibility too awful to contemplate. Read more here.

See larger image here.
Jul 24, 2008
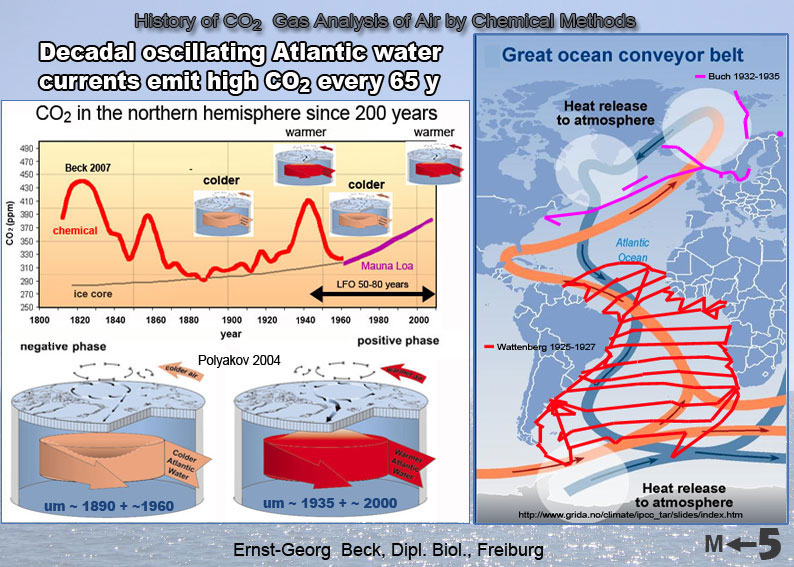
Evidence of Variability of Atmospheric CO2 During the 20th Century
Ernst-Georg Beck, Dipl. Biology
In 1958 the modern NDIR spectroscopic method was introduced to measure CO2 concentrations in the atmosphere [Beck 2007]. In the preceding period, these measurements were taken with the old wet chemical method. From this period, starting from 1857, more than 90,000 reliable CO2 measurements are available, with an accuracy within plus or minus 3 %. They had been taken near ground level, sea surface and as high as the stratosphere, mostly in the northern hemisphere. Comparison of these measurements on the basis of old wet chemical methods with the new physical method (NDIR) on sea and land reveals a systematic analysis difference of about minus 10 ppm.
Wet chemical analyses indicate three atmospheric CO2 maxima in the northern hemisphere up to approx. 400 ppm over land and sea since about 1812. The measured atmospheric CO2 concentrations since 1920 –1950 prove to be strongly correlated (more than 80 %) with the arctic sea surface temperature (SST). A detailed analysis of the Atlantic Ocean water during the arctic warming since 1918 – 1939 by Wattenberg (southern Atlantic ocean) and Buch (northern Atlantic ocean) indicates a very similar state of the Atlantic Ocean (pH, salinity, CO2 in water and air over sea etc.) These data show the characteristics of the warm ocean currents (part of global conveyor belt) at that time, indicating a strong CO2 degassing from the Atlantic Sea, especially in the area of Greenland/Iceland and Spitsbergen. More than 360 ppm had been measured over the sea surface.
In 2004 Polyakov published evidence for a multi-decadal oscillation of the ocean currents in the arctic circle, showing a warm phase (strong arctic warming during 1918 –1940 with high temperatures in the Iceland/Spitsbergen area) similar to the current situation, and a cold phase (around 1900 and 1960). Today the Iceland/Spitsbergen area is known for a strong absorption of CO2. This multi-decadal heating of the oceanic CO2 absorption area and larger parts of the Northern Atlantic Ocean was followed by an increase of the atmospheric carbon dioxide concentration to approx. 400 ppm during the 30s and approx. 390 ppm today. The abundance of plankton (13C) and other biota supports this view.
Conclusion: Atmospheric CO2 concentration varies with climate, the sea is the dominant CO2 store, releasing the gas depending on multi-decadal changes of temperature. See more here.
See larger image here.
|
|
|
|

