|
Jul 17, 2008
Major Paper Shows CO2’s Effect on Temperature was Overstated 500-2000%
New Zealand Climate Coalition
"The value of this paper lies in its dispassionate but ruthlessly clear exposition - or, rather, expose - of the IPCC’s method of evaluating climate sensitivity. The detailed arguments in this paper, and, indeed, in a large number of other scientific papers, point up extensive errors, including numerous projection errors of climate models, as well as misleading statements by the IPCC. Consequently, there are no rational grounds for believing either the IPCC or any other claims of dangerous anthropogenic global warming.” - Comment on paper by Viscount Monckton.
Mathematical proof that there is no “climate crisis” appears in a major, peer-reviewed paper in Physics and Society, a learned journal of the 10,000-strong American Physical Society, SPPI reports. Christopher Monckton, who once advised Margaret Thatcher, demonstrates via 30 equations that computer models used by the UN’s climate panel, the IPCC, were pre-programmed with overstated values for the three variables whose product is “climate sensitivity” (temperature increase in response to greenhouse-gas increase), resulting in a 500-2000% overstatement of CO2’s effect on temperature.
Climate Sensitivity Reconsidered demonstrates that a doubling of the concentration of CO2 in the air compared with pre-industrial levels, expected later this century, will be likely to increase global mean surface temperature not by the 6F predicted by the IPCC but, harmlessly, by little more than 1F. Lord Monckton concludes “Perhaps real-world climate sensitivity is very much below the IPCC’s estimates. Perhaps, therefore, there is no “climate crisis” at all. The correct policy approach to a non-problem is to have the courage to do nothing.
Larry Gould, Professor of Physics at the University of Hartford and Chair (2004) of the New England Section of the American Physical Society (APS), has been studying climate-change science for four years. He said: “I was impressed by an hour-long academic lecture which criticized claims about ‘global warming’ and explained the implications of the physics of radiative transfer for climate change. I was pleased that the audience responded to the informative presentation with a prolonged, standing ovation. That is what happened when, at the invitation of the President of our University, Christopher Monckton lectured here in Hartford this spring. I am delighted that Physics and Society, an APS journal, has published his detailed paper refining and reporting his important and revealing results.”
Read more here.
Jul 16, 2008
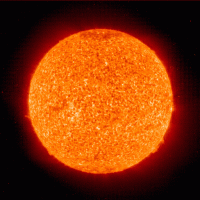
Sun in Deep Slumber: 10.7 Solar Flux Hits Record Low Value
By Anthony Watts, Watts Up With That
NRC Canada’s FTP site which logs the daily 10.7 centimeter (2800 megahertz) radio flux from the sun just reported what appears to be a new record low in the observed data, 62.5 at 1700 UTC. The 10.7cm solar radio flux is an indicator of the sun’s activity. Here is a brief description of it from the National Geophysical Data Center: The sun emits radio energy with a slowly varying intensity. This radio flux, which originates from atmospheric layers high in the sun’s chromosphere and low in its corona, changes gradually from day-to-day, in response to the number of spot groups on the disk. Radio intensity levels consist of emission from three sources: from the undisturbed solar surface, from developing active regions, and from short-lived enhancements above the daily level.
On July 18 1996, the observed value of the 10 cm solar flux dropped to a low of 64.9. In many books it is stated that the 10 cm solar flux can not go below a value of 67. For example, the formulae given in the June 1996 edition of the IPS Solar Geophysical Summary show 67.0 as the minimum value. So how can we get a value of 64.9? The answer is quite interesting - it depends on the orbit of the earth! The earth’s orbit is not perfectly circular but is slightly elliptical. In July of each year we are a little further than average from the sun and so solar radiation, including the 10 cm flux, is very slightly weaker than average. So the 10cm flux will tend to be lower in July than, for example, December when the earth is closer to the sun than its average value. The combination of the extra distance to the sun and the solar minimum conditions have acted to produce this very low flux value. It is easy to correct for the earth-sun distance and, when this is done, a value of 67.0 for 1996 was obtained. This is the text book value!
Values of the 10 cm flux are often given in two forms - first as directly observed values and secondly as values corrected for the earth-sun distance variation. The last time that the observed 10cm flux was at a lower value was on July 26, 1964 when it stood at 64.8. The lowest value ever recorded was on July 02, 1954 with a value of 64.4.
As we’e seen from visual cues and lack of sunpots recently, it is obvious that the sun is in a deep minima. Expert forecasts that have called for the sun to be regularly active by now have been falsified by nature, and the question of the day is: how long before the sun becomes active again? Read more here.
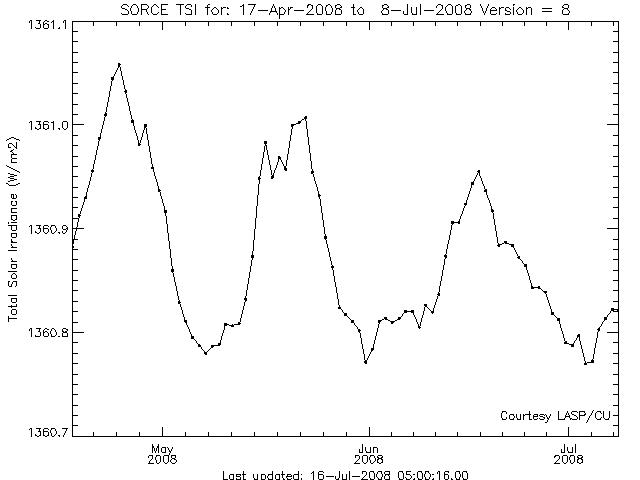
Icecap Note: By the way here is the daily total solar irradiance plot from NASA’s SORCE (Solar Radiation and Climate Experiment). You will notice the 27 day solar cycle even at solar minimum and notice the downtrend the last 3 months.

See large image here
Jul 16, 2008
Greenhouse Confusion Resolved
By Stephen Wilde, Fellow of the Royal Meteorological Society since 1968
The fundamental point is that the total atmospheric warming arising as a result of the density of the atmosphere is a once and for all netting out of all the truly astronomic number of radiant energy/molecule encounters throughout the atmosphere. The only things that can change that resultant point of temperature equilibrium are changes in solar radiance coming in or changes in overall atmospheric density which affect the radiant energy going out. In the real world the most obvious and most common reason for a change in atmospheric density occurs naturally when the oceans are in warming mode and solar irradiation is high as during the period 1975 to 1998. The increased warmth allows the atmosphere to hold more water vapour so that total atmospheric density increases and the atmospheric greenhouse effect strengthens. This effect is far greater than any CO2 effect. When the atmosphere cools again water vapour content declines and the atmospheric greenhouse effect weakens. CO2 and other trace gases are far too small a proportion of the atmosphere to have any significant effect in comparison to the water vapour effect. Even the water vapour effect has never provoked any tipping point in the face of the primary solar/oceanic driver so CO2 could never do so.
The Greenhouse Effect is only a tiny part of the global temperature control mechanism. In addition there is The Hot Water Bottle Effect whereby the oceans release stored heat intermittently at variable rates depending on the average state of the various oceanic oscillations at any particular time. The current assumption that the oceanic oscillations are ‘just’ a mechanism for redistributing heat already available to the atmosphere must be wrong. The oceanic heat store should be regarded as an additional heat source that adds or subtracts the effect of earlier solar irradiance (or lack of it) to or from the present day effect of current solar irradiance.
The total heat store available in the oceans is so large that it is capable of rendering changes in any Greenhouse Effect an irrelevance for all practical purposes. Oceanic oscillations are sufficient to cancel out or enhance the effects of natural variations in solar irradiance or other forms of solar input to the heat budget of the Earth for variable periods of time. A range of a mere 4 Watts per square metre or less in Total Solar Irradiance is sufficient to explain changes in Earth’s atmospheric temperature for the past 400 years. Outside that narrow band of apparent solar normality we would have more to worry about than any Greenhouse Effect.
The atmospheric greenhouse effect is a flea on the back of an oceanic elephant and the influence of CO2 but a microbe on the back of the flea and the influence of anthropogenic CO2 but a molecule on the back of the microbe. Read more here.
Jul 14, 2008
My Position on Climate Change
By Hendrik Tennekes - on Climate Science
The so-called scientific basis of the climate problem is within my professional competence as a meteorologist. It is my professional opinion that there is no evidence at all for catastrophic global warming. It is likely that global temperatures will rise a little, much as IPCC predicts, but there is a growing body of evidence that the errant behavior of the Sun may cause some cooling in the foreseeable future.
The political dichotomy about climate change is fueled by gross exaggerations and simplifications on both sides of the fence. There is no evidence for a catastrophic sea level rise or an irreversible loss of Greenland’s ice cap. Other human interferences with the climate system are ignored or dismissed. Political interest in the causes of local and regional climate change seems to be minimal, though local and regional climates may change considerably under human impact, even if the globally averaged temperature remains unchanged. I wish I could join those who believe that global climate change is of catastrophic proportions, but my personal interpretation of professional integrity forbids me. I refuse to join the crowd.
We should keep in mind that local and regional climates respond not only to greenhouse gases, but primarily to changing land-use patterns. Civilization has a long history of dealing with unintended regional climate change caused by large-scale deforestation. The present deforestation in the Amazon basin and in Indonesia threatens to repeat the many mistakes made in the past. The incessant emphasis on CO2 and its effects on globally averaged temperatures leads many to ignore the fact that changes in the distribution of precipitation are far more threatening to agriculture and biosphere than any slight temperature changes. In precisely that part of the problem, however, the predictive capabilities of global climate science are practically nonexistent.
Here in the Netherlands, where I happen to live high and dry, some forty feet above sea level, the threat of catastrophic sea level rise has anchored itself in the public mind. This threat is imaginary, too. I concur with Dr. Marcel Stive, a civil engineering professor at Delft University and member of a blue-ribbon panel that advises Holland’s government on the maintenance of our coastal defense system. In a recent interview with the alumni magazine Delft Integral, Dr. Stive said: “Fortunately, the time rate of climate change is slow compared to the life span of the defense structures along our coast. There is enough time for adaptation. We should monitor the situation carefully, but up to now climate change does not cause severe problems for our coastal defense system. IPCC has given lower estimates for the expected sea level rise in four successive reports.”
Read full post here.
Jul 11, 2008
Hansen Dodges Debate with Michaels
By Nick Fitzgerald, The Informer On-Line
Dr. James Hansen, NASA climatologist and major figure in the debate on global climate change, recently refused a paid invitation to speak and debate at the College about his positions on global warming. Braum Katz (’09)—secretary for the College’s Department of Student Rights, director of the newly-created William and Mary Society for Academic Freedom and Diversity and Informer writer—invited Mr. Hansen via e-mail. Mr. Hansen was one of the first individuals to discuss the potential impact of global climate change, speaking before Congress in 1988 to that effect. He has been in the media spotlight recently, saying that oil executives who are spreading “misinformation” about global warming should be tried for “crimes against humanity and nature,” as reported by various media outlets. He likened oil executives denying global warming to tobacco executives who denied the link between cancer and the use of their products. Mr. Hansen recently told The Associated Press that as far as global climate change is concerned, “this is the last chance.”
The invitation to speak at the College came after Mr. Katz contacted Dr. Patrick Michaels, who is a vocal global warming skeptic, former American Association of State Climatologists-designated climatologist at the University of Virginia and also a fellow at the Cato Institute. Mr. Michaels said he would be interested in speaking and debating at William and Mary about his oft-criticized positions denying the significance of global climate change. His UVA faculty Web site reads, “My research leads me to believe that the next decade will see the emergence of a paradigm of ‘robust earth,’ as opposed to the fashionable ‘fragility’ concept….It is entirely possible that human influence on the atmosphere is not necessarily deleterious and that it is simply another component of the dynamic planet.” Mr. Katz, as director of the new student group hoping to expand academic and intellectual diversity, was looking to create a debate between Messrs. Hansen and Michaels, giving both the opportunity to defend and explain their views in a public forum. “For this fall,” Mr. Katz wrote in his e-mail to Mr. Hansen, “we are hoping to host a debate on global climate change and its implications. Patrick Michaels has agreed to come, and my organization would like you to come and debate Dr. Michaels in Williamsburg. The date is very flexible, and we can tailor the day of the debate completely to your schedule. We will be able to pay for your travel expenses and offer you an honorarium for your time. Please let me know if you would be interested."Mr. Hansen’s response was, simply, “not interested.”
His reply devoid of any salutation, punctuation, capitalization or signature came an hour after Mr. Katz sent his original e-mail. “I was truly taken aback by Dr. Hansen’s refusal to debate Dr. Michaels,” said Mr. Katz. “I gave Dr. Hansen a blank check to come to the College, and still he refused. Dr. Hansen’s suggestion that oil executives who advance global warming skepticism be tried for ‘crimes against humanity’ and subsequent refusal to debate one of the most prominent academic skeptics is suspicious and unfortunate, to say the least. I still continue to hope that Dr. Hansen realizes the error of his decision and does eventually decide to debate Dr. Michaels. The William and Mary community deserves an open and honest debate about the implications of climate change."Mr. Hansen did not respond to repeated attempts by The Informer to contact him for comment. See story here
|
|
|
|

