

On December 11, 2023, the Supreme Court refused to examine the numerous science-based arguments contained in a Petition for Reconsideration of EPA’s 2009 Greenhouse Gas (GHG) Endangerment Finding. (See) This court ignored the eight quite specific, but easy to understand scientific arguments contained in the Petition and simply denied the Petition claiming the petitioners did not have Standing - a well-known tactic to avoid decisions in a highly politically-charged situation.
Unfortunately, this Supreme Court decision denied scrutiny to the one regulation in the U.S. that is not only the single most economically significant, but also the single most scientifically flawed, of all of the regulations on the Federal books.The ramifications of this Supreme Court Denial will be enormous if an EPA GHG Endangerment Finding Reconsideration is not initiated very quickly. This fact should have been clear to the Court by the arguments quoted verbatim below:
“In short, based on the sum total of the eight validated arguments {contained in the Petition}, the currently contemplated Social Cost of Carbon (SCC) estimates are not only worthless; they are extremely dangerous to put forward to current U.S. energy, economic and national security-related policymakers as credible input to their analyses.
As clearly demonstrated by this body of research findings, climate alarmism has no basis in science. This alarmism is all driven and supported by fabricated temperature data as well as mathematical climate modeling and analytical incompetence. Motives of key scientists and other key players will be left to others to sort out. Based on the easily reproducible, peer-reviewed and published research cited herein, climate science now finds that there is no mathematically valid proof that past increases in atmospheric GHG concentrations have caused the officially reported global warming over the last 50 years or so. Therefore, there is no proof of any social costs related to such GHG emissions. In fact, these GHG emissions are beneficial to society no matter what processes by which they might occur. Typically, if the efficiency of the particular process involved can be improved, such GHG emissions will automatically be reduced through action by a competitive marketplace. If not, there is no cost to society in any case.
Finally, on-going fact checks of the 13 most common climate alarmist claims have consistently validated that absolutely nothing unusual is going on with the Earth’s climate system. Moreover, in the considerable research cited, changes in the Earth’s temperature have been shown to be readily explained by natural factors involving changes in solar, volcanic and oceanic/atmospheric activity.
These findings strongly suggest that America and its allies have already made extremely severe climate policy errors, the negative impacts of which will only grow exponentially. By taking these erroneous climate and energy policy actions, America is rapidly destroying its energy security to the detriment of its economic and national security but to the great benefit of all three of its major enemies: China, Russia and Iran.
This must stop immediately and America must now reverse course quickly - taking the following actions:
* All efforts by state and federal governments to subsidize in any way the use of any renewable energy sources must be immediately terminated.
* All current state and federal as well as private (e.g., financial) sector efforts to inhibit the finding, production and use of all fossil fuels must be immediately terminated.
* All U.S. government action and funding at all levels to take steps to regulate the emissions of all GHGs must be immediately terminated - since they are all beneficial gases. Regulation of Criteria Pollutants under the CAA has been very successful and must be continued.
* America must stay out of the Paris Agreement and encourage its key allies to get out if they are in it.
* This new information on climate science must be widely publicized via every possible credible channel targeting today’s relevant audiences, including: key federal and state leadership, financial, fossil fuel and auto sector leadership as well as key media outlets.
The utter lunacy of America’s Federal Government leadership continuing to take the unsuspecting American people on this ride over a cliff would certainly seem to be outrageous behavior on the part of those who know, or should know, the facts. Many of these key facts, e.g., the Global Average Surface Temperature data fabrication, have been provided to high level officials years ago without result. For the sake of all Americans, we pray that recipients of this transmission will behave differently.”
AUTHOR COMMENTS
All research by the authors of this document cited herein was peer-reviewed, published and purposely set up so as to be easily reproducible. No rebuttals have been received by the lead author from any person or entity. The research effort, that began in 2009, is all still being carried out on a pro bono basis. PART II provides an easy to understand, corroborated proof that EPA’s 2009 GHG Endangerment Finding is fatally flawed. Nevertheless, the Supreme Court saw fit to Totally Ignore the Science Team’s arguments provided verbatim in Appendix II denying consideration thereof based on “standing issues”.
See the full document here with the 8 validated arguments in the petition and the 13 most common climate alarmist claim fact checks as well as the list of authors and reviewers.
Joseph D’Aleo, CCM Link
This document is an update of an earlier version contained in the following filings with EPA: here (see pages 17-21), and here (see pages 20-24).
A recent paper here “A Critical Assessment of Extreme Events in Trends in Times of Global Warming”, Gianluca Alimonti et al., European Physical Journal Plus, 2022 reviews recent bibliography on time series of some extreme weather events and related response indicators in order to understand whether an increase in intensity and/or frequency is detectable. “None of these response indicators show a clear positive trend of extreme events. In conclusion on the basis of observational data, the climate crisis that, according to many sources, we are experiencing today, is not evident yet.”
Also Ralph Alexander With GWPF has issued a report Extreme Weather, the IPCC’s Changing Tune. This paper compares empirical observations of extreme weather events with their coverage in the 2021 Sixth Assessment Report (AR6) of the Intergovernmental Panel on Climate Change (IPCC). The conclusions of AR6 are contrasted with observational data described in recent research papers and reports, particularly in relation to droughts, tropical cyclones, heatwaves (including marine heat waves) and cold extremes. The paper also covers major floods, tornadoes, wildfires and coral bleaching, with a short update of the discussion of disaster risk analysis.
---------------
Below are a series of fact checks of the 13 most common climate claims such as those made in the recently released Fourth National Climate Assessment Report. The contributors of these reviews are all recognized experts in the relevant fields. For each claim, a brief summary of the relevant rebuttal is provided along with a link to the full text and graphical support of the rebuttal and the names and the credentials of the authors for each rebuttal.
Claim: The globe has experienced among the warmest ever month or year in the entire record back to the 1800s. This claim is recurrent - often monthly.
Fact Check: These claims are totally unsupported by any credible analysis of raw global surface temperature data and its availability. Moreover, this Global Average Surface Temperature Data invalidation alone, invalidates the EPA 2009 GHG/CO2 Endangerment Finding as well as the subsequent EPA Findings’ claimed link between rising atmospheric CO2 concentrations and the other Climate Alarmist claims - which are also independently invalidated below by relevant empirical data. Thus, all such climate alarmist claims are in reality just politically driven fictions. See details here. See a Timeline of Surface Data versions here See this video from Tony Heller showing how much of the data in data void areas is created so as to provide the politically correct warming here. here.
See Bombshell report: 96% of U.S. Climate data is Corrupted:
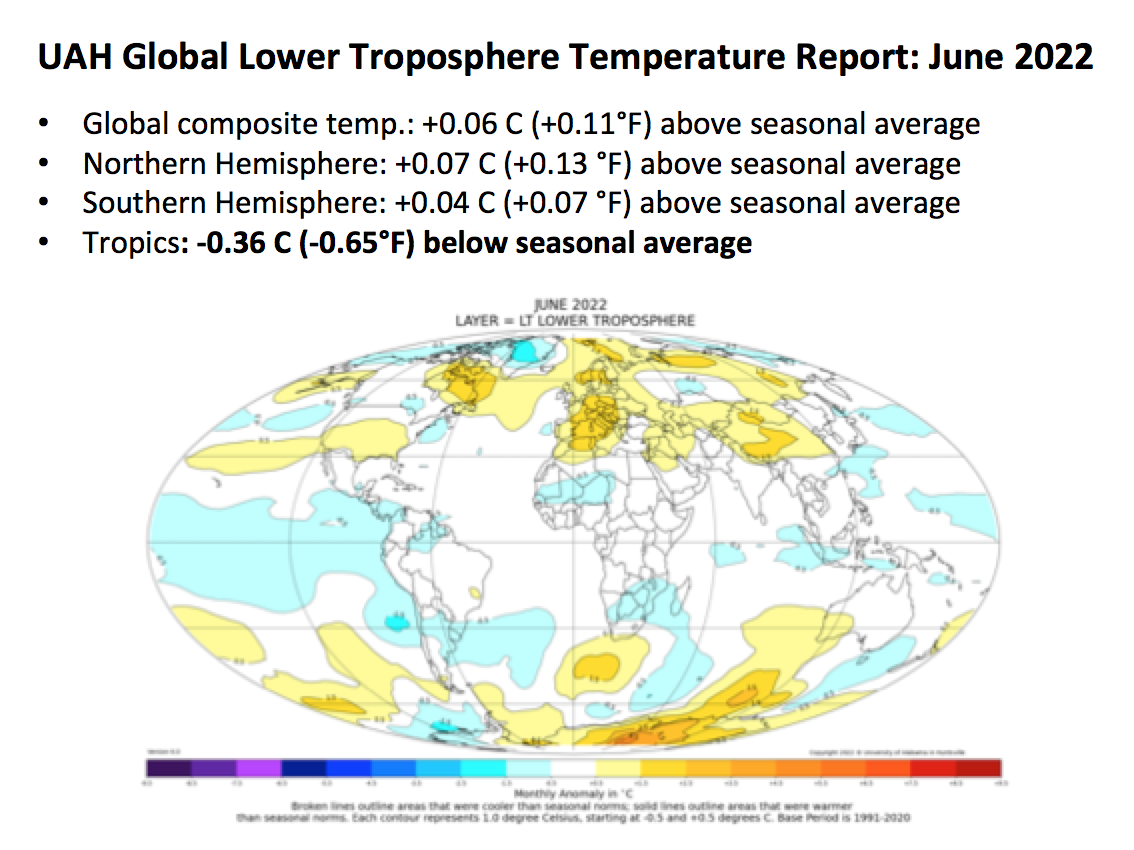
Satellite data for the lower troposphere shows a fraction of the warming of the surface stations. The greenhouse theory say the heating should be greater in the tropical atmosphere where greenhouse gases are theorized to be trapping the heat (tropical hot spot).

John Robson from Climate Discussion Nexus shows this very well in this video.
And here:
Fact Check as of: 12/16/22
----------
Claim: Heat Waves are more frequent and extreme. Heat waves kill people and greenhouse gases are to blame.
Fact Check: Heat waves like cold waves are a normal part of our global climate. Heat Waves have been decreasing since the 1930s in the U.S. and globally. See details here. See a summary of summer sizzle in 2022 here. See Dr. Cliff Mass’s excellent 2021 post “Flawed Heatwave Report Leads to False Headlines in Major Media Blogpost. “Last week we witnessed a major failure in science communication regarding the Northwest heatwave. A failure that misinformed you and millions of others, and a failure that highlighted glaring weaknesses in the media’s ability to cover important scientific issues. And it revealed the disappointing behavior of some members of the scientific community.” See full detailed analysis here. Roger Pielke Jr, tells “What the media won’t tell you about U.S. heat waves here. See this why amplified patterns, a feature of cooling climates, are behind the warm and cold extremes in 2021 and again this year here. Cold not heat is the real threat. Cold kills up to 20 times or more than heat globally and has disastrous economic impacts. See details on why cold not heat is the main danger to humanity here. See more recent mortality studies that show a statistically significant excess mortality for cold over heat here Latest Update here
Fact Check as of: 04/05/25
----------
Claim: Hurricanes have been increasing in number and/or extremity.
Fact Check: Even with a few very active seasons, the last decade ended was the second quietest for landfalling hurricanes and landfalling major hurricanes in the U.S since the 1850s. 2020 saw a record 30 named storms and many Gulf impacts like the late 1800s and active periods this past century, but the Accumulated Cyclone Energy Index (ACE) ranked only 13th highest in 2020. The 1860s and 1880s had the most landfalling hurricanes and major hurricanes. See a perspective on Major Hurricane Ian here. See summary through 2022 here. See this June 2021 NOAA study that though 2020 was technically a record, modern technology is likely a reason including the ability to see storms over the open oceans of the central and eastern Atlantic with satellites that would not have been seen and counted in the pre-satellite era. See 2020 season similarity to late 1800s here. See a perspective on deadly 2021 CAT4 hurricane Ida and a similarity to Camille in 1969 here.. See the story through 2023 here. “ title="here.">here.See this Daily Signal interview of David Legates about hurricanes. See the summary of 2024 and 2025 here.
Fact Check as of: 04/05/25
---------
Claim: Tornadoes have been increasing as the world has warmed due to human influences.
Fact Check: More active months and seasons occur when unseasonable cold spring patterns are present. Warmer cycles feature fewer big tornado seasons. The number of strong tornadoes has declined dramatically over the last half century. That will reverse as we go into the next cold phase. Even with a major, deadly outbreak and long track storm in December, 2021, the year ended in the lowest 25th percentile for tornadoes. Through October, 2022 also fell in the lower 25th percentile for tornadoes with no level EF5 major tornadoes now for the last 11 years, the longest stretch in the entire record despite better detection. A return to more active seasons would eventually occur as the earth cools with the colder Pacific and low solar. See in the full updated story how the 2022 started strong early but has quieted to below the 25th percentile here See 2025 Update here.
Fact Check as of: 04/05/25
----------
Claim: Droughts and Floods are becoming more severe worldwide due to global warming.
Fact Check: Droughts and floods here has shown no statistically significant trends. Each year wet and dry areas are seen but their locations change, related to ocean warm and cold pools that drive atmospheric patterns that persist for months at a time. This year, the Atlantic and Pacific ocean configurations supported drought issues in the central which verified. See details here. See how claims that drought from climate change is causing Lake Mead water levels to plunge us wrong on both counts here. See Viv Forbes reports on La Nina floods in Australia in Floods and Droughts are Nothing New here.
Fact Check as of: 10/16/22
----------
Claim: Wildfires are increasing due to drought and increasing heat.
Fact Check: Wildfires diminished very rapidly in size and numbers after the very active 1800s. The increase in damage in recent years is due to population growth in vulnerable areas and poor forest management. See details here. See this analysis that shows how public lands are ablaze but private lands are not because they are properly managed here. See A Growing Sea of Snags: North Umpqua River Wildfires, 2002-2022 - Risks and Recommendations here. See a telling media story on the deadly Maui wildfires real causes here and more here. See Australia Wildfire story here See how the story here detailing how record snows (up to 900 inches) in California and surrounding areas of the west resulted in a big drop in the areas burned.
Fact Check as of: 04/06/25
Claim: Snow is decreasing as the earth warms, threatening the winter sports industry.
Fact Check: This is one claim that has been repeated for decades even as nature showed very much the opposite trend with unprecedented snows even to the big coastal cities. Every time they repeated the claim, it seems nature upped the ante more. Alarmists have eventually evolved to crediting warming with producing greater snowfall, because of increased moisture but the snow events in recent years have usually occurred in colder winters with high snow water equivalent ratios in frigid arctic air. The eastern United States as an example had 28 high impact winter snowstorms in the 10 years ending on 2019/20. No prior ten-year period since 1950 had more than 10. Winters in the last decade or so produced snow records and snowcover that lasted well into the spring. Snowcover in the Northern Hemisphere, North America and Eurasia has been increasing since the 1960s in the fall and winter but declining in the spring. However, as NOAA advised around 2000 might be the case, snowcover measurement methodology changes (automated instead man/machine) at the turn of this century may be responsible for most of the warm season differences. “Warming is not causing snow to disappear.” See a summary of snow trends here. See more including all-time record western US mountain snows here. See the historic snows on the Gulf Coast in 2025here
Fact Check as of: 4/03/25
----------
Sea levels are rising at an alarming rate threatening coastal cities
Fact Check: The rate of global sea level rise on average has fallen by 40% the last century. Where today, it is increasing - local factors such as land subsidence are to blame. See details here. See how sea level trends are being adjusted here. to better fit the theory. Climate Discussion Nexus’s Dr. John Robson presents the global facts hereSee how between 1985 and 2015, satellite observations indicate the world’s coasts gained 13,565 km2 more land area than they had lost to the seas (Donchyts et al., 2016).
Fact Check as of: 04/05/23
----------
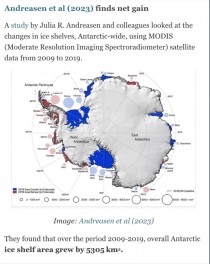
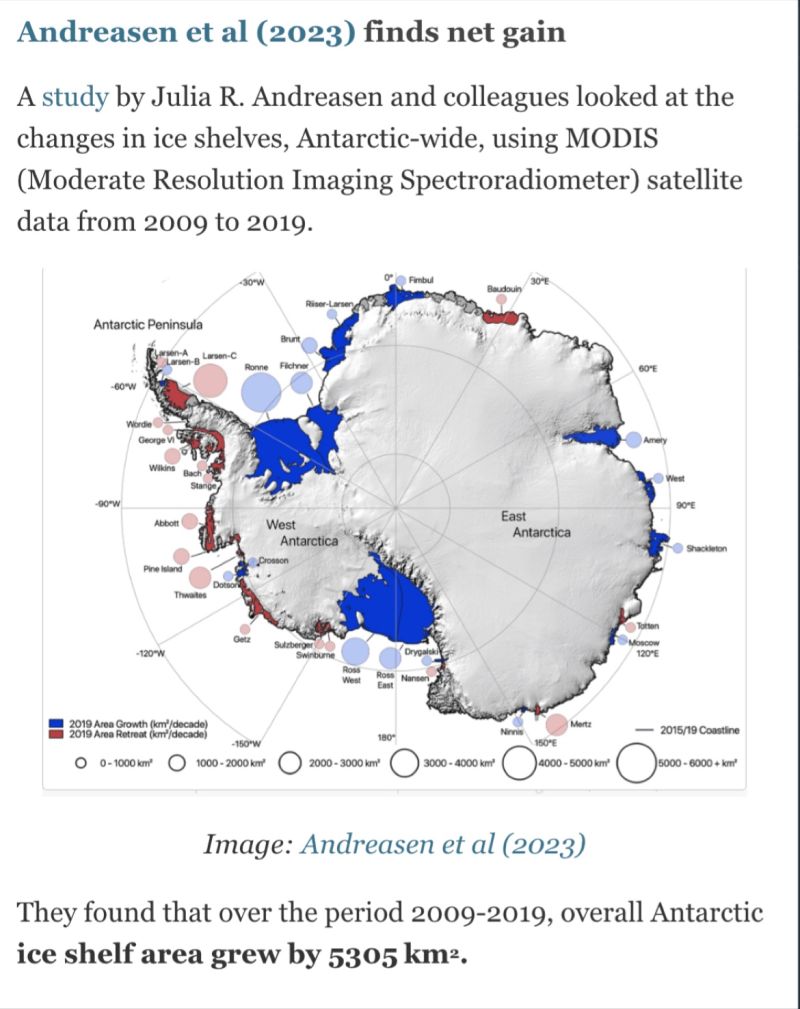
Claim: Ice in the arctic, Greenland and Antarctic is melting at an alarming rate.
Fact Check: The polar and glacial ice varies with multidecadal cycles in ocean temperatures. Current levels are comparable to or above historical low levels. Arctic ice returned to higher levels with a very cold winter in 2019/20. Ice was highest level since 2013. See details here . See update here on the AMO, PDO ocean cycles, the Solar cycles and Arctic temperatures. See here how the South Pole had its coldest winter on record last season (with readings averaging -78F at the South Pole Vostok station!). Records began in 1957 here. Note the polar ice is this season (2021/22) is the 16th lowest on record with a nice rebound. NSIDC continues to hide data before 1979 which shows the changes are cyclical.
The alarmists jump on any yearly anomalies if they suit their theories. See the latest claims here. See the real story here and here. See the Alaskan winter temperature extremes that are characteristic of La Ninas with long brutal cold spells and warm spikes. The media ignore the extreme cold but focus on the warm days shown here. Also see the failures of the arctic’s demise in this post on “Is the Arctic Ice to Disappear?” in Human Progress here. See how the polar bears are thriving even in the warmer periods here.
See Tony Heller’s check on NYT’s Paul Krugman’s latest flawed article on the heat and Norway warmth.
See this analysis of Antarctic ice cover which has increased.
Fact check as of: 01/17/24
----------
Claim: Climate change is endangering food supply.
Fact Check: The vitality of global vegetation in both managed and unmanaged ecosystems is better off now than it was a hundred years ago, 50 years ago, or even a mere two-to-three decades ago thanks in part to CO2. A greening of the planet has resulted and the Sahara desert has shrunk by 8%. CO2 has reduced the vitality of plant life and reduced the water need. A greening of the planet has resulted and the Sahara desert has shrunk by 8%. CO2 has reduced the vitality of plant life and reduced the water need. See the update here. See also in Science how growing forests provide conflicting effects on the temperatures here. See Patrick Moore’s interview here.
Fact Check as of: 09/26/21
----------
Claim: Carbon pollution is a serious and growing health hazard.
Fact Check: The term “carbon pollution” is a deliberate, ambiguous, disingenuous term, designed to mislead people into thinking carbon dioxide is pollution. Thanks to the use of clean burning natural gas and other measures, the amount of particulate matter and other criteria pollutants identified by the EPA have declined over 77% and are well below the standards set. The United States had in 2020 the cleanest air in the world according to NASA and the World Health Organization (WHO). See details here. See this detailed scientific proof that Particulate Matter in Indoor/Outdoor Air Does NOT Cause Death here. See here the real story in California where the governor is pushing efforts to shut down reliable energy sources to allegedly save lives here.
Fact Check as of: 05/09/24
----------
Claim: Rising atmospheric CO2 concentrations are causing ocean acidification, which is catastrophically harming marine life.
.
Fact Check: Ocean acidification (really only slightly reduced alkalinity) is often found to be a non-problem, or even a benefit. Numerous scientific studies have demonstrated the robustness of multiple marine plant and animal species to ocean acidification when they are properly performed under realistic experimental conditions. See more here. See also Peter Ridd’s recent finding of a New Record High Coral Cover of the Great Barrier Reef here.
Fact Check as of: 02/03/19
----------
Claim: There is a 97% Consensus of the world’s scientists that climate change is serious and man-made.
Fact Check: The claim of a 97% scientific consensus is a contrived fiction. CO2 is not a pollutant but a beneficial gas, particulate matter is. But as shown above, small and large particulate matter is not an issue. As also shown above all the claims of dangerous effects on the climate are also shown to be exaggerated or outright falsifications. See details here.
Fact Check as of: 11/22/22
----------
Each section details claim and links to a detailed scientific analysis with supporting graphics and links.
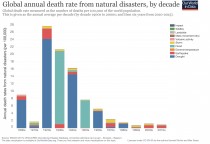
See how the global deaths related to all the extremes have declined dramatically the last century.
See Professor Ole Humlum’s review or the State of the Climate using real data here:
Professor Ian Plimer here on Green Murder here
See a 120 years of climate scares here.