

By P Gosselin on 13. December 2017
The Sun in November 2017
By Frank Bosse and Prof. Fritz Vahrenholt
(Translated and edited by P Gosselin)
In November the sun was unusually quiet with respect to activity. The observed sunspot number (SSN) was merely 5.7, which is only 14% of what is typically normal for month number 108 into the cycle. The current cycle number 24 began in December 2008. The sun was completely spotless 19 of 30 days in November.
At the end of the month some activity appeared, but only at a very low level. The following chart depicts the current cycle’s activity:
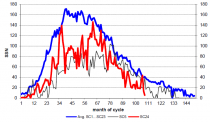
Figure 1: The monthly SSN values for the current solar cycle 24 (red) 108 months into the cycle, the curve for the mean of the previous 23 cycles (blue), and the similar solar cycle number 5 (black). Enlarged
The next chart shows a comparison of all observed solar cycles thus far:
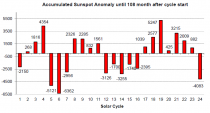
Figure 2: The monthly accumulated anomalies of the cycles up to 108 months into the cycle. Cycle number 24 has taken third place for the most inactive. Enlarged
Icecap Note: The ability with today’s advanced technology to see the smallest spots or pores probably inflates the number of spots and diminishes the number of spotless days.
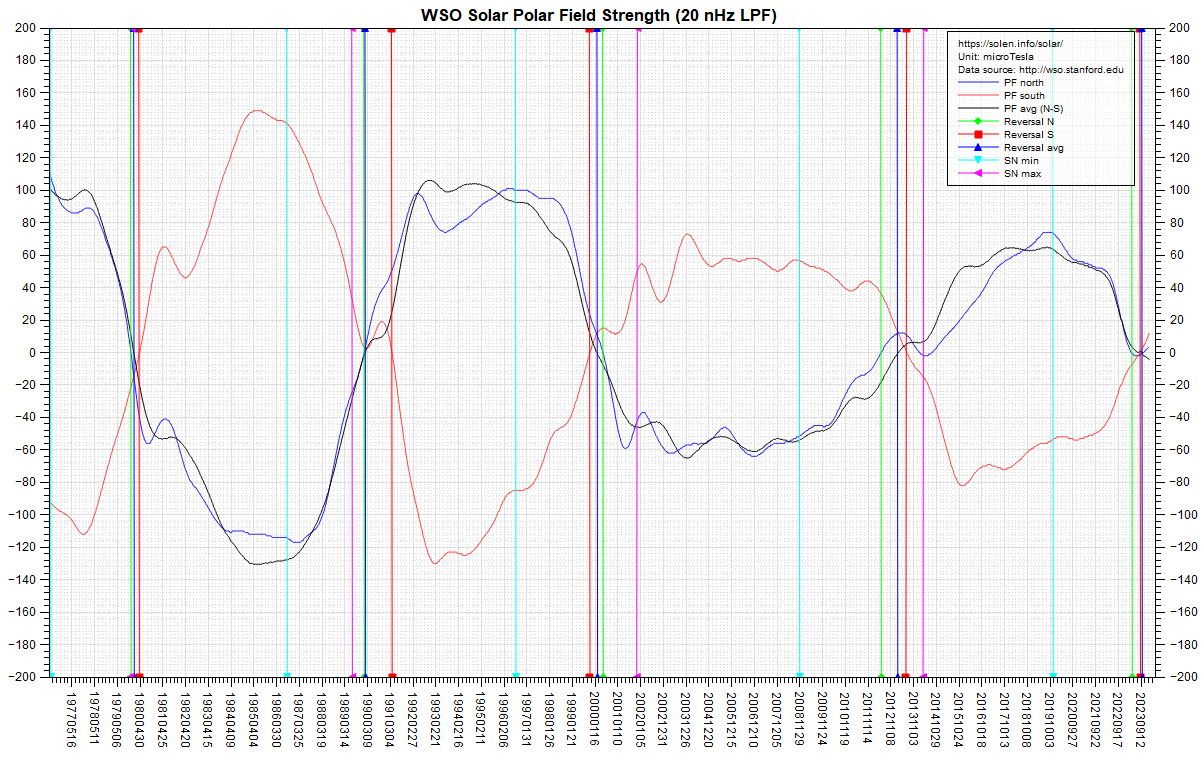
The situation thus remains unchanged: such a weak solar cycle has not been witnessed in 200 years. It is anticipated with quite high certainty that also the upcoming solar cycle number 25 will be about as weak, because the sun’s polar fields are about as strong as they were during the minimum between cycle number 23 and cycle number 24.
The very weak solar north pole so far has recovered significantly over the past few months since June. What this means now and for the future can be seen graphically at the chart posted here. You can find the latest information at www.solen.info/solar.
LaNina is here
An update to our last post here is surely of interest. We were sure of a La Nina by the end of December, and in the meantime the Australian Bureau of Meteorology officially announced a La Nina in its most recent bulletin. The current model forecast shows continued falling sea surface temperatures along the equatorial eastern Pacific until about February, 2018:
Figure 3: The model for El Nino/La Nina in the Pacific, Source: NOAA. All forecasts point to a moderately strong La Nina event until spring. A powerful La Nina such as the one observed in 2011/12 is currently not projected by the models (which incidentally did not even forecast a La Nina just a few months ago). Enlarged
The impacts on global temperatures lag behind by about 3 to 4 months, and so we should expect a La Nina dip by spring.
By Joseph D’Aleo, CCM, AMS Fellow
CLIMATE MODELS
Climate models used operationally for monthly and seasonal forecasts and for long term climate forecasts have a serious warm bias that make them not trustworthy.
MONTHLY/SEASONAL CLIMATE MODELS
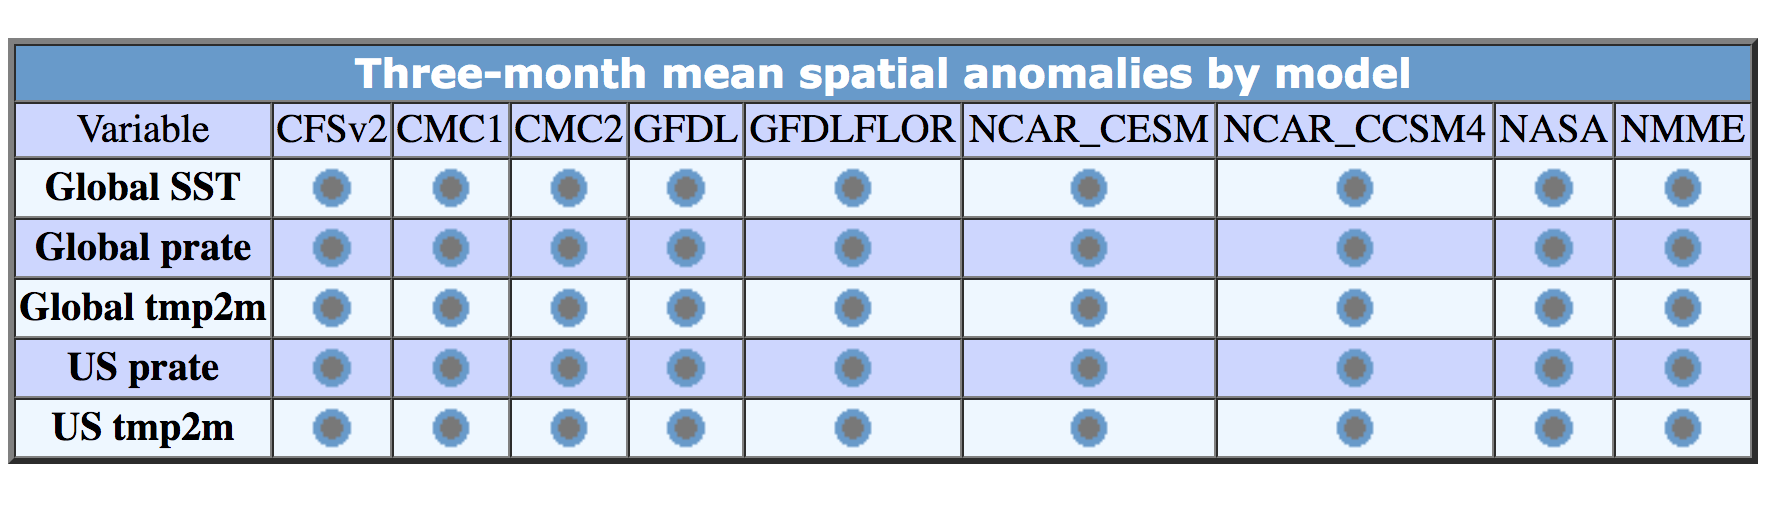
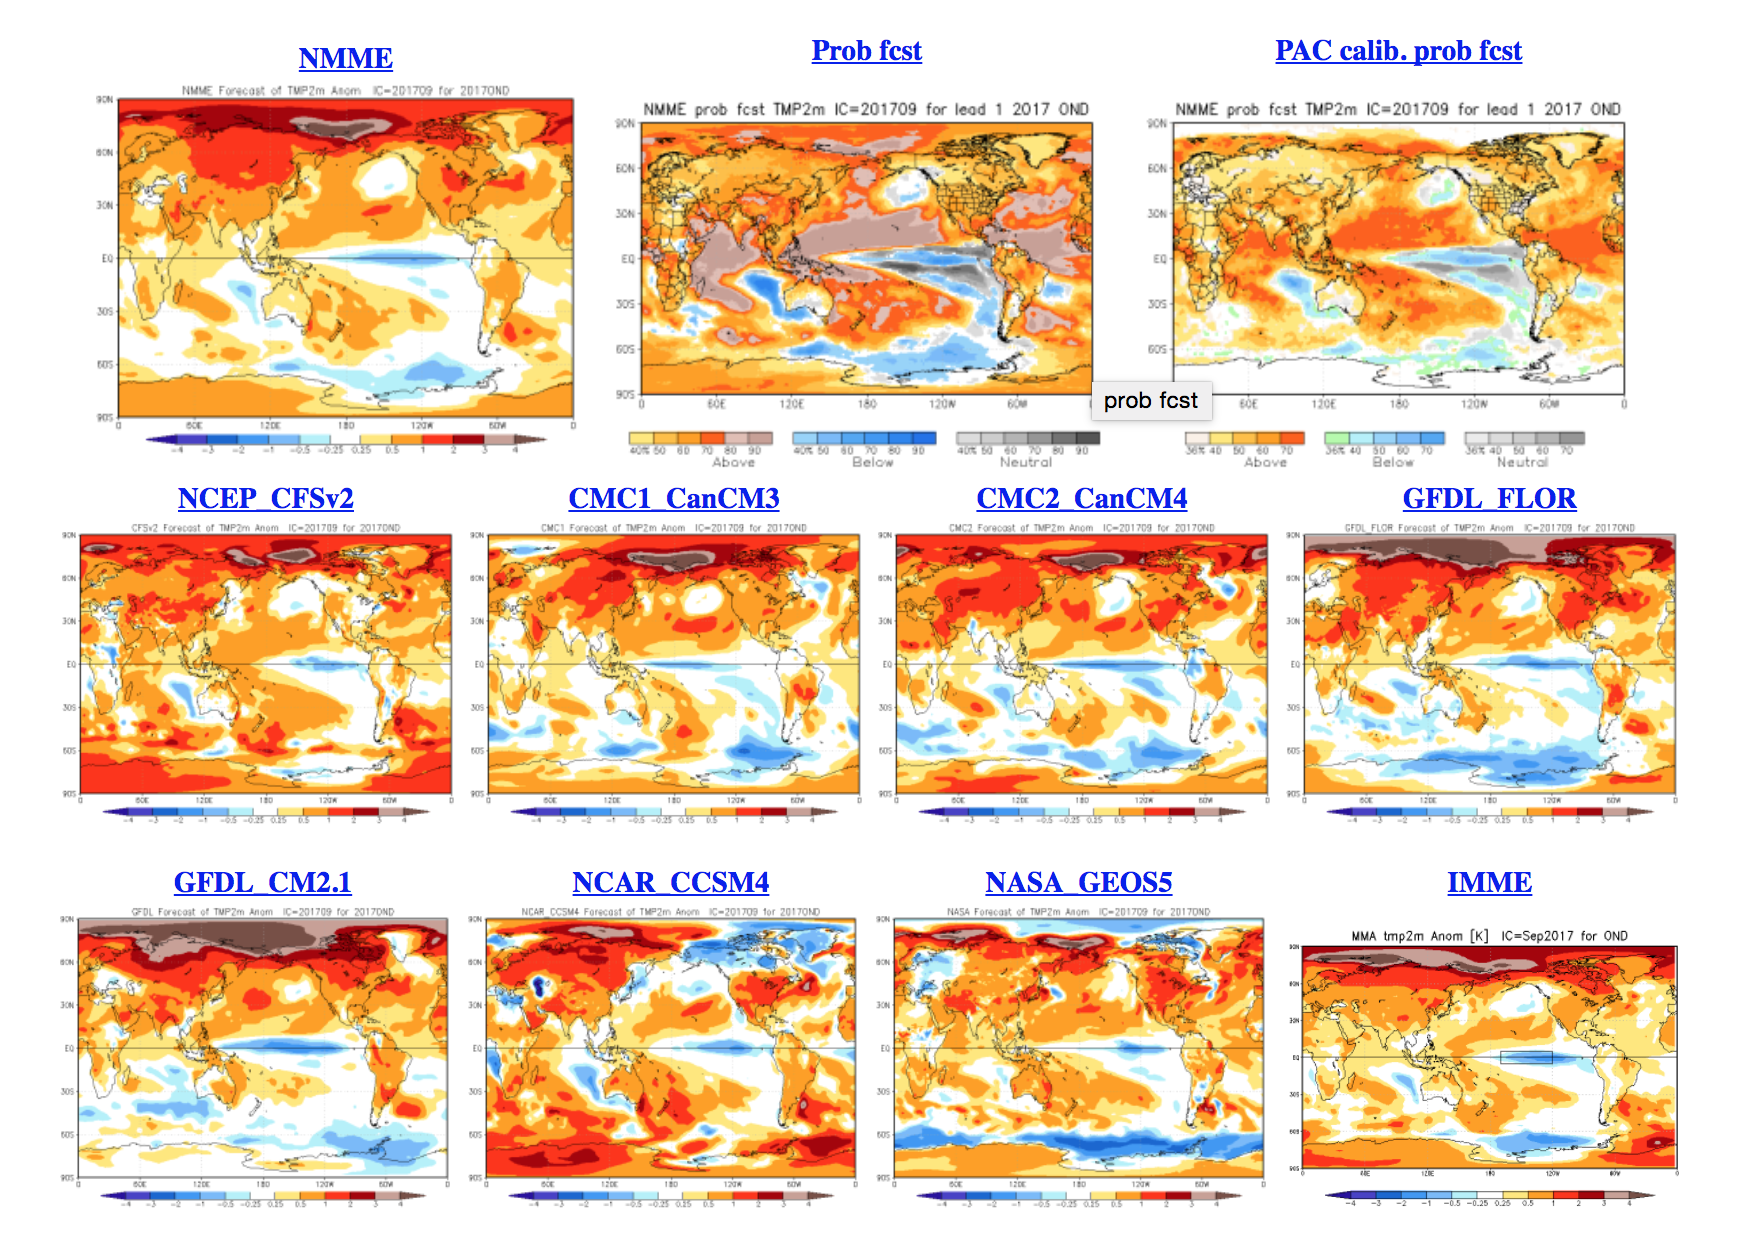
These are models or model ensembles that are run monthly or in some cases even updated multiple times a day that look at upcoming months and 3-month seasons as far as 15 months into the future. Unlike the operational models used by forecasters for the daily forecasts out a week or two, these models are coupled atmospheric/oceanic models which mean they allow the ocean anomalies to change as the atmosphere does and vice versa. The operational shorter range models don’t need to do that as the ocean changes slowly on those time ranges. The new NNME model is an 8 model blend of forecasts by month and seasons.

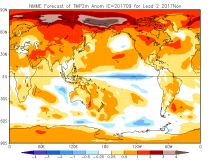
Here are what the component models and the blend looked like for November from October.
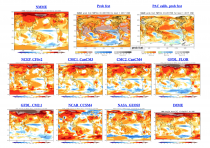
This was a close up look at the blended forecast for November from October. For land, there is only a small speck (the size of Queens) that is below normal in east central Africa.
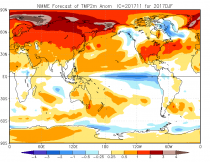
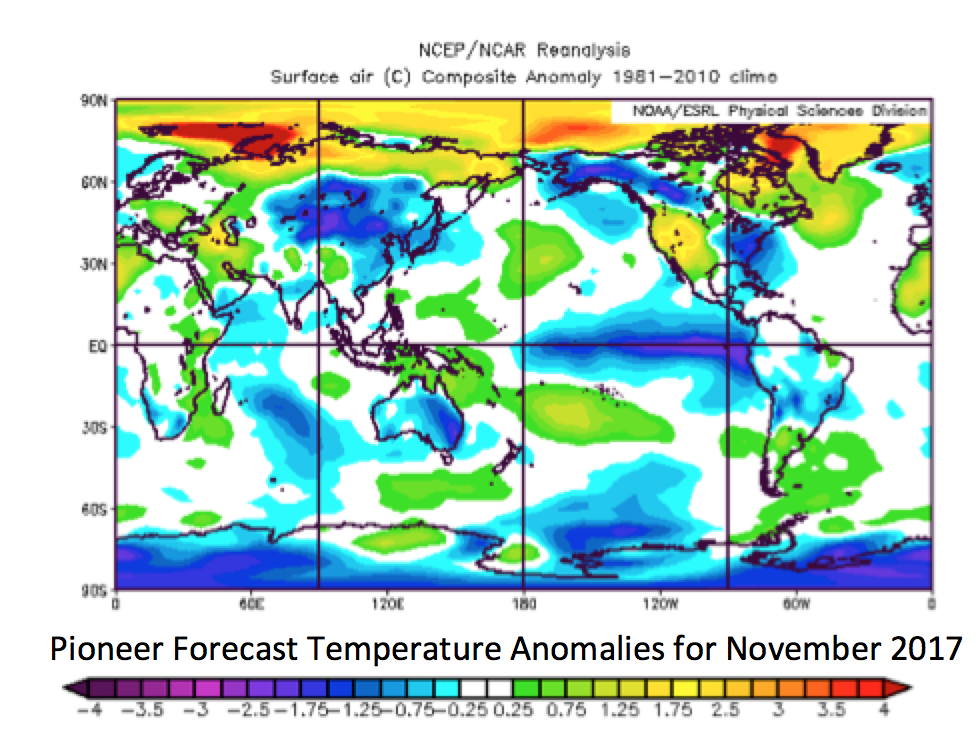
Here is the actual November anomalies (with two days to go). Cold covers most of South America, Africa, eastern Australia, northern India, eastern Asia, Europe and central North America.
_thumb.png)
Here is a forecast from WeatherBELL’s Pioneer statistical model with 24 inputs (solar, ENSO other oceanic and atmospheric) for November. It is not perfect but had the right idea most places.
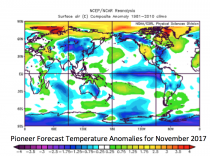
We hear that all the climate modelers need is faster computers so they can run the models in higher resolution. I think that just will produce higher resolution garbage until they do a better job including natural factors and oscillations etc.
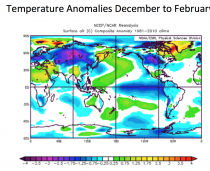
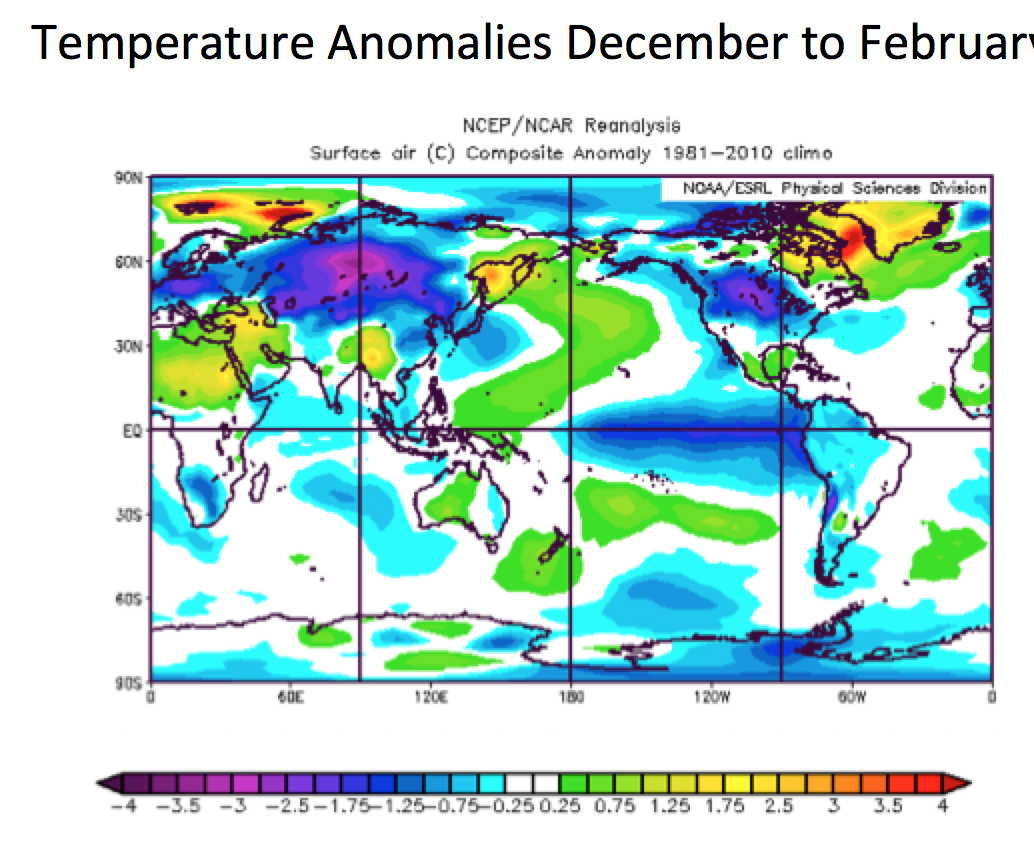
BTW, here is what our statistical model suggest for this winter:
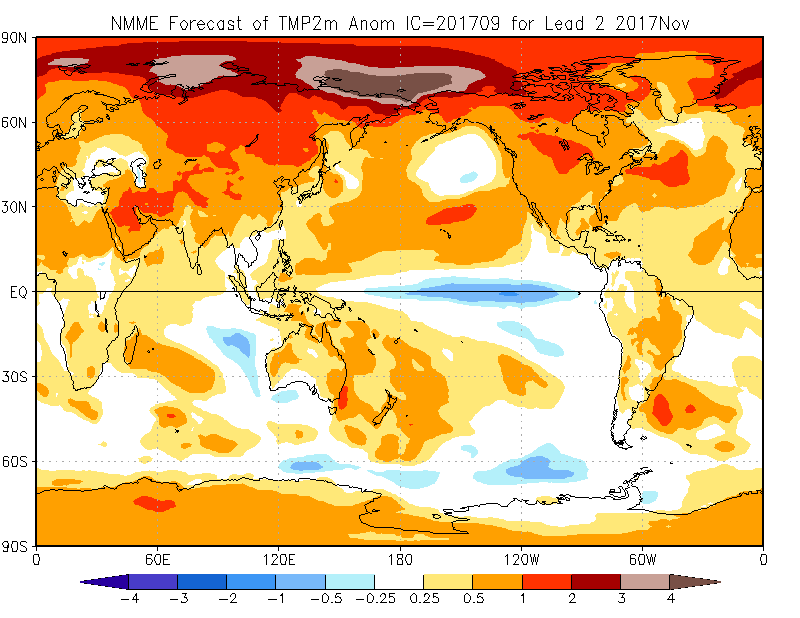
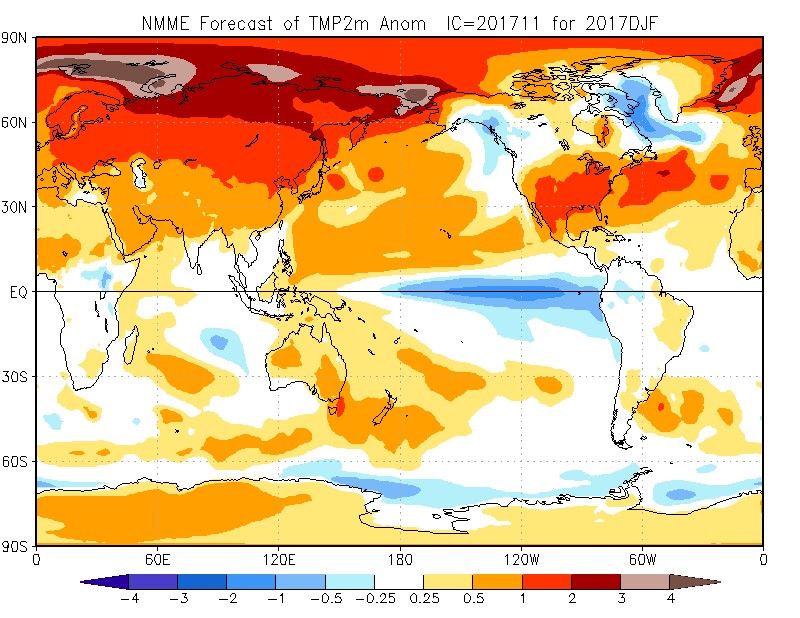
Here is what the NNME blend says
--------
ULTRA LONG TERM CLIMATE MODELS
These models run out many decades into the future and have a strong input from greenhouse gases but do not properly account for solar and natural ocean cycles.
John Christy writes about these models in testimony to congress.
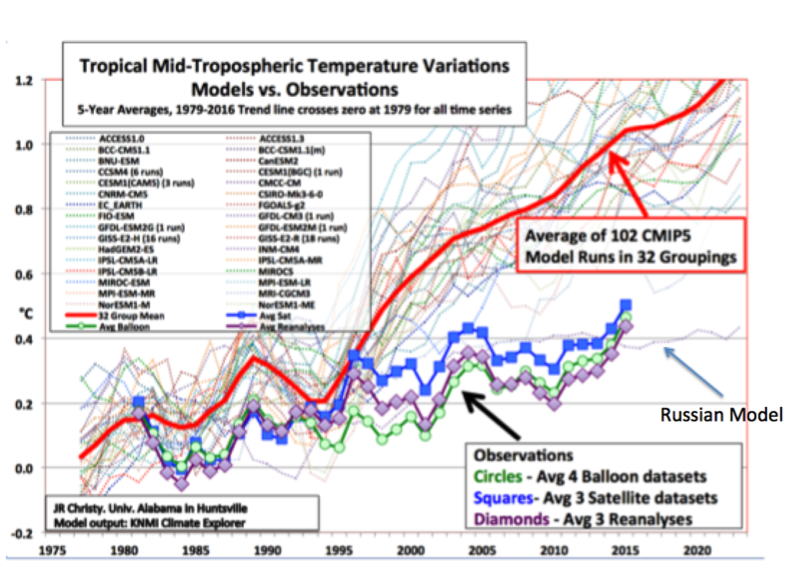
“When the “scientific method” is applied to the output from climate models of the IPCC AR5, specifically the bulk atmospheric temperature trends since 1979 (a key variable with a strong and obvious theoretical response to increasing GHGs in this period), it can be demonstrated that the consensus of the models fails the test to match the real-world observations by a significant margin. As such, the average of the models is considered to be untruthful in representing the recent decades of climate variation and change, and thus would be inappropriate for use in predicting future changes in the climate or for related policy decisions.
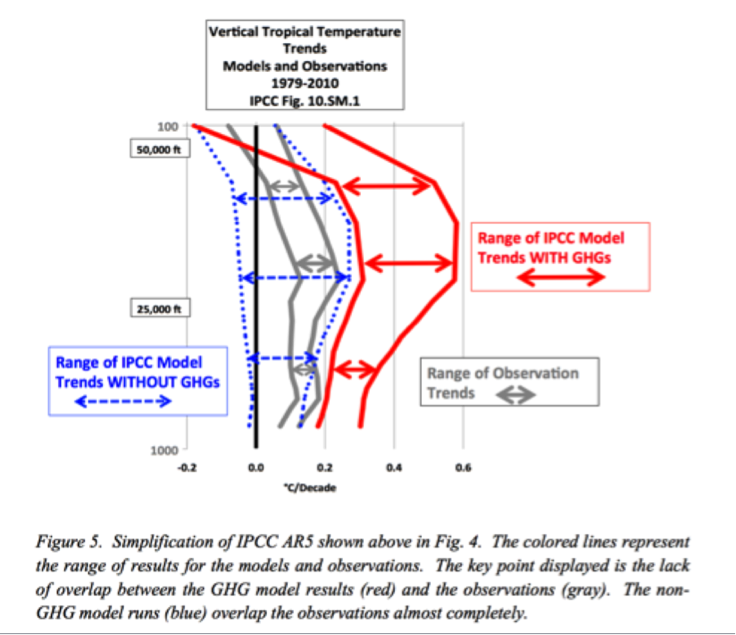
The IPCC inadvertently provided information that supports this conclusion by (a) showing that the tropical trends of climate models with extra greenhouse gases failed to match actual trends and (b) showing that climate models without extra greenhouse gases agreed with actual trends. A report of which I was a co-author demonstrates that a statistical model that uses only natural influences on the climate also explains the variations and trends since 1979 without the need of extra greenhouse gases. While such a model (or any climate model) cannot “prove” the causes of variations, the fact that its result is not rejected by the scientific method indicates it should be considered when trying to understand why the climate does what it does. Deliberate consideration of the major influences by natural variability on the climate has been conspicuously absent in the current explanations of climate change by the well-funded climate science industry.” U.S. House Committee on Science, Space & Technology 29 Mar 2017 Testimony of John R. Christy
When greenhouse climate models fail, there is no effort to rethink the theory. Instead agencies responsible for the data, search for and often find reasons to adjust the data to fit model projections.
All data today is adjusted with models with a goal of addressing data errors, changes in location or instrumentation or addressing changing distribution or to fill in for missing data or station closures. Once you start this adjustment process, it becomes increasingly possible to the find ways to mine from the data the desired results.
With the climate models there is an increasingly large divergence with balloon, satellite and surface reanalysis data sets the last 20 years. The one model that follows best the temperature is a Russian model that has roughly half the greenhouse forcing and improved ocean modeling.
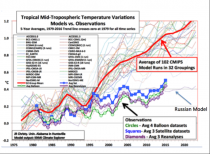
Enlarged
John Christy 2017 has shown models without extra greenhouse warming agreed perfectly with atmospheric (tropical) observations.

.png)
John Christy noted: “Incredibly, what figure 5 shows is that the bulk tropical atmospheric temperature change is modeled best when no extra GHGs are included - a direct contradiction to the IPCC conclusion that observed changes could only be modeled if extra GHGs were included.
See Tim Ball and Tom Harris’s piece on ”Would you bet your paycheck on a weather forecast?” - UN climate forecasts are consistently high… consistently wrong ... and used to drive policy
Update: See Gordon Fulks’s ‘Climate Science Special Report’ Great Science Fiction? - Poor Science Fact! here
See how the previous cooling that climatologists all agreed on in the 1940s to 1970s, was eliminated to support the claim that CO2 was the only control knob (eliminating natural cycle in this excellent summary and paper review by Pierre Gosselin at Not a Lot of People Know That.
By Joe Bast
The Climate Science Special Report, “volume one of the Fourth National Climate Assessment,” was released a few minutes ago. The entire report can be found here.
But in August the Trump administration disbanded the interagency committee that was working on the report.
Not sure why it was nevertheless released..probably the deep state at work. Here were my reactions to this report, from my earlier review of the draft back in August.
Scientific Critique of USGCRP’s 2017 Climate Science Special Report
The U.S. Global Change Research Program (USGCRP) is a joint program of 13 U.S. national government agencies charged with developing a program to “understand, assess, predict, and respond to” global climate change. It produces reports to Congress every four years titled “National Climate Assessment.” The three reports released to date have all exaggerated the amount of global warming, the human role in that warming, the negative impacts of the same, and the certainty of the science surrounding the causes and consequences of climate change. For example, a team of climate scientists led by Patrick Michaels of the Cato Institute said of the Third National Climate Assessment:
“This National Assessment is much closer to pseudoscience than it is to science. It is as explanatory as Sigmund Freud. It clearly believes that virtually everything in our society is tremendously dependent the surface temperature, and, because of that, we are headed towards certain and inescapable destruction, unless we take its advice and decarbonize our economy, pronto. Unfortunately, the Assessment can’t quite tell us how to accomplish that, because no one knows how.”
The latest (June 28) draft of the Fourth National Climate Assessment is similarly flawed. This brief critique makes ten points which track the content and organization of the assessment:
1. The report is a legacy product of a political regime that captured and “weaponized” this government agency to advance its agenda, much as it did to the IRS, Justice Department, and other departments. The report was written by hold-overs from the Obama administration, and represents only the very biased and politicized perspective of a small clique of government scientists on a complex issue.
2. The report fails to provide an objective and comprehensive review of the available literature. Contrary to media reports, the report was not made available to respected climate scientists for peer reviewed. Several scientists report that their requests for drafts were rejected. [Soon and Happer, others?] The final draft shows no evidence of being informed by the efforts of critics of the Obama administration’s legislative agenda or even a single reference to the multiple reports of the Nongovernmental International Panel on Climate Change (NIPCC).
3. The report relies on past reports by the United Nation’s Intergovernmental International Panel on Climate Change (IPCC), which the Trump administration properly rejects. The report refers to the IPCC’s 2013 report as “rigorously-reviewed international assessments,” when in fact the IPCC is controversial, scandal-ridden, and its procedures fall far short of the requirements of the Data Quality Act. [Why Scientists Disagree, pp. 38-44]
4. The report’s most frequently quoted conclusion, “that it is extremely likely that human influence has been the dominant cause of the observed warming since the mid-20th century,” is only a restatement of the opinions of activists and advocates in the field of global warming, and not a statement about the underlying science, which remains incomplete and uncertain. This is the same flawed reasoning and semantic games as used by the IPCC to make the same statement. It is not a statement of scientific fact, but rather of “some experts’ opinions” without any basis in probability analysis or scientific forecasting. [InterAcademy Council Audit, p. 61ff]
5. The report denies the existence of the “pause” in global warming during the past 18 years or longer, something even the IPCC admits. It cites manipulated and unreliable databases when superior databases are readily available, apparently in an effort to once again “hide the decline.”
6. The report ignores at least 27 peer-reviewed articles saying climate sensitivity is lower than the amount assumed by IPCCC and EPA. Climate sensitivity is the amount of temperature change likely to result from a doubling of the concentration of CO2 in the atmosphere from pre-industrial times. If the climate is less sensitive to CO2 than we thought four years ago, this report ought to reflect that fact. [Cited in Monckton, Soon, Legates, and Briggs 2015; reproduced in Why Scientists Disagree pp 66-69]
7. The report denies extensive evidence that weather is not becoming more extreme over time and physical evidence explaining why it will be less extreme in a warmer world. It recites Al Gore’s litany of extreme weather predictions even though IPCC and independent scholars have thoroughly debunked it. [Chapter 7 of CCR-II: Physical Science]
8. The report repeats false claims about the loss of arctic sea ice - falsifying trends and causes and making false forecasts - in order to support its narrative of catastrophic man-made global warming. Arctic sea ice is not at historic low levels, it varies naturally due to known and unknown external forcings and internal variability, and it is not evidence of a human impact on climate. [Chapter 5 of CCR II: Physical Science]
9. The report misrepresents scenarios and computer-based simulations of future climate conditions as scientific forecasts of future climate conditions, when in fact it is well known among scientists that future climates cannot be predicted. Prof. Scott Armstrong, the world’s leading authority on scientific forecasting, and coauthors have shown conclusively that the predictions made by the IPCC, EPA, and other government agencies are merely the opinions of some experts, not scientific forecasts, and cannot provide a reliable basis for public policy.
10. The report misrepresents sea-level rise and changes in ocean pH levels, portraying both as dire catastrophes resulting from man-made global warming, when in fact there is considerable evidence that sea level has not accelerated from its historic rates and considerable evidence that higher pH levels have positive as well as adverse effects on ocean life. [Chapter 6 of CCR-II: Physical Science]
Joe
Joseph Bast
Chief Executive Officer
The Heartland Institute