


UPDATED
Today is Ground Hog Day. In the east, the rodent may be met with shotguns instead of flashing cameras.
Snow just keeps on coming. Like in the movie, when the alarm goes off, residents seem to reliving the events of yesterday or last week or the week before. They put on their boots and reach for the shovel or snowblower. One storm today and another tonight and tomorrow, for some another Saturday. After a half foot of snow or some ice today, the main storm coming out of the southern plains and midwest where it produced an ice storm in Texas where many are trying to converge on Dallas for the Super Bowl. Further north its blizzard conditions from Oklahoma, Missouri to Chicago,
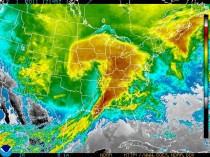
then becomes a weakening low pressure bringing ice and snow further east, again.
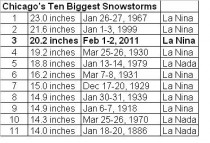
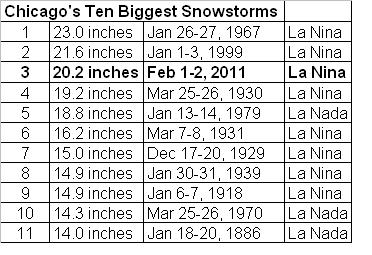
In Chicago as of 10:30am CST the storm ranked in 3rd place (20.2 inches) but it was still snowing - wind gusts overnight reached 70mph on the Lakefront with 8 foot drifts in the metro area reported!
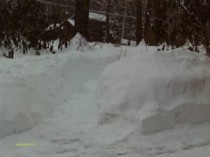
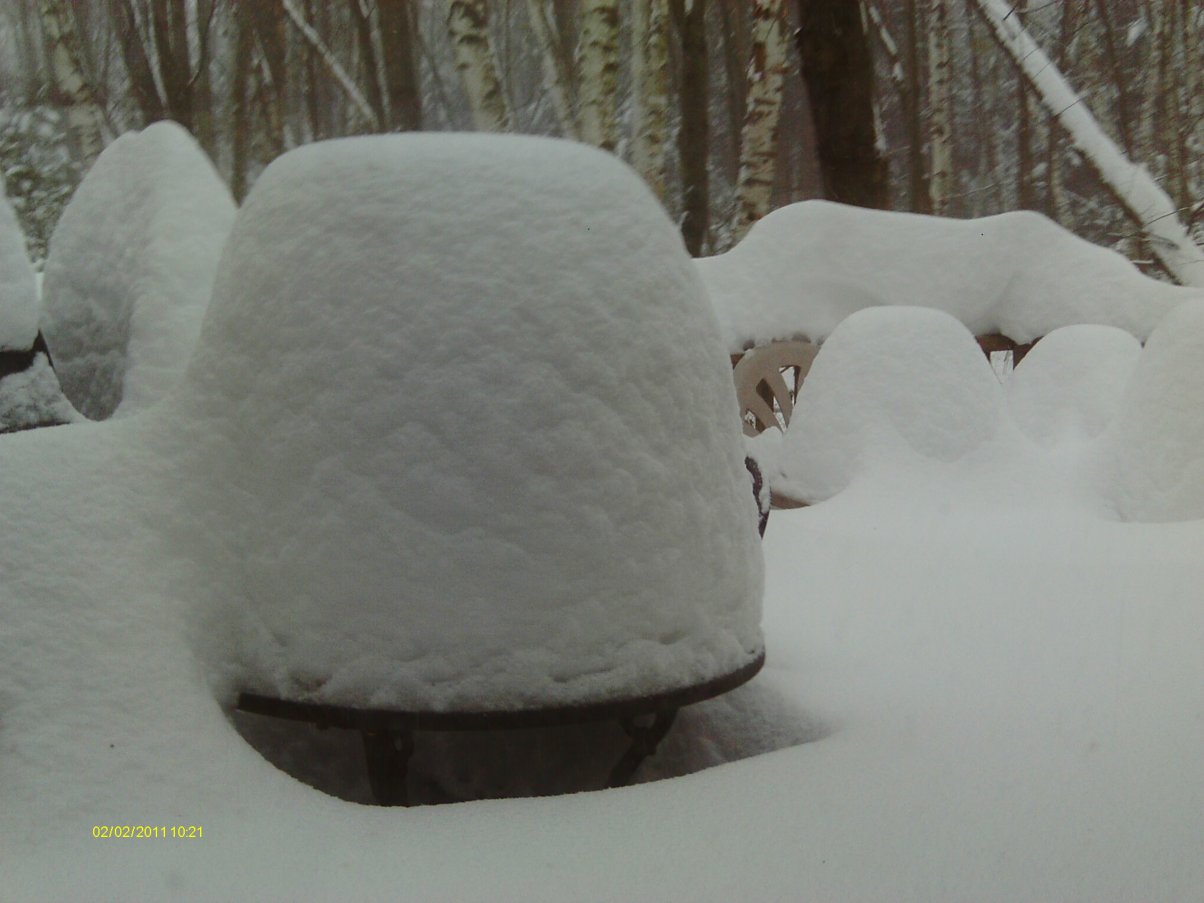
We will have a recap with pictures of the northeast snow. See story below why this storm will be especially worrisome in the east already burried under 2-3 feet of snow. Here is a photo before the Ground Hog Day storm - in southern New Hampshire. 36” on the ground with maybe 12” more coming. 6” fell today as a preview.
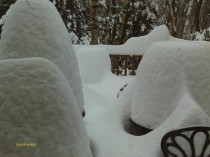
This morning after another dump, the back porch looks like this:

See Minnesotans for global Warming epic ‘If We Had Some Global Warming’ video
And more on the M4GW Youtube site . DVDs are available. Note: New video coming soon.
See more on the snow, how the alarmists have changed their tune the last two years and also the eco clown at the Union of Ever Concerned Scientists try and convince the faithful on MSNBC that the snow is do to carbon ‘pollution’ in this blogprof post.
By Joseph D’Aleo, CCM
Starting with post Christmas blizzard, the northeast has had snowstorms weekly. Midwinter snow totals already exceed full season averages by a significant amount. Our friends in the National Weather Service reports so far this season (through January 29th):
Hartford, CT 71.2 inches
Worcester, MA 61.6 inches
Boston, MA 60.3 inches
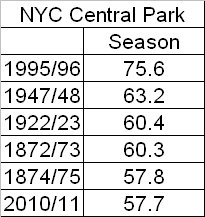
New York City Central Park 56.1 inches
Bridgeport, CT 54.4 inches
In New York City with two more months of winter ahead, the season already ranked 6th place all-time.

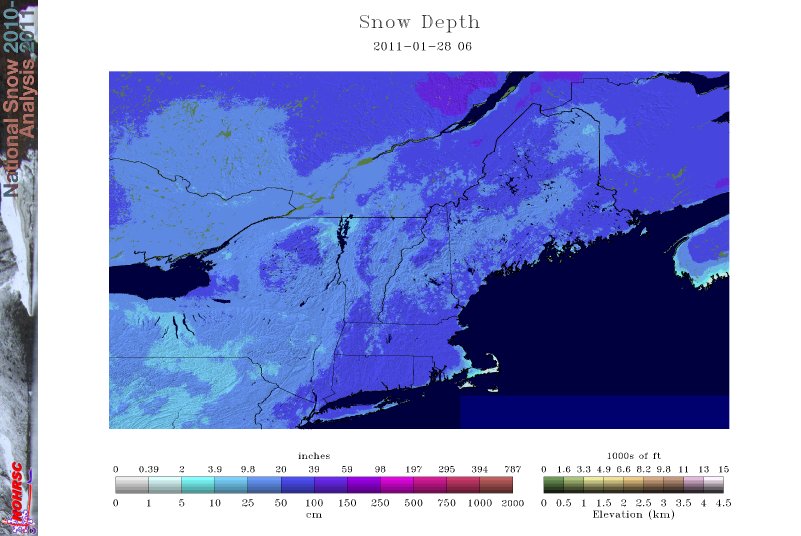
A general 10 to 30 inches of snow depth remains on the ground...with the deepest snow depth values across Connecticut.
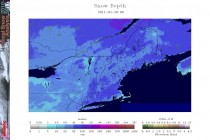
Enlarged here.
3 to 5 inches of snow water equivalent is in the current snowpack across the area. This results in a tremendous amount of weight per square foot.
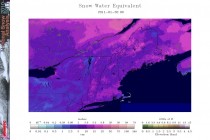
Enlarged here.
There have already been reports of collapsed roofs due to the weight of the snow...and with the threat of yet another significant storm system expected during the middle of this week...now is the time for residents and building owners to take preventative action to safely remove snow from flat roof tops, decks, etc.
Recall the collapse of the Metrodome in Minneapolis earlier this winter captured by a FOX camera.
Between 2 and 4 tenths of liquid equivalent is forecast from late Monday night through Tuesday in the northeast...mostly in the form of snow.
There is the potential for significant (1-2 inches) liquid equivalent from Tuesday night into Wednesday night. This should be mainly in the form of freezing or frozen precipitation across the interior...and a wintry mix to rain across coastal areas. Based on this there is also the potential for minor urban/poor drainage flooding across coastal areas… depending on exactly how much of the precipitation falls as rain.
The storm is the same storm that will bring wintry weather all across the nations from the mountains of the west across the Plains, Ohio Valley and southern Great Lakes. Hard hit places will include the Central Plains northeast to Chicago (areas around the ‘windy city’ could have 20 inches plus - the all-time record for a snowstorm in Chicago is 23.0 inches on January 26-27, 1967, a La Nina in a cold PDO after a prior El Nino like this year). Ice and snow will make for hazardous travel in many areas into the Ohio Valley and parts of the northeast. One benefit will be the help it provides extinguishing the Oklahoma fires. Though it has been a nightmare at times for travellers, businesses, schools and homeowners, ski areas are having a banner year.
By Richard Keen, PhD
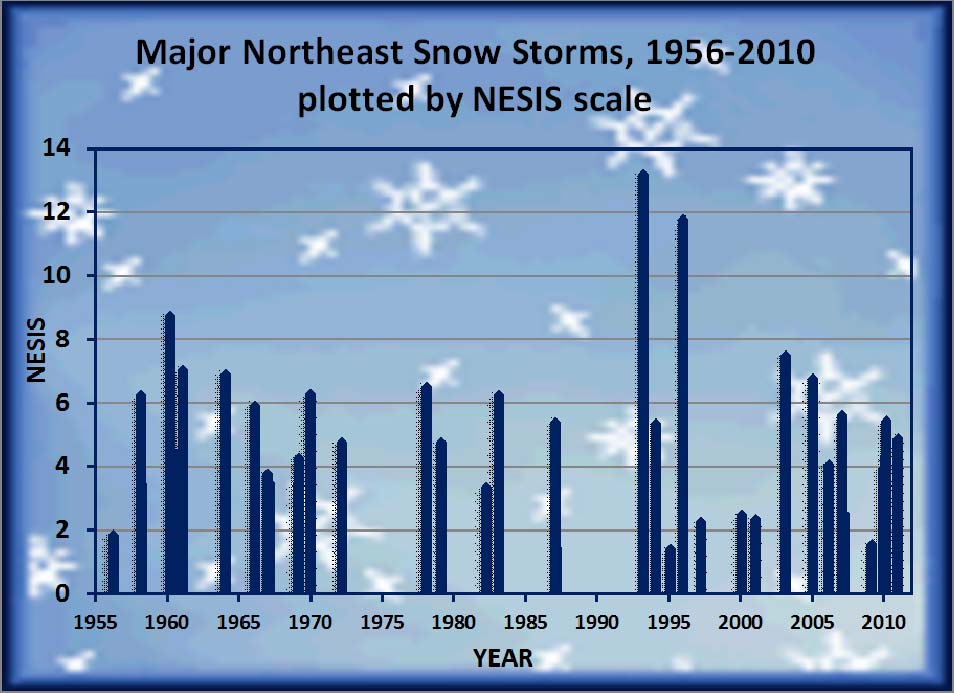
I’m sure by now every snow freak in the Northeast U.S. has pored over the “Billboard Top 40” (actuallY, 41) list of major snow storms since 1955. If you haven’t, go to “The Northeast Snowfall Impact Scale (NESIS)”, posted here.
I’d like to thank our friends at the NWS and NCDC, Paul Kocin, Louis Uccellini, Jay Lawrimore, and Michael Squires, for their work at putting this together. For me it brings back the memories of the great school-closing dumps of my early days in Philadelphia. I “survived” numbers 3, 5, and 6 on the list, and made enough money shoveling neighbors out of numbers 5, 21, and 26 to buy my second telescope. Number 30 left our house without power for five days, during which we ate hot dogs cooked in the fireplace. But enough of the memories. How are today’s kids in the Northeast faring in their quest to earn enough money digging snow to buy themselves telescopes?
To put the storms in a timewise perspective, here’s a chart of each event, plotted by date and NESIS magnitude.
Enlarged here.
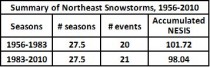
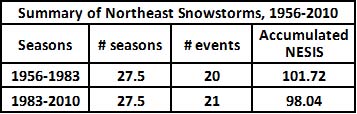
Kocin et al. have simplified the storm magnitudes into categories (1 to 5, with “major” being 3 and above). Anecdotally, only two winters have had three “major” storms, 1960-61 (when I earned my telescope) and 2009-10. Apparently today’s kids are no better or worse off. There’s 55 seasons (54 full winters and two half winters) of storms represented in the Kocin et al. catalog, so I’ve split the record into two halves to see if recent years have had more or fewer of these great snow storms. Results are summarized in the table.
Enlarged here.
The split couldn’t be more even, with 20 storms in the first 27.5 seasons and 21 in the second 27.5 winters. The accumulated NESIS index (sum of the NESIS for the 20 or 21 storms) is almost as evenly split. The implications for climate change are that as far as Northeast snow storms are concerned, there is no change.
I now live in Colorado, where I am the co-op observer for Coal Creek Canyon, 8950 feet up in the foothills west of Denver. An endearing feature of the local climate is the frequent occurrence of 40-inch-plus snow storms. I now have 32 years of snow storm records, and as with the Northeast snow storms, the 40-inch events are evenly split (7 and 7) between the first and last halves of the record. You may read more about the Colorado storms in “Thirty years in the Bull’s-eye: a climatology of meter-class snow storms in the Front Range foothills”, by Richard Keen, 5th annual Hydrologic Sciences Student Research Symposium, University of Colorado, Boulder, April 1-2, 2010, posted here.
Conclusion: there appears to be little or no change in the frequency of major snow storms over the past 30 to 55 years, at least in the Northeast U.S. and in the Front Range foothills of Colorado.
Read post here.
Olivier Lejeune, Platts, GWPF
Colder winters could become the norm in Europe over the next 20 to 40 years, US-based forecaster Weather Services International said Tuesday.
“We have recently noticed a change in [weather] patterns back to what we had in the 1950s and 1960s in Europe… We’ve had three cold winters in a row in the UK,” WSI’s chief meteorologist Todd Crawford told Platts.
“We believe there is a strong likelihood that it’s going to hang around for the next 20 to 30 years.”
If true, the findings could have important implications for the European energy markets, where demand typically increases during winter because of higher heating and lighting requirements.
Peak electricity demand hit an all-time record in France at the beginning of December, and was near its historic record in the UK, amid temperatures that were more than 10 degrees Celsius below the seasonal norm.
Natural gas and gasoil demand also soared. Behind the freezing temperatures is the North Atlantic Oscillation, a climatic phenomenon that normally sends wind from western European countries to the east, keeping cold air from the Arctic at bay. But in December the current was flowing in the opposite direction, bringing cold Arctic air to western European regions and sending energy demand to fresh highs.
“During the last 30-40 years, the NAO was predominantly positive resulting in much warmer, wetter winters,” Crawford said. “Starting in 2008, however, the NAO has sharply reversed to a much more negative state and the result has been quite notable with three straight cold winters in the UK.”
Weak solar activity

Enlarged here.
WSI said the reversal in the NAO could be due to three factors: recent cyclical changes in North Atlantic ocean temperatures; climate change, which results in warmer Arctic air and sends cold air southward to Europe; and a “weak” solar cycle.
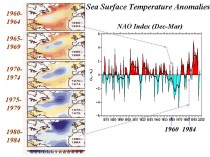
Icecap Note: As we showed in this post here, the North Atlantic Oscillation, an important component of the overall arctic oscillation varies with the ocean temperature tripole in the Atlantic, known as the AMO or Atlantic Multidecadal Oscillation. When the Atlantic is in the warm positive AMO mode as is currently the case, the NAO and AO tend to be more negative.
Enlarged here.
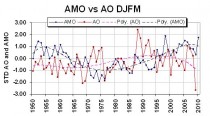
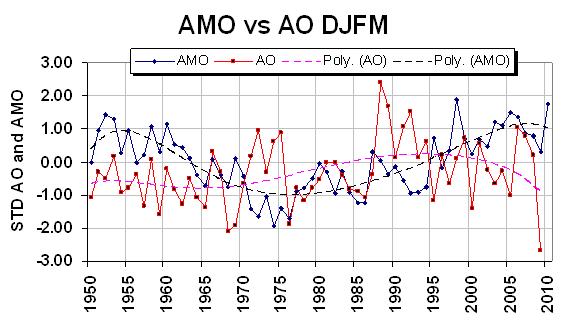
When the AMO is positive with warm water in the North Atlantic and in the Tropical Atlantic, the NAO was mainly negative (1960s). When the North and Tropical Atlantic turned cold in the 1980s, the NAO was mainly positive (data in chart above through 1999). Note the AMO flipped positive (warm) in 1995 with a big dip in the NAO. See the inverse relationship of AMO with the AO in the graph below. Data for both is averaged for the December through March periods and standardized.
Enlarged here.
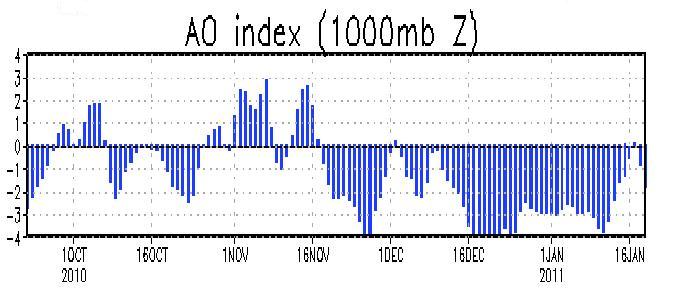
So far this late fall and winter as we saw all last winter, the AO has been strongly negative with readings as low as 5 standard deviations in December.

Enlarged here.
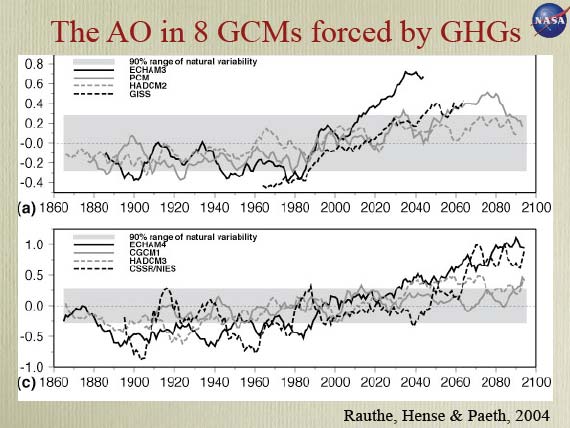
The greenhouse models all predict an increase in the frequency and strength of the positive arctic oscillation in time, most (2/3rds) exceeding the 90% range of natural variability.

Enlarged here.
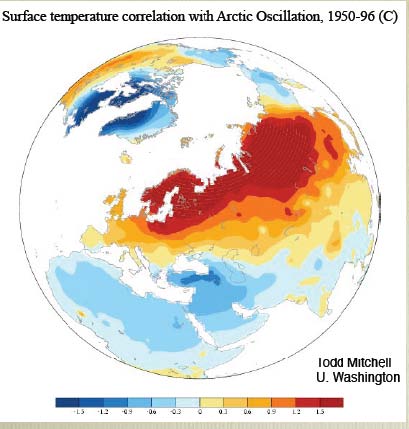
A positive AO would lead to increasing temperatures in the Northern Hemisphere continents with colder than normal air trapped in the arctic down to the northern parts of Canada and Hudson Bay. The following from Mitchell shows the warmth over Eurasia in the positive AO phase.

Enlarged here.
The opposite has been the case the last few years and the alarmist scientists now claim that is to be expected with global warming. Their theory is unfalsifiable as they just change their tune, claim voctory and like the spoiled child, take the ball and go home.
Crawford said all factors were potentially at play, but that reduced solar activity may turn out to the main culprit. “Our current solar cycle has been the quietest in at least 70 years, and there is some valid concern that there may be significant cooling going forward,” he said.
“We feel that the NAO has entered a cyclical negative phase, and will likely be predominantly negative for the next 20 to 40 years. This doesn’t mean every winter will have negative NAO, just most of them,” he added.
Talking to Platts Tuesday, UK national weather service the Met Office said: “There is a large amount of variability in the NAO… any long-term predictions of the NAO are speculative.” “That said, there are avenues of research being pursued to improve our understanding and ability to make such predictions in the future.”
Electricity traders said Tuesday the colder-than-usual temperatures seen last December were still being treated by market operators as an anomaly, and would unlikely result in higher prices next winter.
“That’s interesting… but you certainly wouldn’t trade off information like that,” a trader at a large UK utility said. “It is something that must be
considered going forward,” a second trader said. “But the problem in the past has been that many people state they are an authority on weather, and
actually distinguishing the good from the bad can be quite difficult.”
See post here.
See recent video from M4GW (Minnesotans for Global Warming)
It’s a parody of “I’m a Believer” by the Monkees and written by Neil Diamond.
Their epic ‘If We Had Some Global Warming’ video
See their M4GW Youtube site with an excellent collection of videos. DVDs are available. Note: New video coming soon.
See comic songster Ray Steven’s take on Global warming here.
See Piers Corbyn video here.
Another Eastern Snow - Brutal Winter Assault continuesBy Joseph D’Aleo
Mother Nature for the second year in a row is sending a message to alarmists in the government and the media.
Another snowstorm has swept across the nation and focused its fury on the northeast corrdior. Last year it was the Mid-Atlantic, the political center that was ground zero. This year ground zero is further north from New York City (the nation’s media center) into southern New England. In Connecticut, Hartford has had the snowiest January and month ever.
Snowcover in the northeast is extensive and deep with 2 feet in many areas (below, enlarged here).

Since Dec. 14, snow has fallen eight times on the New York region - or an average of about once every five days.
In New York City, the third major snowstorm dropped 19 inches, the 8th heaviest snowstorm in history (back to 1869/70).
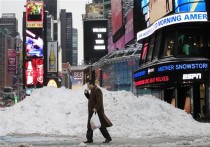
(Times Square, Thursday January 27, 2011 - AP Photo, Mark Lennihan - ABC Eyewitness News)
The post Christmas blizzard brought dropped 20 inches, the sixth heaviest snowstorm. The blizzard paralyzed travel after Christmas. Mayor Michael Bloomberg, who suddenly has become interested in tracking how much snow falls after the city was slow to deal with the post Christmas blizzard, said it was the snowiest January since the city started keeping records, besting 27.4 inches set in 1925.
Earlier in 2010 on February 25-26th, the 20.9 inches was enough to put it in fourth place among Central Park snow events.
A storm on the 10th and 11th of January brought 9.1 inches. So far 56.1 inches has fallen which puts 2011 already in 6th place among all years since snow records began. The 36 inches for the month is just 0.9 inches short of an all-time monthly snow record (set last February). A few clippers the next two days may break that record.
Hartford, Connecticut had 57 inches in January alone (71.2 inches for the season). This was for Hartford the snowiest January on record beating out the 43.1 inches in 1996 and also the snowiest month beating the 45.3 in 1945. See snow pictures from Connecticut here.
More light snow events and continued cold temperatures is forecast the next 5 or 6 days. Aother storm will threaten next Wednesday and Thursday that could move the year into second or third place. This season seems destined to eventually surpass 1995/96.
The media has been trying to find a way to blame global warming for the snow. Actually a rapid COOLING (the UAH January global number may be negative, down almost a whole degree F since the warm peak after the El Nino during 2010) is likely to blame. The cooling the last several months may be the most significant of the satellite record. Clouds and precipitation always result from cooling processes. The cooling, as we have posted, is likely due to a Pacific that has turned cold, a La Nina, continued slow ramp up of feeble solar cycle 24 and a series of high latitude volcanoes that together with a quiet sun and a warm Atlantic helped support high latitude blocking high pressure (a negative Arctic Oscillation - the most negative on record last winter and continued negative most of the first 8 weeks this winter).
This video from last night gives you the flavor of the NYC snow although at one time there was lightning and thunder and near zero visibility snow. The video is a little jumpy. Please send photes or video links to me at jsdaleo@yahoo.com and I will add.
See recent video from M4GW (Minnesotans for Global Warming)
It’s a parody of “I’m a Believer” by the Monkees and written by Neil Diamond.
Their epic ‘If We Had Some Global Warming’ video
See their M4GW Youtube site with an excellent collection of videos. DVDs are available. Note: New video coming soon.
See comic songster Ray Steven’s take on Global warming here.
------------------
Cold Jumps Arctic ‘Fence,’ Stoking Winter’s Fury
By Justin Gillis, New York Times
Judging by the weather, the world seems to have flipped upside down.

A subway station in Brooklyn. While the Northeast shivers, the Arctic has been freakishly warm.
For two winters running, an Arctic chill has descended on Europe, burying that continent in snow and ice. Last year in the United States, historic blizzards afflicted the mid-Atlantic region. This winter the Deep South has endured unusual snowstorms and severe cold, and a frigid Northeast is bracing for what could shape into another major snowstorm this week.
Yet while people in Atlanta learn to shovel snow, the weather 2,000 miles to the north has been freakishly warm the past two winters. Throughout northeastern Canada and Greenland, temperatures in December ran as much as 15 to 20 degrees Fahrenheit above normal. Bays and lakes have been slow to freeze; ice fishing, hunting and trade routes have been disrupted.
Iqaluit, the capital of the remote Canadian territory of Nunavut, had to cancel its New Year’s snowmobile parade. David Ell, the deputy mayor, said that people in the region had been looking with envy at snowbound American and European cities. “People are saying, ‘That’s where all our snow is going!’ “ he said.
The immediate cause of the topsy-turvy weather is clear enough. A pattern of atmospheric circulation that tends to keep frigid air penned in the Arctic has weakened during the last two winters, allowing big tongues of cold air to descend far to the south, while masses of warmer air have moved north.
The deeper issue is whether this pattern is linked to the rapid changes that global warming is causing in the Arctic, particularly the drastic loss of sea ice. At least two prominent climate scientists have offered theories suggesting that it is. But others are doubtful, saying the recent events are unexceptional, or that more evidence over a longer period would be needed to establish a link.
Since satellites began tracking it in 1979, the ice on the Arctic Ocean’s surface in the bellwether month of September has declined by more than 30 percent. It is the most striking change in the terrain of the planet in recent decades, and a major question is whether it is starting to have an effect on broad weather patterns.
Ice reflects sunlight, and scientists say the loss of ice is causing the Arctic Ocean to absorb more heat in the summer. A handful of scientists point to that extra heat as a possible culprit in the recent harsh winters in Europe and the United States.
Their theories involve a fast-moving river of air called the jet stream that circles the Northern Hemisphere. Many winters, a strong pressure difference between the polar region and the middle latitudes channels the jet stream into a tight circle, or vortex, around the North Pole, effectively containing the frigid air at the top of the world.
“It’s like a fence,” said Michelle L’Heureux, a researcher in Camp Springs, Md., with the National Oceanic and Atmospheric Administration. When that pressure difference diminishes, however, the jet stream weakens and meanders southward, bringing warm air into the Arctic and cold air into the midlatitudes - exactly what has happened the last couple of winters. The effect is sometimes compared to leaving a refrigerator door open, with cold air flooding the kitchen even as warm air enters the refrigerator.
This has happened intermittently for many decades. Still, it is unusual for the polar vortex to weaken as much as it has lately. Last winter, one index related to the vortex hit its lowest wintertime value since record-keeping began in 1865, and it was quite low again in December.
James E. Overland, a climate scientist with NOAA in Seattle, has proposed that the extra warmth in the Arctic Ocean could be heating the atmosphere enough to make it less dense, causing the air pressure over the Arctic to be closer to that of the middle latitudes. “The added heat works against having a strong polar vortex,” he said.
But Dr. Overland acknowledges that his idea is tentative and needs further research. Many other climate scientists are not convinced, saying that a two-year span, however unusual, is not much on which to base a new theory. “We haven’t got sufficient insight to make definitive claims,” said Kevin Trenberth, head of climate analysis at the National Center for Atmospheric Research in Boulder, Colo.
Judah Cohen, director of seasonal forecasting at a company called Atmospheric and Environmental Research in Lexington, Mass., has spotted what he believes is a link between increasing snow in Siberia and the weakening of the polar vortex. In his theory, the extra snow is creating a dense, cold air mass over northern Asia in the late autumn, setting off a complex chain of cause and effect that ultimately perturbs the vortex.
Dr. Cohen said in an interview that the rising Siberian snow might, in turn, be linked to the decline of Arctic sea ice, with the open water providing extra moisture to the atmosphere - much as the Great Lakes produce heavy snows in cities like Buffalo and Syracuse. He is publishing seasonal forecasts based on his work, supported by the National Science Foundation. Those forecasts correctly predicted the recent harsh winters in the midlatitudes. But Dr. Cohen acknowledges, as does Dr. Overland, that some of his ideas are tentative and need further research.
The uncertainty about what is causing the strange winters highlights a core difficulty of climate science. While mainstream researchers are sure that greenhouse gases released by humans are warming the Earth, they acknowledge being on shakier ground in trying to predict the regional effects of that change. It is entirely possible, they say, that some regions will cool temporarily, because of disruption of the atmospheric and oceanic circulation, even as the Earth warms over all.
Bloggers who specialize in raising doubts about climate science have gleefully pointed to the recent winters in the United States and Europe as evidence that climatologists must be mistaken about a warming trend. These commentators have not been as eager to write about the strange warmth in parts of the Arctic, a region that scientists have long predicted will warm more rapidly than the planet as a whole.
Without doubt, the winter weather that began and ended 2010 was remarkable. Two of the 10 largest snowstorms in New York City history occurred last year, including the one that disrupted travel right after Christmas. The two snowstorms that fell on Washington and surrounding areas within a week in February had no known precedent in their overall impact on the region, with total accumulations of 40 inches in some places.
But the winters were not the whole story. Even without them, 2010 would have gone down as one of the strangest years in the annals of climatology, thanks in part to a weather condition known as El Nino, which dumped heat from the Pacific Ocean into the atmosphere early in the year. Later, the ocean surface cooled, a condition known as La Nina, contributing to heavy rainfall in many places.
Despite cooling from La Nina, newly compiled figures show that 2010 was among the two warmest years in the historical record. It featured a heat wave in Russia, all-time high temperatures in at least 17 countries, the hottest summer in New York City history, and devastating floods in Pakistan, China, Australia, the United States and other countries.
“It was a wild year,” said Christopher C. Burt, a weather historian for Weather Underground, an Internet site.
Still, however erratic the weather may have become, it is not obvious to most people how global warming could lead to frigid winters. Many scientists are hesitant to back such assertions, at least until they gain a better understanding of what is going on in the Arctic.
In interviews, several scientists recalled that in the decade ending in the mid-1990s, the polar vortex seemed to be strengthening, not weakening, producing mild winters in the eastern United States and western Europe.
At the time, some climate scientists wrote papers attributing that change to global warming. Newspapers, including this one, printed laments for winter lost. But soon after, the apparent trend went away, an experience that has made many researchers more cautious.
John M. Wallace, an atmospheric scientist at the University of Washington, wrote some of the earlier papers. This time around, he said, it will take a lot of evidence to convince him that a few harsh winters in London or Washington have anything to do with global warming.
“Just when you publish something and it looks like you’re seeing a connection,” Dr. Wallace said, “nature has a way of humbling us.”
Read post here.
ICECAP NOTE: The following statement from a president of the Royal Society was made on 20 November 1817 to their Lordships of the Admiralty. It covered the reduction of ice in the prior two years, one the infamous Year Without a Summer 1816 . It was in the Dalton Solar Minimum, a time of unusual cold and snow in middle latitudes.
“It will, without doubt, have come to your Lordship’s knowledge that a considerable change of climate, inexplicable at present to us, must have taken place in the Circumpolar Regions, by which the severity of the cold that has for centuries past enclosed the seas in the high northern latitudes in an impenetrable barrier of ice, has been during the last two years greatly abated. This affords ample proof that new sources of warmth have been opened, and give us leave to hope that the Arctic Seas may at this time be more accessible than they have been for centuries past, and that discoveries may now be made in them, not only interesting to the advancement of science, but also to the future intercourse of mankind and the commerce of distant nations.”
By hauntingthelibrary
James Hansen, the controversial scientist at the centre of the global warming movement has turned on America’s Democrat party in a shock announcement, savaging past Democrat administrations for “huge mistakes” that denied America the possibility of producing zero carbon emissions energy by now.
Andy Revkin of the New York Times reported that Hansen was not happy with the current Obama administration, as despite offering his services “I never heard back anything from the White House”. This “lame” approach, he said could be seen in past Democrat administrations:
Nowhere is the lame middle-of-the-road go-slow compromise approach clearer than in the case of nuclear power. The [Obama] Administration has been reluctant to admit that the Carter and Clinton/Gore administrations made a huge mistake in pulling the U.S. back from development of advanced nuclear technology.
That is the way to make nuclear power safer (nuclear power already has the best safety record of any major industry in the United States) and resistant to weapons proliferation.
New York Times. Dot Earth. NASA’s Hansen Pushes Obama for a Carbon Cost and a Nuclear Push.
Hansen also slammed President Obama for buckling to advocacy groups who impede progress on nuclear power, rather than being a “responsible leader” and authorizing a major new programme of building new nuclear power stations:
Nevertheless, the easiest thing that he could do, and perhaps the best that we can hope for, is for him to give a strong boost to nuclear power.
Unfortunately, he seems to fall prey to Democratic politics on this, rather than being a responsible leader.
New York Times. Dot Earth. NASA’s Hansen Pushes Obama for a Carbon Cost and a Nuclear Push.
Hansen’s comments may well be a dig at blogger Joe Romm, formerly Acting Assistant Secretary at the Department of Energy for the Clinton administration. Despite frequently proclaiming global warming to be an existential threat to humanity, Romm has hindered the move to low emissions energy by waging a campaign against nuclear power, which - as Hansen notes - has “the best safety record of any major industry”. Why is Romm ignoring the advice of the scientists he himself champions? Is it science, or is it politics?
Opinion:
This is a perfect example of how the campaign over man-made global warming is a political campaign far more than a scientific one. Nuclear power could provide the zero or low emissions energy that the warmists claim is desperately needed to save the world.
Yet they campaign virulently against it, on spurious grounds. They demand that we listen to the scientists on global warming. Yet, when those same scientists say that nuclear power is safe and should be pursued on a massive scale, they go silent, or point to a fringe minority who advocate against it on ideological grounds.
Why?
Spread the word . . . Share
See post here.
By Tom Gantert, Michigan Confidential, Jan. 19, 2011
Arctic sea ice area, 2001-2010A University of Michigan study released Tuesday claims shrinking snow and ice cover intensify global warming. But many skeptics question the conclusions and point to the limited amount of data over time that the researchers had available.
Mark Flanner, an assistant professor at the University of Michigan’s Department of Atmospheric, Oceanic and Space Sciences is the lead researcher. He has analyzed data from satellites over the last three decades in the northern hemisphere.
“The implication is that Earth’s climate may be more sensitive to increases in atmospheric carbon dioxide and other perturbations than models predict,” Flanner said in a press release.
Pat Michaels, a senior fellow in environmental studies at the Cato Institute, said in an e-mail that while many do not dispute that the phenomenon of “greenhouse warming” exists, what is important is the “amount of warming.” He said that it is clearly below what was predicted by the United Nations Intergovernmental Panel on Climate Change.
Roy Spencer, a principal research scientist at University of Alabama-Huntsville, said scientists have only been measuring Arctic sea ice since 1979. He said researchers who start with the conclusion that is a “normal” period for temperatures could not be proven right or wrong.
“That is the mistake everyone makes in this business,” Spencer said. “You can’t prove them wrong. It is one thing to measure what has happened. But to figure out cause and effect is extremely different. Yet, that makes all the difference in the world when determining man-made global warming.”
Thermometer readings in the Arctic suggest that it was just as warm in the 1930s as it is now, he said.
“And it was way warmer in the Arctic thousands of years ago,” he notes. “How did that happen?”
Spencer said the sea’s ice could have melted naturally and that the U-M researchers are assuming it is all due to an increase in the output of carbon dioxide.
He notes that there was a great climate shift in 1977 that warmed Alaska up very quickly and that it would have taken longer for the ocean to catch up to the warmer land masses. It is this that could account for the melting ice.
“These changes are consistent with natural climate variability,” Spencer said.
William Happer, a professor of physics at Princeton University, pointed to a graph of data (below, enlarged here) collected by the Department of Oceanography at the University of Hamburg that showed the Arctic and Antarctic sea ice areas had remained relatively the same from January 2003 through January 2010.
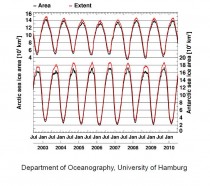
"I am not sure what the University of Michigan authors are looking at, but I don't see much year-to-year ice loss," Happer wrote in an e-mail. "There are lots of models and they predict different things. So you can usually find some model that will predict whatever you have observed. With respect to northern hemisphere sea ice and snow cover, you might note that 30 years ago was the end of the last cooling period, that began around 1940 and had Newsweek running alarming cover studies about the next ice age in the 1970's. So you don't have to have a big computer to guess that there is a bit less snow cover now than 30 years ago."
See post here.
By Paul Driessen and Robert Novak
Fina’s little body shook for hours with teeth-chattering chills. The next day her torment worsened, as nausea and vomiting continued even after there was nothing left in her stomach. Finally, her vomiting ebbed and chills turned to fever, drenching her body in sweat. Then more chills, fevers, nausea, convulsions, and constant, unbearable pain in every muscle, bone and joint.
She cried out, and tears mixed with sweat. But no one could help her. She had no money for doctors, medicines or a hospital room. She didn’t even have a mother or father to comfort her. All the orphanage school staff could do was caress her, pray and hope she’d get better - and wait for her to die.
And in agony that never stopped from the time the malaria first struck her down, Fina Nantume did die. So did 49 of her classmates, out of 500 students in the APEA Primary School for orphans in Kampala, Uganda, in 2005. Most of the survivors were also afflicted with malaria at least once that year. Some became permanently brain damaged. Others died in subsequent years.
Fina didn’t have to die. None of these spirited, beautiful young students had to die. None of them had to get malaria. The disease is preventable and treatable.
Then why did they? Why does half the world’s population remain at risk of getting malaria? Why are some 250 million people infected annually - with 90% of the agonizing chills, fevers, nausea, brain damage and death occurring in sub-Saharan Africa?
It’s said malaria is a disease of poverty, and poor countries don’t have enough funds, doctors or medicines to treat the disease - or prevent it in the first place. True enough. But malaria is also, and much more so, a disease of callous, intransigent environmental extremism and wanton disregard for human life. A disease whose prevention is hampered, and actively thwarted, by pervasive opposition to mosquito-killing insecticides, and mosquito-repelling DDT.
Anti-pesticide activists say they support other interventions: education, “capacity building,” modern drugs and bednets. Indeed, international funding for malaria prevention and treatment has risen from perhaps $40 million in 1998 to almost $2 billion in 2010. Millions of women and children now sleep under insecticide-treated nets. Millions now get diagnosed quickly and receive decent care and medicines.
These anti-malaria programs “saved nearly 750,000 lives over the past ten years.” the World Health Organization enthusiastically asserts. “That represents an 18% reduction in child mortality, compared with 2000.” That’s wonderful news. But it’s not good enough.
We would never tolerate 18% as “good enough,” if American or European kids’ lives were at stake, or if a 70-90% reduction in disease, misery and death rates were possible. And it would be possible, if we could end the lies and obstructionism that restrict access to mosquito killers and repellants that can dramatically reduce infection rates and the need to treat a quarter-billion cases of malaria every year.
But the lies and obstruction are prevalent, and effective. Here are just a few of the most egregious.
“Nets are just as good as insecticides.” Prevention should always be the first line of defense. That’s why we chlorinate drinking water and vaccinate people against measles, mumps, polio and flu. Insecticide-treated bednets (ITNs) certainly help and should be used. But they are a supplement to, not a substitute for, larvacides, insecticides and DDT that kill mosquitoes and keep them away from people.
Bednets help if they’re used regularly and properly. They don’t help if they’re torn, people are working, there are only enough nets for a family’s small children and pregnant women, or it’s too hot to sleep under one. Indoor residual spraying (IRS) eliminates behavior as a consideration; it protects everyone in the house, 24 hours a day.
“Bednets are more cost-effective than indoor spraying.” This assertion is backed by several studies that anti-pesticide groups and ITN manufacturers allegedly financed. However, the studies compare bednets with IRS using pyrethroids like ICON, instead of DDT. Pyrethroids are far more expensive and must be applied more often than DDT, which raises IRS costs significantly. The studies also fail to include all the costs associated with manufacturing and distributing the nets. Independent analyses found that nets are actually three times more expensive than spraying the inside walls of homes with DDT.
Much more important, spraying DDT once or twice a year keeps 80% of mosquitoes from entering the home, irritates those that do enter, so they leave without biting, and kills any that land. No other chemical, at any price, has these repellency and irritation features. DDT helps doctors treat more patients with often scarce ACT drugs and dramatically slash disease and death rates - often by 90% or more.
“Mosquitoes will become resistant to DDT.” This is highly unlikely. DDT use today is restricted to disease prevention, whereas pyrethroids are used extensively in agriculture and ITNs, greatly increasing the risk of resistance to these DDT “alternatives.” Once that happens both non-DDT indoor spraying and bednets will become far less effective, and malaria rates could skyrocket. In addition, there is no evidence that mosquitoes have ever become resistant to DDT’s repellency and irritation effects.
Moreover, reliance on nets and pyrethroid sprays significantly reduces prevention and increases the need for treatment. This can stretch scarce hospital, medical staff and drug resources to the breaking point. It increases the likelihood that malaria parasites will become resistant to Artemisia-based drugs, especially monotherapies. And it magnifies the pervasive and growing problem of substandard and counterfeit drugs replacing scarce supplies of reputable ACT combination therapies.
“DDT has dangerous side effects.” Greenpeace, Pesticide Action Network, Environmental Defense, International POPs Elimination Network and affiliated radical groups love to say “some researchers think” DDT and its break-down byproduct DDE “could” inhibit lactation, “may” weaken immune systems and are “associated with” low birth weights in babies. Not only is this rank speculation, but malaria definitely has all these side effects; it also causes severe brain damage, an inability to work for weeks on end, and agonizing death. Opposing DDT use on the basis of bogus side effects is infinitely worse than opposing cancer-curing chemotherapy because of the nasty and very real side effects of vincristine, asperaginase, methotrexate and other chemo drugs.
“DDT will poison the global biosphere.” Anti-pesticide zealots claim even indoor spraying with DDT will “contaminate” soils and waters for decades and “damage entire regional environmental systems.” Baloney. IRS involves small amounts of DDT on walls. The chemical and its derivatives break down. Detection does not equal destruction. Our ability to detect chemicals at the equivalent of one second in 32 years does not equate with damage to any organism, and certainly not to entire ecosystems.
There is no magic bullet. We need every weapon in our arsenal to control and eradicate this vicious disease. DDT and insecticides aren’t necessary or appropriate in every case - but when needed health officials must be able to employ them, without recrimination or retribution.
The “net” effect of these bald-faced lies is that anti-pesticide zealots are perpetuating poverty, misery, disease and death in malaria-endemic regions all over the world. Safe in offices made malaria-free by the very chemicals, technologies and prosperity they deny to others, these baby killers and their financial benefactors are violating the most basic human rights of people in poor nations: the right of access to technologies that enhance and safeguard life.
Their reign of terror must end, before they usher in a disaster of truly epidemic proportions. PDF

Fina Nantume - 1996-2005 - APEA Primary School, Kampala. Requiescat in pace. May her memory be a blessing, and a call for better malaria policies.
See also the attached collage of all 50 APEA students who died from malaria in 2005.

Paul Driessen is senior policy advisor for the Committee For A Constructive Tomorrow and Congress of Racial Equality, and author of Eco-Imperialism: Green power - Black death. Robert Novak is professor of medicine at the University of Alabama at Birmingham and has devoted much of his life to combating malaria.
See Greenpeace co-founder Patrick Moore on what led him to leave the organization as extremists took control here. He says “There is no scientific proof that mankind is causing global warming.”
Washington, DC 1/17/2011 05:49 PM GMT (TransWorldNews)
Science and Public Policy Institute
NASA and NOAA, which each receive close to half a billion dollars a year in taxpayer funding, have been systematically fiddling the worldwide temperature record for years, making “global warming” look worse than it is, according to a new paper by the Science and Public Policy Institute. The findings are reported by Joe D’Aleo, a leading meteorologist.
Robert Ferguson, President of SPPI, said: “Despite billions spent on official claims about the supposed threat of catastrophic man-made ‘global warming’, opinion polls show the public are no longer fooled. A main reason why the voters buy don’t climate alarmism any more is that the tiny but well-connected, lavishly-funded Climategate clique keeps on being caught out bending the scientific evidence.
The problem of data integrity has recently been commented on by MIT’s Dr. Richard Lindzen, “Inevitably in climate science, when data conflicts with models, a small coterie of scientists can be counted upon to modify the data...That the data should always need correcting to agree with models is totally implausible and indicative of a certain corruption within the climate science community.” Mr. D’Aleo’s paper is a damning expose of the inner workings of two agencies of the US Government.
The global temperature data from surface stations is “seriously compromised: the data suffer significant contamination by urbanization and other local factors such as changes in land cover and land use”. Numerous peer review papers suggest contamination of 30%, 50% or more.
The state of the temperature database, in the words of one of its operators, is “hopeless”, with “hundreds if not thousands of pairs of dummy and duplicate stations”.
The NASA warming is achieved in part by inventing data in arctic areas where no stations exist.
In the US, the warmest decade of the 20th century was the 1930s, and the warmest year was 1934, NASA’s chief climate scientist announced after the last super El Nino.
NOAA tampered with temperature data in 2000, 2007 and 2009 to create an artificial increase of 0.3 F in the warming trend since the 1930s.
NASA admits even today on their website, there is no generally-accepted standard for surface air temperatures.
Temperatures for the 1930s to 1950s have been readjusted downward to make the warming since then seem greater than it is.
Temperatures for recent decades have been readjusted upward to make the warming of the 20th century seem greater than it is.
Temperatures are measured in whole degrees F and at best tenths of a degree C, but anomalies after aggregation of the data and artificial adjustments are reported in hundredths of degrees, clearly given false impression of precision.
Over time in the NASA database, the warming trend has been steadily increasing - not because the weather is getting warmer but because NASA keeps tampering with the data.
The data tampering became more serious and more frequent in 2007, when a strong La Nina caused widespread and profound global cooling.
Adjustments by NOAA and NASA, rather than real-world temperature changes, account for virtually all the apparent warming trend in the global data.
NASA and NOAA have repeatedly resisted Freedom of Information Act requests for release of the unadjusted data and documentation of adjustments made, probably because they fear independent analysis will demonstrate the adjustments are unwarranted and warming insignificant
Global temperature databases are “seriously flawed” and “can no longer be trusted to assess climate trends or rankings or validate model forecasts”.
In a lengthy paper updated in August 2010, Surface Temperature Records: Policy Driven Deception? , Watts and D’Aleo catalogued numerous case studies of temperature data tampering around the world. This issue is of critical importance because these very data sets are used as justification of advocacy for formulating and implementing unprecedented policy decisions seeking radical transformations of our society and institutions.
Said Ferguson, “So blatantly obvious has the tampering become that Congress must mandate a thorough investigation of the temperature records, independent of the government scientists controlling them. A ‘B’ team of non-government and non-UN experts must be established with access to all the raw data, records, adjustments, fudges, bodges and computer codes currently being black-boxed by government scientists.”
The full paper can be found here.
Contact - Robert Ferguson
http://www.scienceandpublicpolicy.org
See also a critique of “2010 WAS THE WARMEST YEAR ON RECORD” by Christopher Monckton here.
--------
See compilation of responses back to NOAA, NASA and the opportunist elitists in academia and the enablers in the media in Oh My! 2010 tied for ‘hottest’ year?! Relax, it is ‘purely a political statement’—Even NASA’s Hansen admits it is ‘not particularly important’—Prof. mocks ‘hottest decade’ claim as ‘a joke’ here. Excerpts:
Warmest-Year Claim Refuted as ‘Politics, Not Science
Global warming alarmists have pointed to the claim that 2010 was the hottest year ever as proof that the earth is warming and nations must take steps to reduce carbon emissions.
But a website that has taken a prominent role in downplaying global warming fears is refuting that assertion.
“The global warming establishment and the media are crowing about 2010 being in a tie for the ‘hottest year,’” an editorial on the Climate Depot site declares. “Everyone from Senator John Kerry to [noted climate scientist] Joe Romm are screaming that this is ‘proof’ the planet is burning up in a CO2-induced hell - and it’s your fault!”
The site pointed to a Jan. 13 story in Britain’s Telegraph headlined: “Hottest year confirms global warming, say experts,” which cited “new figures from NASA that experts say confirm the case for man-made climate change.”
Climate Depot responded: “This is pure politics, not science. The ‘hottest year’ claims confirm the case for political science overtaking climate science.
“The ‘hottest year’ claim depends on minute fractions of a degree difference between years. Even NASA’s James Hansen, the leading proponent of man-made global warming in the U.S., conceded the ‘hottest year’ rankings are essentially meaningless. Hansen explained that 2010 differed from 2005 by less than two-hundredths of a degree F (that’s 0.018F).” Hansen admitted on Jan. 13: “It’s not particularly important whether 2010, 2005, or 1998 was the hottest year on record.”
Meteorologist Dr. Ryan Maue of Florida State University ridiculed the “hottest year” rankings in light of Hansen’s admission that it is “not particularly important” which year was declared the hottest. “Well, then stop issuing press releases which tout the rankings,” Maue demanded in a Jan. 14 commentary at WattsUpWithThat.com.
The “hottest year” claim falls apart even further when you look at longer time periods, Climate Depot notes. Climatologist Patrick Michaels told USA Today on Jan. 12: “If you draw a trend line from the data, it’s pretty flat from the 1990s. We don’t see much of a warming trend over the past 12 years.”
Climate Depot concluded: “The declaration that we are experiencing a tie for the ‘hottest’ year is purely a political statement because these claims are based on year-to-year temperature data that differ by only a few hundredths of a degree.”
By Anthony Watts, Watts Up With That
While there’s been a lot of attention given to the recent NOAA and NASA press releases stating that 2010 was tied for the warmest year globally, it didn’t meet that criteria in the USA by a significant margin according the the data directly available to the public from the NOAA National Climatic Data Center. (NCDC)
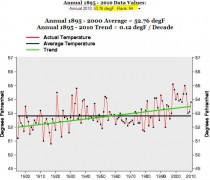
Here’s the graph of USA mean annual temperature from 1895-2010 produced by NCDC’s interactive climate database and graph generator, which you can operate yourself here.
Note the rank highlighted in yellow. The pulldown menu gives you an idea of what was the warmest year in the USA from this data, arrows added:
![]()
Here’s the partial table output (you can use their online selector to output your own table) sorted by rank from NCDC web page. 1998 leads, followed by 2006, and then 1934. 2010 is quite a ways down, ranking 94th out of 116.
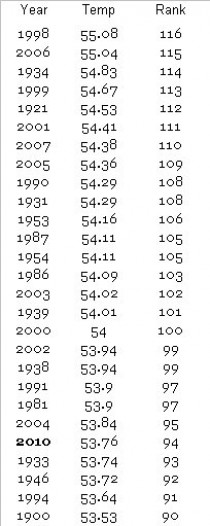
Highest temperature rank denotes the hottest year for the period. Lowest temperature rank denotes the coldest year for the period.
Data used to calculate Contiguous United States mean temperatures are from the USHCN version 2 data set.
Of course there is no mention of the USA temperature ranking in the recent press release from NOAA. The only mention of the USA in that PR that comes close is this:
In the contiguous United States, 2010 was the 14th consecutive year with an annual temperature above the long-term average. Since 1895, the temperature across the nation has increased at an average rate of approximately 0.12 F per decade.
There’s no mention of the 2010 ranking for the USA temperature at all, nor any mention of the fact that 2010 was not nearly as warm as 1998, or 1934. I find that more than a little odd for an agency whose mission is to serve the American people with accurate and representative climate data.
They couldn’t find room for a sentence or two to mention the USA historical temperature rank for 2010? Apparently not.
See more here.
--------
December United States Climate Review by NCDC
The temperature pattern for December 2010 matched what is expected from the negative Arctic Oscillation, especially east of the Rockies.
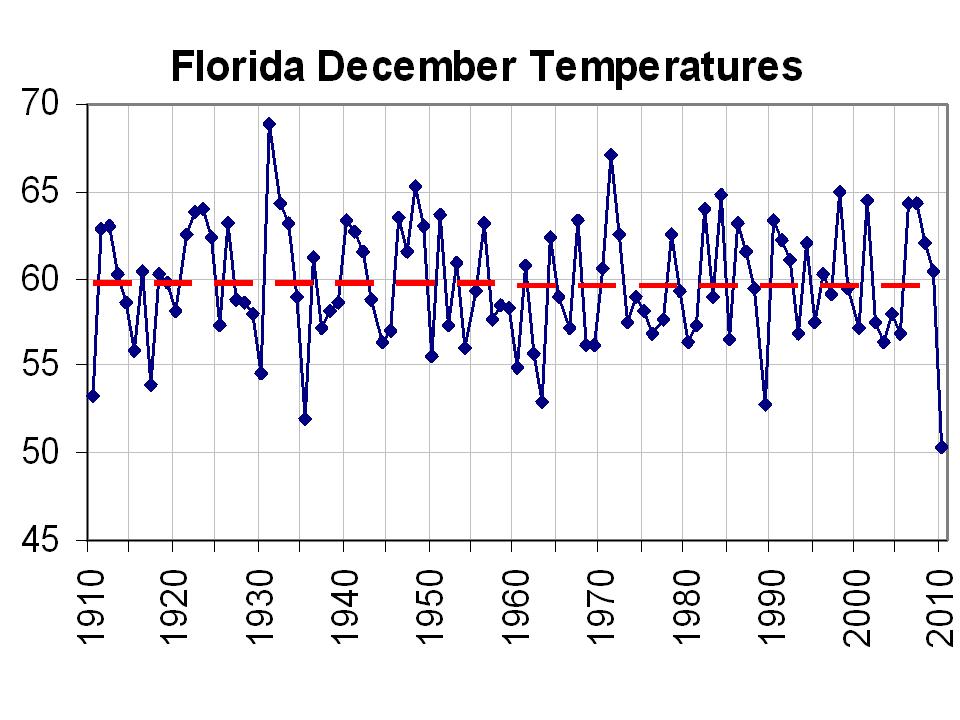
Florida and Georgia had the coldest December in the 1895-2010 record and the Carolinas ranked 3rd coldest. A total of 11 states from the Ohio Valley to the Gulf Coast had the tenth coldest, or colder, December in 2010.
Enlarged here.
The national temperature, when averaged across the contiguous U.S., was near normal in December, only 0.4 degrees F (0.2 degrees C) below the long-term average. Regionally, temperatures in the Southwest (2nd warmest) and West (10th warmest) climate regions were much above normal. In contrast, much below normal temperatures dominated the Southeast (3rd coldest) and Central (9th coldest) climate regions.
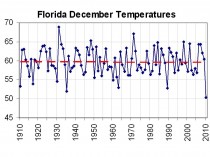
Both Florida and Georgia experienced their coldest December on record. The average statewide temperature in Florida was more than 9 degrees F (5.0 degrees C) below the 20th century average, as every climate division in the state experienced an average December temperature that was record cold.
In addition, several cities including - Miami, West Palm, Ft Lauderdale, Daytona, Orlando, Tampa, and Tallahassee Icecap Note: virtually all cities and stations - had thier coldest December on record.
ICECAP NOTE: For Florida, it was statewide the coldest December on record beating out 1935.
Enlarged here.
Also note that Tampa NWS office in Rusking reported 2010 in many locations in west and southwest Florida had more days with temperatures failing to reach 60F than any year in history.
Several other states including - North Carolina and South Carolina (3rd coldest), West Virginia (4th), Virginia and Alabama (5th), Tennessee (6th), Kentucky (7th), Mississippi (8th), and Ohio (10th) - had a temperature that was among their ten coldest based on records that date back to 1895.
The average temperature for several states in the West during the month of December was much above-normal. New Mexico had its second warmest December, both Colorado and Arizona had their fourth warmest, while it was Utah’s eighth and Nevada’s tenth warmest such December.
Enlarged here.
By Anthony Watts, Watts Up With That
From a new paper by Dr. Greg Kopp and Dr. Judith Lean, new finding on the solar minimum TSI in 2008:
The most probable value of total solar irradiance representative of solar minimum is 1360.8 plus/minus 0.5 W m-2, lower than the canonical value of 1365.4 plus/minus 1.3 W m-2 recommended a decade ago. This new value, measured by SORCE/TIM, is validated by irradiance comparisons to a NIST‐calibrated cryogenic radiometer in the new TSI Radiometer Facility. Uncorrected scattering and diffraction are shown to cause erroneously high readings in non‐TIM instruments.
That’s lower by 4.6 watts per square meter. This may mean that many climate models will have to be reinitialized if it is decided that this value they derive from SORCE is more accurate than the value established previously.

Figures 1B, 1C and 1D from the paper: The average of three different reported composites (ACRIM, PMOD, and RMIB) adjusted to match the SORCE/TIM absolute scale. The grey shading indicates the standard deviation of the three composites. (c) Irradiance variations estimated from an empirical model that combines the two primary influences of facular brightening and sunspot darkening with their relative proportions determined via regression from direct observations made by SORCE/ TIM. (d) The daily sunspot numbers indicate fluctuating levels of solar activity for the duration of the database
By way of a forcing comparison to this suggested revision, according to NOAA ESRL: The total effective climate forcing for all GHGs including CO2 and ozone (O3) from the beginning of the industrial revolution in 1750 to the year 2000 is 2.63 watts per square meter.
So a change of 4.6 watts per square meter to the old baseline TSI is more than double the total GHG forcings. That’s not chump change. It will be interesting to see how this shakes out in models. It is important to note this caveat from their abstract:
TIM’s lower solar irradiance value is not a change in the Sun’s output, whose variations it detects with stability comparable or superior to prior measurements; instead, its significance is in advancing the capability of monitoring solar irradiance variations.
Improved measurements of sun to advance understanding of climate change
From Eurekalert: WASHINGTON - Scientists have taken a major step toward accurately determining the amount of energy that the sun provides to Earth, and how variations in that energy may contribute to climate change.
In a new study of laboratory and satellite data, researchers report a lower value of that energy, known as total solar irradiance, than previously measured and demonstrate that the satellite instrument that made the measurement - which has a new optical design and was calibrated in a new way - has significantly improved the accuracy and consistency of such measurements.
The new findings give confidence, the researchers say, that other, newer satellites expected to launch starting early this year will measure total solar irradiance with adequate repeatability - and with little enough uncertainty - to help resolve the long-standing question of how significant a contributor solar fluctuations are to the rising average global temperature of the planet.
“Improved accuracies and stabilities in the long-term total solar irradiance record mean improved estimates of the sun’s influence on Earth’s climate,” said Greg Kopp of the Laboratory for Atmospheric and Space Physics (LASP) of the University of Colorado Boulder. Kopp, who led the study, and Judith Lean of the Naval Research Laboratory, in Washington, D.C., published their findings today in Geophysical Research Letters, a journal of the American Geophysical Union.
The new work will help advance scientists’ ability to understand the contribution of natural versus anthropogenic causes of climate change, the scientists said. That’s because the research improves the accuracy of the continuous, 32-year record of total solar irradiance, or TSI. Energy from the sun is the primary energy input driving Earth’s climate, which scientific consensus indicates has been warming since the Industrial Revolution.
Lean specializes in the effects of the sun on climate and space weather. She said, “Scientists estimating Earth’s climate sensitivities need accurate and stable solar irradiance records to know exactly how much warming to attribute to changes in the sun’s output, versus anthropogenic or other natural forcings.”
The new, lower TSI value was measured by the LASP-built Total Irradiance Monitor (TIM) instrument on the NASA Solar Radiation and Climate Experiment (SORCE) spacecraft. Tests at a new calibration facility at LASP verify the lower TSI value. The ground-based calibration facility enables scientists to validate their instruments under on-orbit conditions against a reference standard calibrated by the National Institute of Standards and Technology (NIST). Before the development of the calibration facility, solar irradiance instruments would frequently return different measurements from each other, depending on their calibration. To maintain a long-term record of the sun’s output through time, scientists had to rely on overlapping measurements that allowed them to intercalibrate among instruments.
Kopp said, “The calibration facility indicates that the TIM is producing the most accurate total solar irradiance results to date, providing a baseline value that allows us to make the entire 32-year record more accurate. This baseline value will also help ensure that we can maintain this important climate data record for years into the future, reducing the risks from a potential gap in spacecraft measurements.”
Lean said, “We are eager to see how this lower irradiance value affects global climate models, which use various parameters to reproduce current climate: incoming solar radiation is a decisive factor. An improved and extended solar data record will make it easier for us to understand how fluctuations in the sun’s energy output over time affect temperatures, and how Earth’s climate responds to radiative forcing.”
Lean’s model, which is now adjusted to the new lower absolute TSI values, reproduces with high fidelity the TSI variations that TIM observes and indicates that solar irradiance levels during the recent prolonged solar minimum period were likely comparable to levels in past solar minima. Using this model, Lean estimates that solar variability produces about 0.1 Celsius (0.18 Fahrenheit) global warming during the 11-year solar cycle, but is likely not the main cause of global warming in the past three decades.
GEOPHYSICAL RESEARCH LETTERS, VOL. 38, L01706, 7 PP., 2011 doi:10.1029/2010GL045777 A new, lower value of total solar irradiance: Evidence and climate significance, Greg Kopp. Laboratory for Atmospheric and Space Physics, Boulder, Colorado, USA, Judith L. Lean. Space Science Division, Naval Research Laboratory, Washington, D. C., USA
See the paper here (PDF). Big h/t to Dr. Leif Svalgaard
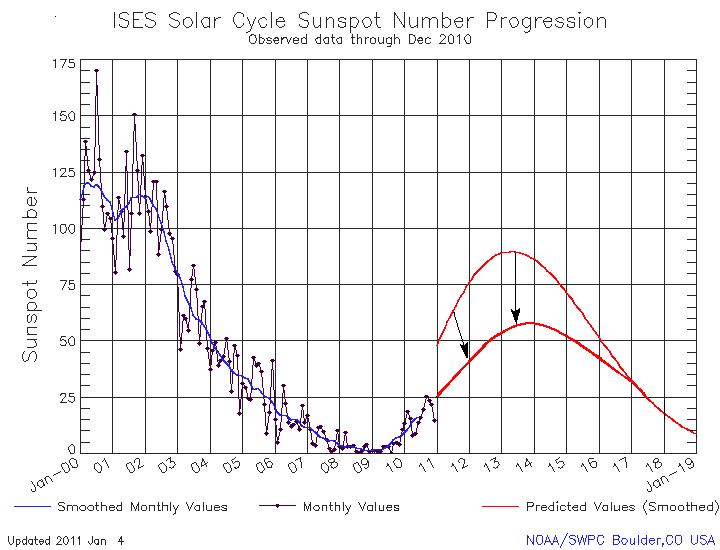
Sun activity increasing very slowly over 2 years after the official minimum (on the second year anniversary, the sunspot number was just 14.5). However, the solar flares have generated bursts of the solar wind and some wonderful auroras. See SPACEWEATHER.COM.
The temperature and precipitation pattern for December 2010 matched what is expected from the negative Arctic Oscillation, especially east of the Rockies.
Florida and Georgia had the coldest December in the 1895-2010 record and the Carolinas ranked 3rd coldest. A total of 11 states from the Ohio Valley to the Gulf Coast had the tenth coldest, or colder, December in 2010.
Precipitation was below normal from the Southern Plains and Southeast to the southern Great Lakes, with Louisiana and Mississippi having the 3rd driest December and 4 other states ranking in the top ten driest category.
As a result, drought expanded in the southern tier states, especially the southern Plains and Southeast. By the end of the month, 24 percent of the contiguous U.S. was classified in moderate to extreme drought, according to the U.S. Drought Monitor. The precipitation pattern over the West reflected a combination of La Nina and Arctic Oscillation influences.
Enlarged here.
Enlarged here.
Temperature Highlights
The national temperature, when averaged across the contiguous U.S., was near normal in December, only 0.4 degrees F (0.2 degrees C) below the long-term average.
Regionally, temperatures in the Southwest (2nd warmest) and West (10th warmest) climate regions were much above normal. In contrast, much below normal temperatures dominated the Southeast (3rd coldest) and Central (9th coldest) climate regions.
Both Florida and Georgia experienced their coldest December on record. The average statewide temperature in Florida was more than 9 degrees F (5.0 degrees C) below the 20th century average, as every climate division in the state experienced an average December temperature that was record cold.
In addition, several cities including - Miami, West Palm, Ft Lauderdale, Daytona, Orlando, Tampa, and Tallahassee Icecap Note: virtually all cities and stations - had thier coldest December on record.
ICECAP NOTE: For Florida, it was statewide the coldest December on record beating out 1935.
Enlarged here.
Also note that Tampa NWS office in Rusking reported 2010 in many locations in west and southwest Florida had more days with temperatures failing to reach 60F than any year in history.
Several other states including - North Carolina and South Carolina (3rd coldest), West Virginia (4th), Virginia and Alabama (5th), Tennessee (6th), Kentucky (7th), Mississippi (8th), and Ohio (10th) - had a temperature that was among their ten coldest based on records that date back to 1895.
The average temperature for several states in the West during the month of December was much above-normal. New Mexico had its second warmest December, both Colorado and Arizona had their fourth warmest, while it was Utah’s eighth and Nevada’s tenth warmest such December.
Enlarged here.
Precipitation Highlights
Precipitation in December, when averaged across the contiguous U.S., was normal, only 0.01 inch (0.3 mm) below the 20th century average. Record precipitation amounts in the west were offset by the dryness in the southern Plains and Southeast.
The persistent on-shore flow from the Pacific contributed to the third wettest December for the West climate region. These dissipated by the time they reached the South and East, contributing to the second driest December in the South climate region.
Both Nevada and Utah had their wettest December on record. Other states that were much wetter-than-normal were Minnesota (4th wettest), Maine (5th wettest), North Dakota (6th wettest), California (7th wettest), South Dakota (8th wettest) and Oregon (10th wettest).
In the South and East several states were drier-than-normal as both Mississippi and Louisiana experienced their third driest December on record. Elsewhere, Kansas had its sixth driest December, Alabama its seventh, Arkansas its eighth, and Delaware its tenth.
Enlarged here.
The long term drought index shows the typical La Nina dryness in the south central.
Enlarged here.
By Art Horn, Icecap Meteorologist
You would think that NOAA, the National Oceanographic and Atmospheric Administration would be an objective and sober reviewer of temperature data. Apparently they are not. NOAA has proclaimed that 2010 was tied with 2005 as the “warmest year on record.” At first this sounds impressive. But as with all political proclamations there is always more to the story. The statement “warmest on record” means the period of time since 1880 that temperature has been measured with thermometers. To say the 2010 was tied with the warmest year on record is essentially meaningless when viewed in a true historical context.
If NOAA was truly objective in their analysis of this 130 year period of temperature they would acknowledge that 130 years of record in the long history of climate is insignificant to the extreme. The reason they do not give this record its true historical context is because their statement is really political. Their true message is that global warming is causing the warm weather and that we need to abandon fossil fuels and somehow change to “renewable” energy sources.
If one takes a serious, adult look at the variability of weather and climate over time you find amazing events. In the winter of 1249 it was so warm in England that people did not need winter clothes. They walked about in summer dress. It was so warm people thought the seasons had changed. There was no frost in England the entire winter. Can you imagine what NOAA would say if that happened next year? But it did happen, 762 years ago and burning fossil fuels had nothing to do with it. In the winter of 1717 there was so much snow in Massachusetts in late February and early March, single story houses were buried. A series of 4 storms produced so much snow that by the time the storms ended there was 10 to 15 feet of snow on the ground. People had to tunnel from one home to another to check on each other. Search parties were organized in Medford Massachusetts to find the poor and the elderly. One widow was known to have several children. They found her house from the smoke coming up through the snow. After digging down into the snow the rescuers entered through a window and found her and her children alive. They were burning the furniture to heat the house. If this happened today we would be told it was because of “climate disruption” the new offspring our government has given birth to as a replacement for “climate change.”
Isotopes of oxygen analyzed from deep ice cores drilled in Greenland’s massive two mile thick ice sheets show that today’s “record warmth” is not even close to how warm it’s been in the recent past. These oxygen isotopes can act as a proxy or substitute for temperature. What they reveal is that the earth was much warmer than today for most of the last 10,000 years by 1 to 4 degrees Fahrenheit. The entire warming of the last 160 years is just 1 degree Fahrenheit, half of which took place between 1910 and 1945 when humans could not have had any effect. In fact these ice cores reveal that earth’s temperature has been rising for 200 years, rebounding from a 500 year cold period known as the “Little Ice Age.” Further examination of the ice core temperatures show that earth’s temperature peaked some 3,300 years ago in the Minoan Warm Period and has been falling ever since.
Today’s “record warmth” may be fleeting. Statements by agenda driven government agencies can’t be trusted. Real scientific data, not shadowy half truths show that earth’s temperature is falling and has fallen nearly 4 degrees Fahrenheit in the last 3,000 years. Remember, when someone only reveals part of the truth it means they have something to hide.
See SPPI post on the December to Remember here. See Are Huge Northeast Snowstorms Due to Global Warming here. See story on last year’s incredible winter here.
Also seein this Real Science post, Derek Arndt, who heads the climate monitoring branch at NOAA’s National Climatic Data Center in Asheville, N.C., said the new data should be viewed in the context of the record retreat of snow cover in the Northern Hemisphere at the end of the melt season and a near-record retreat of Arctic sea ice.
“Together across the board, it was an unusual year, and a year that in many ways was a culmination of what we’ve been seeing for the past several years,” Arndt said. in WAPO.
Record retreat meaning second largest winter snow cover on record.
Enlarged here.
Given this twisted logic, last season with all-time record snows in the DC area meant all-time record snowmelt as it disappeared. Reminds me of the ridiculous NOAA spokesman statement last year that global warming helped explain the record DC snow thanks to storm track shifting north and more moisture from the Great Lakes. Clueless.
Land fizzing like soda pop: farmer says CO2 injected underground is leakingBy: Bob Weber and Jennifer Graham, The Canadian Press
A Saskatchewan farm couple whose land lies over the world’s largest carbon capture and storage project says greenhouse gases seeping from the soil are killing animals and sending groundwater foaming to the surface like shaken soda pop.
The gases were supposed to have been injected permanently underground.
Cameron and Jane Kerr own nine quarter-sections of land above the Weyburn oilfield in eastern Saskatchewan. They released a consultant’s report Tuesday that links high concentrations of carbon dioxide in their soil to 6,000 tonnes of the gas injected underground every day by energy giant Cenovus (TSX:CVE) in an attempt to enhance oil recovery and fight climate change.
“We knew, obviously, there was something wrong,” said Jane Kerr.
A Cenovus spokeswoman said the company doubts those findings. She pointed out they contradict years of research from other scientists.
“It’s not what we believe,” said Rhona Delfrari.
Since 2000, Cenovus has injected about 16 million tonnes of carbon dioxide underground to force more oil from an aging field and safely store greenhouse gases that would otherwise contribute to climate change.
But in 2005, the Kerrs began noticing algae blooms, clots of foam and multicoloured scum in two ponds at the bottom of a gravel quarry on their land. Sometimes, the ponds bubbled. Small animals - cats, rabbits and goats - were regularly found dead a few metres away.
Then there were the explosions.
“At night we could hear this sort of bang like a cannon going off,” said Jane Kerr, 58. “We’d go out and check the gravel pit and, in the walls, it (had) blown a hole in the side and there would be all this foaming coming out of this hole.”
“Just like you shook up a bottle of Coke and had your finger over it and let it spray,” added her husband.
The water, said Jane Kerr, came out of the ground carbonated.
“It would fizz and foam.”
Alarmed, the couple left their farm and moved to Regina.
“It was getting too dangerous to live there,” Cameron Kerr said.
He said provincial inspectors did a one-time check of air quality. Eventually, the Kerrs paid a consultant for a study.
Paul Lafleur of Petro-Find Geochem found carbon dioxide concentrations in the soil last summer that averaged about 23,000 parts per million - several times those typically found in field soils. Concentrations peaked at 110,607 parts per million.
Lafleur also used the mix of carbon isotopes he found in the gas to trace its source.
“The ... source of the high concentrations of CO2 in the soils of the Kerr property is clearly the anthropogenic CO2 injected into the Weyburn reservoir,” he wrote.
“The survey also demonstrates that the overlying thick cap rock of anhydrite over the Weyburn reservoir is not an impermeable barrier to the upward movement of light hydrocarbons and CO2 as is generally thought.”
Delfrari said Cenovus has hired three independent consultants to evaluate Lafleur’s work.
She pointed to a 2004 report on the project by Saskatchewan’s Petroleum Training and Research Centre, an agency bringing together government, academics and industry. That report found that after four years of injection, there was no indication carbon dioxide was making its way up through 1,400 metres of rock.
“There is no evidence so far for escape of injected CO2 from depth,” the report said. It also found the area “highly suitable” for long-term carbon dioxide storage.
Centre director Malcolm Wilson said Lafleur’s report wasn’t enough on its own to conclude carbon dioxide is leaking. “I will never say that it couldn’t happen, but at the moment I think it’s very premature to make that linkage,” he said. “There are a lot of other potential sources of the CO2.”
He added, however, that Lafleur has raised some significant questions. “We do have to take into account some of the carbon isotope analysis.” Delfrari said the nearest injection well is about two kilometres from the Kerr property and no other farmers in the area have complained. “We’re confident that none of (the carbon dioxide) is making its way back to the Kerr property.”
She said the Kerrs have suggested that Cenovus buy them out. Lafleur said there’s no way the heavy concentrations of the gas he found could have been naturally generated. “Biogeneic gas is simply not the source of this tremendous amount of CO2, both from a volume point of view and from the isotope point of view. “All reservoirs leak. Every one of them.”
Lafleur emphasized that most of the carbon dioxide stays underground. But so much is injected that even small leaks can have health impacts. He said environmental monitoring of the Weyburn project virtually ceased in 2005. Carbon dioxide is not poisonous, but it does have health effects and can cause asphyxiation in heavy concentrations.
Saskatchewan Energy and Resource Minister Bill Boyd said his government is prepared to take another look at the situation, but said he wouldn’t order the project to stop or slow down. “We’re prepared to take a very serious look at this situation,” he said. “In the meantime, we feel that things are handled appropriately.”
Chris Severson-Baker from the Pembina Institute, an environmental think-tank, suggested there is a greater chance of leakage from projects that combine oil recovery with carbon storage. “We’re nervous and not supportive of enhanced oil recovery,” he said. “If you drill lots of wells into an oil formation, you’re going to have leaks.”
Such sites aren’t chosen because they’re good storage areas, said Severson-Baker, but because they’re under an oilfield that would benefit from injection. He said deep saline aquifers, such as those being explored in Alberta, are better choices. The suggestion that the Weyburn capture and storage project might be leaking could have implications far beyond one rural neighbourhood.
The Alberta government has committed $2 billion to similar pilot projects. The United States has committed $3.4 billion for carbon capture and storage. Norway has been injecting carbon dioxide into the sea floor since 1996. There are carbon capture and storage tests planned in Australia, Germany, Poland, the United Kingdom, China and Japan. See post here.