


By Joseph D’Aleo, Pajamas Media exclusive
The familiar phrase was spoken by Marcellus in Shakespeare’s Hamlet - first performed around 1600, at the start of the Little Ice Age. “Something is rotten in the state of Denmark” is the exact quote. It recognizes that fish rots from the head down, and it means that all is not well at the top of the political hierarchy. Shakespeare proved to be Nostradamus. Four centuries later - at the start of what could be a new Little Ice Age - the rotting fish is Copenhagen.
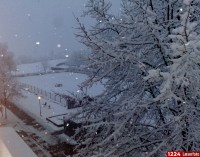
The smell in the air may be from the leftover caviar at the banquet tables, or perhaps from the exhaust of 140 private jets and 1200 limousines commissioned by the attendees when they discovered there was to be no global warming evident in Copenhagen. (In fact, the cold will deepen and give way to snow before they leave, an extension of the Gore Effect.) Note: already has come.
But the metaphorical stench comes from the well-financed bad science and bad policy, promulgated by the UN, and the complicity of the so-called world leaders, thinking of themselves as modern-day King Canutes (the Viking king of Denmark, England, and Norway - who ironically ruled during the Medieval Warm Period this very group has tried to deny). His flatterers thought his powers “so great, he could command the tides of the sea to go back.”
Unlike the warmists and the compliant media, Canute knew otherwise, and indeed the tide kept rising. Nature will do what nature always did - change.
It’s the data, stupid
If we torture the data long enough, it will confess. (Ronald Coase, Nobel Prize for Economic Sciences, 1991)
The Climategate whistleblower proved what those of us dealing with data for decades know to be the case - namely, data was being manipulated. The IPCC and their supported scientists have worked to remove the pesky Medieval Warm Period, the Little Ice Age, and the period emailer Tom Wigley referred to as the “warm 1940s blip,” and to pump up the recent warm cycle.
Attention has focused on the emails dealing with Michael Mann’s hockey stick and other proxy attempts, most notably those of Keith Briffa. Briffa was conflicted in this whole process, noting he “[tried] hard to balance the needs of the IPCC with science, which were not always the same,” and that he knew “...there is pressure to present a nice tidy story as regards ‘apparent unprecedented warming in a thousand years or more in the proxy data.’”
As Steve McIntyre has blogged:
“Much recent attention has been paid to the email about the “trick” and the effort to “hide the decline.” Climate scientists have complained that this email has been taken “out of context.” In this case, I’m not sure that it’s in their interests that this email be placed in context because the context leads right back to the role of IPCC itself in “hiding the decline” in the Briffa reconstruction.”
In the area of data, I am more concerned about the coordinated effort to manipulate instrumental data (that was appended onto the proxy data truncated in 1960 when the trees showed a decline - the so called “divergence problem") to produce an exaggerated warming that would point to man’s influence. I will be the first to admit that man does have some climate effect - but the effect is localized. Up to half the warming since 1900 is due to land use changes and urbanization, confirmed most recently by Georgia Tech’s Brian Stone (2009), Anthony Watts (2009), Roger Pielke Sr., and many others. The rest of the warming is also man-made - but the men are at the CRU, at NOAA’s NCDC, and NASAs GISS, the grant-fed universities and computer labs.
Programmer Ian “Harry” Harris, in the Harry_Read_Me.txt file, commented about:
“[The] hopeless state of their (CRU) data base. No uniform data integrity, it’s just a catalogue of issues that continues to grow as they’re found...I am very sorry to report that the rest of the databases seem to be in nearly as poor a state as Australia was. There are hundreds if not thousands of pairs of dummy stations, one with no WMO and one with, usually overlapping and with the same station name and very similar coordinates. I know it could be old and new stations, but why such large overlaps if that’s the case? Aarrggghhh! There truly is no end in sight.
This whole project is SUCH A MESS. No wonder I needed therapy!!
I am seriously close to giving up, again. The history of this is so complex that I can’t get far enough into it before by head hurts and I have to stop. Each parameter has a tortuous history of manual and semi-automated interventions that I simply cannot just go back to early versions and run the updateprog. I could be throwing away all kinds of corrections - to lat/lons, to WMOs (yes!), and more. So what the hell can I do about all these duplicate stations?
Climategate has sparked a flurry of examinations of the global data sets - not only at CRU, but in nations worldwide and at the global data centers at NOAA and NASA. Though the Hadley Centre implied their data was in agreement with other data sets and thus trustworthy, the truth is other data centers are complicit in the data manipulation fraud.
....
When you hear press releases from NOAA, NASA, or Hadley claiming a month, year, or decade ranks among the warmest ever recorded, keep in mind: they have tortured the data, and it has confessed. See much more in the rest of this 3 page post here. See Roger Pielke Sr’s much appreciated comments on this post here.
The Litte Ice Age Thermometers - The study Of Climate Variability from 1600 to 2009
By Climate Reason
A clickable map with the historical station records can be found here. A discusssion of UHI factor here.
----------------------------
The Smoking Gun At Darwin Zero
By Willis Eschenbach at Watts Up With That here
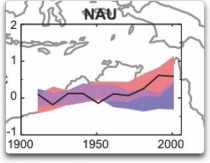
So I’m still on my multi-year quest to understand the climate data. You never know where this data chase will lead. This time, it has ended me up in Australia. NASA [GHCN] only presents 3 stations covering the period 1897-1992. What kind of data is the IPCC Australia diagram based on? If any trend it is a slight cooling. However, if a shorter period (1949-2005) is used, the temperature has increased substantially. The Australians have many stations and have published more detailed maps of changes and trends.
The folks at CRU told Wibjorn that he was just plain wrong. Here’s what they said is right, the record that Wibjorn was talking about, Fig. 9.12 in the UN IPCC Fourth Assessment Report, showing Northern Australia (below, enlarged here).
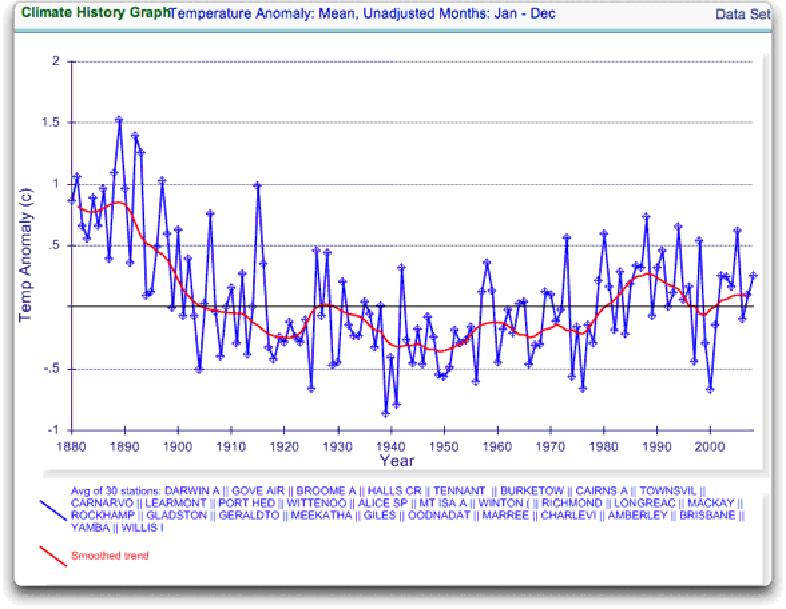
Here’s every station in the UN IPCC specified region which contains temperature records that extend up to the year 2000 no matter when they started, which is 30 stations (below, enlarged here).
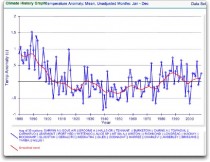
Still no similarity with IPCC. So I looked at every station in the area. That’s 222 stations. Here’s that result (below, enlarged here).
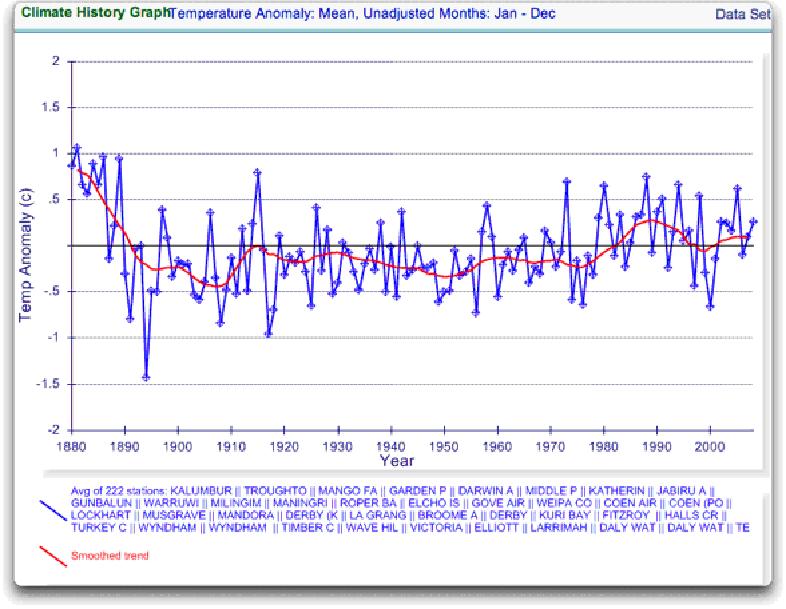
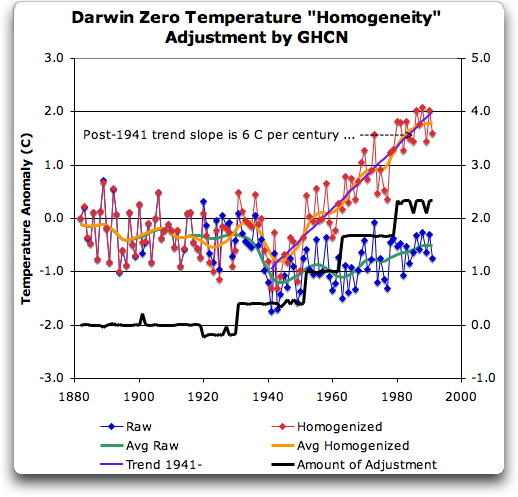
The answer is, these graphs all use the raw GHCN data. But the IPCC uses the “adjusted” data. GHCN adjusts the data to remove what it calls “inhomogeneities”. So on a whim I thought I’d take a look at the first station on the list, Darwin Airport, so I could see what an inhomogeneity might look like when it was at home.
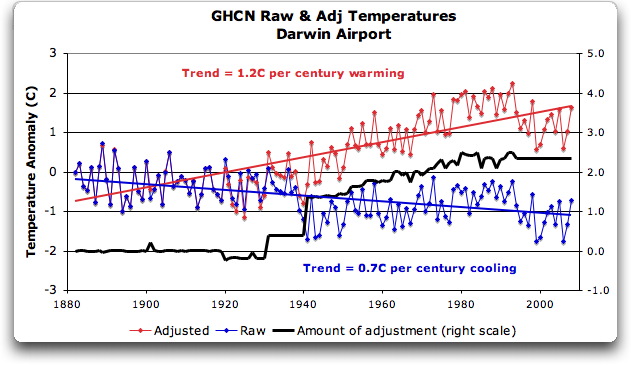
Then I went to look at what happens when the GHCN removes the “in-homogeneities” to “adjust” the data. Of the five raw datasets, the GHCN discards two, likely because they are short and duplicate existing longer records. The three remaining records are first “homogenized” and then averaged to give the “GHCN Adjusted” temperature record for Darwin.
To my great surprise, here’s what I found. To explain the full effect, I am showing this with both datasets starting at the same point (rather than ending at the same point as they are often shown) (below, enlarged here).
YIKES! Before getting homogenized, temperatures in Darwin were falling at 0.7 Celcius per century...but after the homogenization, they were warming at 1.2 Celcius per century. And the adjustment that they made was over two degrees per century...when those guys “adjust”, they don’t mess around.
Intrigued by the curious shape of the average of the homogenized Darwin records, I then went to see how they had homogenized each of the individual station records. What made up that strange average shown in Fig. 7? I started at zero with the earliest record. Here is Station Zero at Darwin, showing the raw and the homogenized versions (below, enlarged here).
Yikes again, double yikes! What on earth justifies that adjustment? How can they do that? We have five different records covering Darwin from 1941 on. They all agree almost exactly. Why adjust them at all? They’ve just added a huge artificial totally imaginary trend to the last half of the raw data! Now it looks like the IPCC diagram in Figure 1, all right...but a six degree per century trend? And in the shape of a regular stepped pyramid climbing to heaven? What’s up with that? See full DAMNING post here.
---------------------------
Feeling Warmer Yet?
Study by New Zealand Climate Science Coalition
There have been strident claims that New Zealand is warming. The Inter-governmental Panel on Climate Change (IPCC), among other organisations and scientists, allege that, along with the rest of the world, we have been heating up for over 100 years.
But now, a simple check of publicly-available information proves these claims wrong. In fact, New Zealand’s temperature has been remarkably stable for a century and a half. So what’s going on?
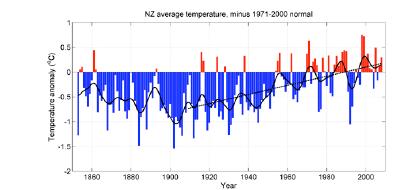
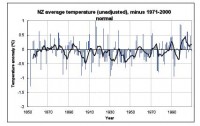
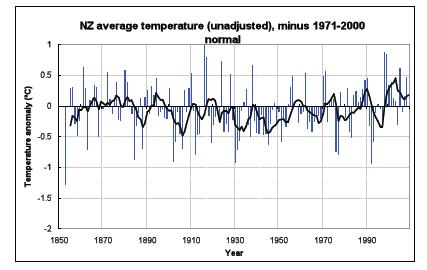
New Zealand’s National Institute of Water & Atmospheric Research (NIWA) is responsible for New Zealand’s National Climate Database. This database, available online, holds all New Zealand’s climate data, including temperature readings, since the 1850s. Anybody can go and get the data for free. That’s what we did, and we made our own graph. Before we see that, let’s look at the official temperature record. This is NIWA’s graph of temperatures covering the last 156 years: From NIWA’s web site -
The official version enlarged here.Mean annual temperature over New Zealand, from 1853 to 2008 inclusive, based on between 2 (from 1853) and 7 (from 1908) long-term station records. The blue and red bars show annual differences from the 1971 - 2000 average, the solid black line is a smoothed time series, and the dotted [straight] line is the linear trend over 1909 to 2008 (0.92C/100 years).
This graph is the centrepiece of NIWA’s temperature claims. It contributes to global temperature statistics and the IPCC reports. It is partly why our government is insisting on introducing an ETS scheme and participating in the climate conference in Copenhagen. But it’s an illusion.
Dr Jim Salinger (who no longer works for NIWA) started this graph in the 1980s when he was at CRU (Climate Research Unit at the University of East Anglia, UK) and it has been updated with the most recent data. It’s published on NIWA’s website and in their climate-related publications.
The actual thermometer readings
To get the original New Zealand temperature readings, you register on NIWA’s web site, download what you want and make your own graph. We did that, but the result looked nothing like the official graph. Instead, we were surprised to get this:
here.
Straight away you can see there’s no slope - either up or down. The temperatures are remarkably constant way back to the 1850s. Of course, the temperature still varies from year to year, but the trend stays level - statistically insignificant at 0.06C per century since 1850. Putting these two graphs side by side, you can see huge differences. What is going on?
Why does NIWA’s graph show strong warming, but graphing their own raw data looks completely different? Their graph shows warming, but the actual temperature readings show none whatsoever! Have the readings in the official NIWA graph been adjusted?
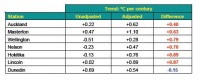
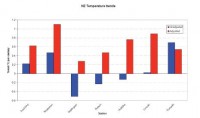
It is relatively easy to find out. We compared raw data for each station (from NIWA’s web site) with the adjusted official data, which we obtained from one of Dr Salinger’s colleagues. Requests for this information from Dr Salinger himself over the years, by different scientists, have long gone unanswered, but now we might discover the truth.
Proof of man-made warming? What did we find? First, the station histories are unremarkable. There are no reasons for any large corrections. But we were astonished to find that strong adjustments have indeed been made. About half the adjustments actually created a warming trend where none existed; the other half greatly exaggerated existing warming. All the adjustments increased or even created a warming trend, with only one (Dunedin) going the other way and slightly reducing the original trend.
Enlarged here
The shocking truth is that the oldest readings have been cranked way down and later readings artificially lifted to give a false impression of warming, as documented below. There is nothing in the station histories to warrant these adjustments and to date Dr Salinger and NIWA have not revealed why they did this.
Enlarged here
See much more of this detailed analysis here. NIWA responds to the charges here but Anthony Watts uses instrument photo located at NIWA headquarters to cast doubt on their claims here. See also how the government is hell bent on moving foward with carbon emission schemes choosing to believe agenda driven government scientists here.
May I suggest those of you capable of extracting and doing the same kind of analysis for other regions try the same approach. Note back in 2007, an Icecap post inspired Steve McIntyre story “Central Park: Will the real Slim Shady please stand up?” on Central Park data raw versus adjusted here. Read the comments. As one poster noted could this be a ‘smoking gun’ on data manipulation”.
------------------------
No Global Warming in 351 Year British Temperature Record
By the Carbon Sense Coalition here
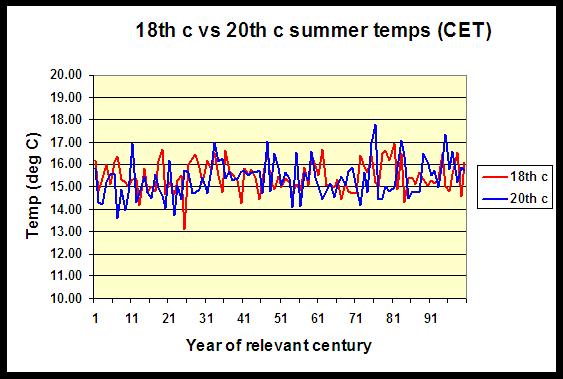
The Central England Temperature (CET) record, starting in 1659 and maintained by the UK Met Office, is the longest unbroken temperature record in the world. Temperature data is averaged for a number of weather stations regarded as being representative of Central England rather than measuring temperature at one arbitrary geographical point identified as the centre of England.
A Scottish Chemist, Wilson Flood, has collected and analysed the 351 year CET record. Here (below, enlarged here) is the comparison of the 18th Century with the 20th Century:
Wilson Flood comments:
“Summers in the second half of the 20th century were warmer than those in the first half and it could be argued that this was a global warming signal. However, the average CET summer temperature in the 18th century was 15.46 degC while that for the 20th century was 15.35 degC. Far from being warmer due to assumed global warming, comparison of actual temperature data shows that UK summers in the 20th century were cooler than those of two centuries previously.”
-------------------------
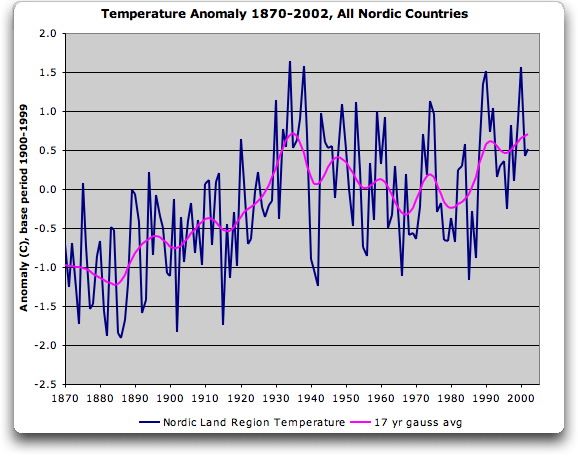
Karlen Emails about Inability to Replicate IPCC CRU based Nordic Data
By Willis Eschenbach on WUWT
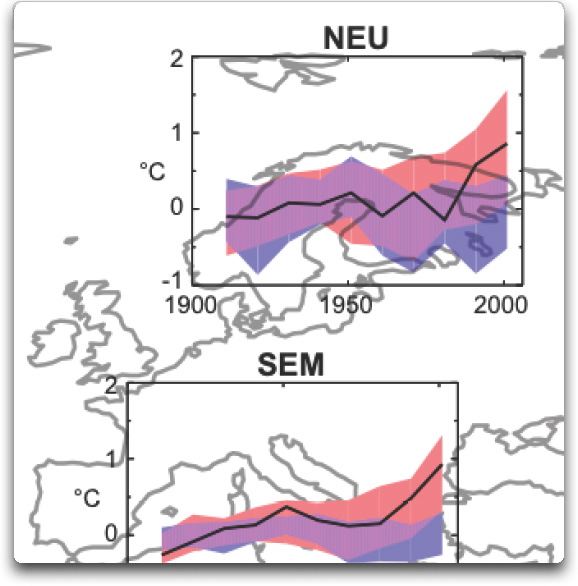
Professor Karlen in attempts to reconstruct the Nordic temperature. In his analysis, I find an increase from the early 1900s to ca 1935, a trend down until the mid 1970s and so another increase to about the same temperature level as in the late 1930s (below, enlarged here).
A distinct warming to a temperature about 0.5 deg C above the level 1940 is reported in the IPCC diagrams. I have been searching for this recent increase, which is very important for the discussion about a possible human influence on climate, but I have basically failed to find an increase above the late 1930s (below, enlarged here).
See much more here.
-------------------------
Skewed science
By Phil Green, Financial Post
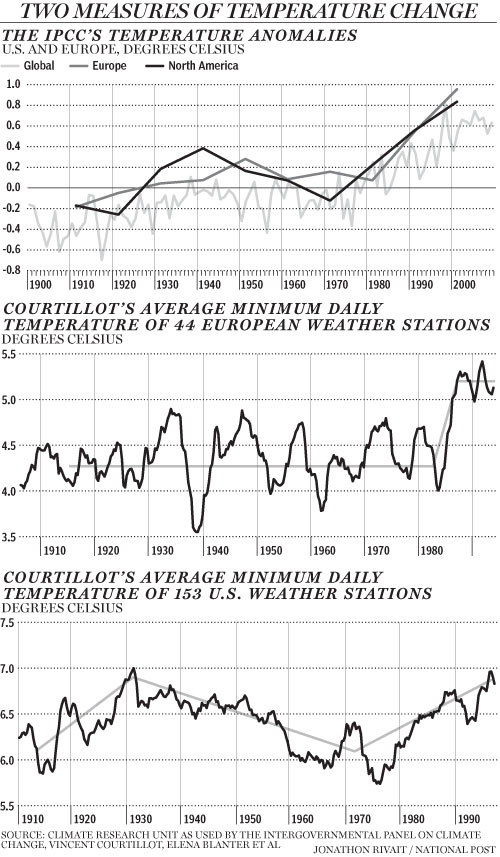
A French scientist’s temperature data show results different from the official climate science. Why was he stonewalled? Climate Research Unit emails detail efforts to deny access to global temperature data.
The global average temperature is calculated by climatologists at the Climatic Research Unit (CRU) at the University of East Anglia. The temperature graph the CRU produces from its monthly averages is the main indicator of global temperature change used by the International Panel on Climate Change, and it shows a steady increase in global lower atmospheric temperature over the 20th century. Similar graphs for regions of the world, such as Europe and North America, show the same trend. This is consistent with increasing industrialization, growing use of fossil fuels, and rising atmospheric concentrations of carbon dioxide.
It took the CRU workers decades to assemble millions of temperature measurements from around the globe. The earliest measurements they gathered came from the mid 19th century, when mariners threw buckets over the side of their square riggers and hauled them up to measure water temperature. Meteorologists increasingly started recording regular temperature on land around the same time. Today they collect measurements electronically from national meteorological services and ocean-going ships.
Millions of measurements, global coverage, consistently rising temperatures, case closed: The Earth is warming. Except for one problem. CRU’s average temperature data doesn’t jibe with that of Vincent Courtillot, a French geo-magneticist, director of the Institut de Physique du Globe in Paris, and a former scientific advisor to the French Cabinet. Last year he and three colleagues plotted an average temperature chart for Europe that shows a surprisingly different trend. Aside from a very cold spell in 1940, temperatures were flat for most of the 20th century, showing no warming while fossil fuel use grew. Then in 1987 they shot up by about 1 C and have not shown any warming since (below, enlarged here). This pattern cannot be explained by rising carbon dioxide concentrations, unless some critical threshold was reached in 1987; nor can it be explained by climate models.
Courtillot and Jean-Louis Le Mouel, a French geo-magneticist, and three Russian colleagues first came into climate research as outsiders four years ago. The Earth’s magnetic field responds to changes in solar output, so geomagnetic measurements are good indicators of solar activity. They thought it would be interesting to compare solar activity with climatic temperature measurements.
Their first step was to assemble a database of temperature measurements and plot temperature charts. To do that, they needed raw temperature measurements that had not been averaged or adjusted in any way. Courtillot asked Phil Jones, the scientist who runs the CRU database, for his raw data, telling him (according to one of the ‘Climategate’ emails that surfaced following the recent hacking of CRU’s computer systems) “there may be some quite important information in the daily values which is likely lost on monthly averaging.” Jones refused Courtillot’s request for data, saying that CRU had “signed agreements with national meteorological services saying they would not pass the raw data onto third parties.” (Interestingly, in another of the CRU emails, Jones said something very different: “I took a decision not to release our [meteorological] station data, mainly because of McIntyre,” referring to Canadian Steve McIntyre, who helped uncover the flaws in the hockey stick graph.)
Courtillot and his colleagues were forced to turn to other sources of temperature measurements. They found 44 European weather stations that had long series of daily minimum temperatures that covered most of the 20th century, with few or no gaps. They removed annual seasonal trends for each series with a three-year running average of daily minimum temperatures. Finally they averaged all the European series for each day of the 20th century.
CRU, in contrast, calculates average temperatures by month - rather than daily - over individual grid boxes on the Earth’s surface that are 5 degrees of latitude by 5 degrees of longitude, from 1850 to the present. First it makes hundreds of adjustments to the raw data, which sometimes require educated guesses, to try to correct for such things as changes in the type and location of thermometers. It also combines air temperatures and water temperatures from the sea. It uses fancy statistical techniques to fill in gaps of missing data in grid boxes with few or no temperature measurements. CRU then adjusts the averages to show changes in temperature since 1961-1990.
CRU calls the 1961-1990 the “normal” period and the average temperature of this period it calls the “normal.” It subtracts the normal from each monthly average and calls these the monthly “anomalies.” A positive anomaly means a temperature was warmer than CRU’s normal period. Finally CRU averages the grid box anomalies over regions such as Europe or over the entire surface of the globe for each month to get the European or global monthly average anomaly. You see the result in the IPCC graph nearby, which shows rising temperatures.
The decision to consider the 1961-1990 period as ‘normal’ was CRUs. Had CRU chosen a different period under consideration, the IPCC graph would have shown less warming, as discussed in one of the Climategate emails, from David Parker of the UK meteorological office. In it, Parker advised Jones not to select a different period, saying “anomalies will seem less positive than before if we change to newer normals, so the impression of global warming will be muted.” That’s hardly a compelling scientific justification!
In addition to calculating temperature averages for Europe, Courtillot and his colleagues calculated temperature averages for the United States. Once again, their method yielded more refined averages that were not a close match with the coarser CRU temperature averages. The warmest period was in 1930, slightly above the temperatures at the end of the 20th century. This was followed by 30 years of cooling, then another 30 years of warming.
Courtillot’s calculations show the importance of making climate data freely available to all scientists to calculate global average temperature according to the best science. Phil Jones, in response to the email hacking, said that CRU’s global temperature series show the same results as “completely independent groups of scientists.” Yet CRU would not share its data with independent scientists such as Courtillot and McIntyre, and Courtillot’s series are clearly different. Read more here.
Icecap Note: Finally see this exhaustive study by E.M. Smith on Musings from the Chiefio on NOAA’s global garbage bin GHCN which CRU and the media are using as confirmation that poor Phil Jones and Hadley did not manipulate data. See how in China, the Dragon Ate the Thermometers in this analysis by E.M. Smith here.
Also this animated gif shows the manipulation of the US temperatures. H/T Smokey on WUWT
------------------------
Would You Like Your Temperature Data Homogenized, or Pasteurized?
By Basil Copeland on Watts Up With That
A Smoldering Gun From Nashville, TN
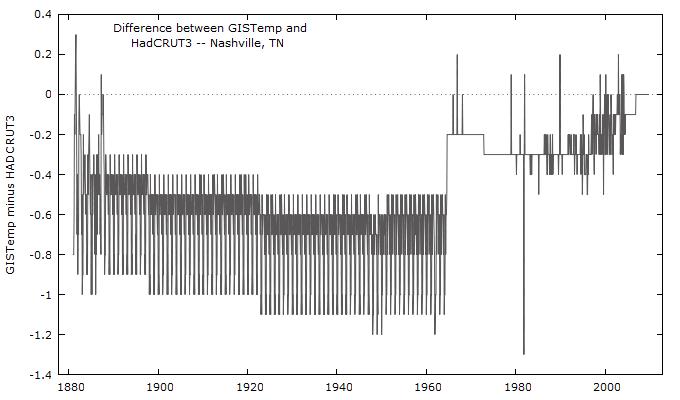
The hits just keep on coming. About the same time that Willis Eschenbach revealed “The Smoking Gun at Darwin Zero,” The UK’s Met Office released a “subset” of the HadCRUT3 data set used to monitor global temperatures. I grabbed a copy of “the subset” and then began looking for a location near me (I live in central Arkansas) that had a long and generally complete station record that I could compare to a “homogenized” set of data for the same station from the GISTemp data set. I quickly, and more or less randomly, decided to take a closer look at the data for Nashville, TN. In the HadCRUT3 subset, this is “72730” in the folder “72.” A direct link to the homogenized GISTemp data used is here. After transforming the row data to column data (see the end of the post for a “bleg” about this), the first thing I did was plot the differences between the two series (below, enlarged here):
The GISTemp homogeneity adjustment looks a little hockey-stickish, and induces an upward trend by reducing older historical temperatures more than recent historical temperatures. This has the effect of turning what is a negative trend in the HadCRUT3 data into a positive trend in the GISTemp version (below, enlarged here):
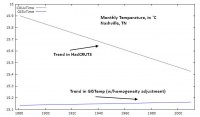
So what would appear to be a general cooling trend over the past ~130 years at this location when using the unadjusted HadCRUT3 data, becomes a warming trend when the homogeneity adjustment is supplied.
“There is nothing to see here, move along.” I do not buy that. Whether or not the homogeneity adjustment is warranted, it has an effect that calls into question just how much the earth has in fact warmed over the past 120-150 years (the period covered, roughly, by GISTemp and HadCRUT3). There has to be a better, more “robust” way of measuring temperature trends, that is not so sensitive that it turns negative trends into positive trends (which we’ve seen it do twice how, first with Darwin Zero, and now here with Nashville). I believe there is.
Temperature Data: Pasteurized versus Homogenized
In a recent series of posts, here, here, and with Anthony here, I’ve been promoting a method of analyzing temperature data that reveals the full range of natural climate variability. Metaphorically, this strikes me as trying to make a case for “pasteurizing” the data, rather than “homogenizing” it. In homogenization, the object is to “mix things up” so that it is “the same throughout.” When milk is homogenized, this prevents the cream from rising to the top, thus preventing us from seeing the “natural variability” that is in milk. But with temperature data, I want very much to see the natural variability in the data. And I cannot see that with linear trends fitted through homogenized data. It may be a hokey analogy, but I want my data pasteurized - as clean as it can be - but not homogenized so that I cannot see the true and full range of natural climate variability. See full post here.
See this post on GISS Raw Station Data Before and After Homogenization for an eye opening view into blatant data manipulation and truncation.
By Chip Knappenberger in SPPI
In science, as in most disciplines, the process is as important as the product. The recent email/data release (aka Climategate) has exposed the process of scientific peer-review as failing. If the process is failing, it is reasonable to wonder what this implies about the product.
Several scientists have come forward to express their view on what light Climategate has shed on these issues. Judith Curry has some insightful views here and here, along with associated comments and replies. Roger Pielke Jr. has an opinion, as no doubt do many others. Certainly a perfect process does not guarantee perfect results, and a flawed process does not guarantee flawed results, but the chances of a good result are much greater with the former than the latter. That’s why the process was developed in the first place.
Briefly, the peer-review process is this; before results are published in the scientific literature and documented for posterity, they are reviewed by one or more scientists who have some working knowledge of the topic but who are not directly associated with the work under consideration. The reviewers are typically anonymous and basically read the paper to determine if it generally seems like a reasonable addition to the scientific knowledge base, and that the results seem reproducible given the described data and methodology.
Generally, reviewers do not “audit” the results - that is, spend a lot of effort untangling the details of the data and or methodologies to see if they are appropriate, or to try to reproduce the results for themselves. How much time and effort is put into a peer review varies greatly from case to case and reviewer to reviewer. On most occasions, the reviewers try to include constructive criticism that will help the authors improve their work - that is, the reviewers serve as another set of eyes and minds to look over and consider the research, eyes that are more removed from the research than the co-authors and can perhaps offer different insights and suggestions.
Science most often moves forwards in small increments (with a few notable exceptions) and the peer-review process is designed to keep it moving efficiently, with as little back-sliding or veering off course as possible. It is not a perfect system, nor, do I think, was it ever intended to be. The guys over at RealClimate like to call peer-review a “necessary but not sufficient condition.”
Certainly is it not sufficient. But increasingly, there are indications that its necessity is slipping - and the contents of the released Climategate emails are hastening that slide. Personally, I am not applauding this decline. I think that the scientific literature (as populated through peer-review) provides an unparalleled documentation of the advance of science and that it should not be abandoned lightly. Thus, I am distressed by the general picture of a broken system that is portrayed in the Climategate emails.
Certainly there are improvements that could make the current peer-review system better, but many of these would be difficult to impose on a purely voluntary system. Full audits of the research would make for better published results, but such a requirement is too burdensome on the reviewers, who generally are involved in their own research (among other activities) and would frown upon having to spend a lot of time to delve too deeply into the nitty-gritty details of someone else’s research topic.
An easier improvement to implement would be a double-blind review process in which both the reviewers and the authors were unknown to each other. A few journals incorporate this double-blind review process, but the large majority does not. I am not sure why not. Such a process would go at least part of the way to avoiding pre-existing biases against some authors by some reviewers. Another way around this would be to have a fully open review process, in which the reviewers and author responses were freely available and open for all to see, and perhaps contribute. A few journals in fact have instituted this type of system, but not the majority.
Nature magazine a few years ago hosted a web debate on the state of scientific peer-review and possible ways of improving it. It is worth looking at to see the wide range of views and reviews assembled there. As it now stands, a bias can exist in the current system. That it does exist is evident in the Climategate emails. By all appearances, it seems that some scientists are interested in keeping certain research (and particular researchers) out of the peer-review literature (and national and international assessments derived there from). While undoubtedly these scientists feel that they are acting in the best interest of science by trying to prevent too much backsliding and thereby keeping things moving forward efficiently, the way that they are apparently going about it is far from acceptable.
Instead of improving the process, it has nearly destroyed it. If the practitioners of peer-review begin to act like members of an exclusive club controlling who and what gets published, the risk is run that the true course of science gets sidetracked. Even folks with the best intentions can be wrong. Having the process too tightly controlled can end up setting things back much further than a more loosely controlled process which is better at being self-correcting.
Certainly as a scientist, you want to see your particular branch of science move forward as quickly as possible, but pushing it forward, rather than letting it move on its own accord, can oftentimes prove embarrassing. As it was meant to be, peer-review is a necessary, but not sufficient condition. As it has become, however, the necessity has been eroded. And blogs have arisen to fill this need. In my opinion, blogs should serve as discussion places where ideas get worked out. The final results of which, should then be submitted to the peer-reviewed literature. To me, blogs are a 21st-century post-seminar beer outing, lunch discussion, or maybe even scientific conference. But they should not be an alternative to the scientific literature - a permanent documentation of the development of scientific ideas.
But, the rise of blogs as repositories of scientific knowledge will continue if the scientific literature becomes guarded and exclusive. I can only anticipate this as throwing the state of science and the quest for scientific understanding into disarray as we struggle to figure out how to incorporate blog content into the tested scientific knowledgebase. This seems a messy endeavor. Instead, I think that the current peer-review system either needs to be re-established or redefined. The single-blind review system seems to be an outdated one. With today’s technology, a totally open process seems preferable and superior - as long as it can be constrained within reason. At the very least, double-blind reviews should be the default. Maybe even some type of an audit system could be considered by some journals or some organizations.
Perhaps some good will yet come out of this whole Climategate mess - a fairer system for the consideration of scientific contribution, one that could less easily be manipulated by a small group of influential, but perhaps misguided, individuals. We can only hope. See PDF.
Confirmation of the Dependence of the ERA-40 Reanalysis Data on the Warm Bias in the CRU Data
By Roger Pielke Sr, Climate Science Blog
There is a remarkable admission in the leaked e-mails from Phil Jones of the dependence of the long term surface temperatures trends in the ERA-40 reanalysis on the surface temperature data from CRU. This is a very important issue as ERA-40 is used as one metric to assess multi-decadal global surface temperature trends, and has been claimed as an independent assessment tool from the surface temperature data. The report ECMWF Newsletter No. 115 - Spring 2008 overviews the role of ERA-40 in climate change studies.
The paper by Eugenia (Kalnay) that is presumably being referred to in the Phil Jones e-mails, which I have presented later in this post, is There is a remarkable admission in the leaked e-mails from Phil Jones of the dependence of the long term surface temperatures trends in the ERA-40 reanalysis on the surface temperature data from CRU.
This is a very important issue as ERA-40 is used as one metric to assess multi-decadal global surface temperature trends, and has been claimed as an independent assessment tool from the surface temperature data. The report ECMWF Newsletter No. 115 - Spring 2008 overviews the role of ERA-40 in climate change studies.
The paper by Eugenia (Kalnay) that is presumably being referred to in the Phil Jones e-mails, which I have presented later in this post, is Kalnay, E., and M. Cai, 2003: Impact of urbanization and land-use on climate change. Nature, 423, 528-531.
There are a number of subsequent papers that have built on the ‘observation minus reanalysis’ (OMR) method analysis methodology introduced by Eugenia including
Kalnay, E., M. Cai, H. Li, and J. Tobin, 2006: Estimation of the impact of land-surface forcings on temperature trends in eastern Unites States. J. Geophys. Res., 111, D06106,doi:10.1029/2005JD006555.
Lim, Y.-K., M. Cai, E. Kalnay, and L. Zhou, 2005: Observational evidence of sensitivity of surface climate changes to land types and urbanization. Geophys. Res. Lett., 32, L22712, doi:10.1029/2005GL024267.
Nunez, Mario N., H. H. Ciapessoni, A. Rolla, E. Kalnay, and M. Cai, 2008: Impact of land use and precipitation changes on surface temperature trends in Argentina. J. Geophys. Res. - Atmos., 113, D06111, doi:10.1029/2007JD008638, March 29, 2008
Fall, S., D. Niyogi, A. Gluhovsky, R. A. Pielke Sr., E. Kalnay, and G. Rochon, 2009: Impacts of land use land cover on temperature trends over the continental United States: Assessment using the North American Regional Reanalysis. Int. J. Climatol., DOI: 10.1002/joc.1996.
Following is the July 8 2004 e-mail from Phil Jones. I have made bold font the text that specifically refers to the conenction between the ERA-40 reanalysis and the CRU data.
From: Phil Jones
Subject: HIGHLY CONFIDENTIAL
Date: Thu Jul 8 16:30:16 2004
Mike,
Only have it in the pdf form. FYI ONLY - don’t pass on. Relevant paras are the last 2 in section 4 on p13. As I said it is worded carefully due to Adrian knowing Eugenia for years. He knows the’re wrong, but he succumbed to her almost pleading with him to tone it down as it might affect her proposals in the future ! I didn’t say any of this, so be careful how you use it - if at all. Keep quiet also that you have the pdf. The attachment is a very good paper - I’ve been pushing Adrian over the last weeks to get it submitted to JGR or J. Climate. The main results are great for CRU and also for ERA-40. The basic message is clear - you have to put enough surface and sonde obs into a model to produce Reanalyses. The jumps when the data input change stand out so clearly. NCEP does many odd things also around sea ice and over snow and ice.
The other paper by MM is just garbage - as you knew. De Freitas again. Pielke is also losing all credibility as well by replying to the mad Finn as well - frequently as I see it. I can’t see either of these papers being in the next IPCC report. Kevin and I will keep them out somehow - even if we have to redefine what the peer-review literature is !
Cheers
Phil
Mike,
For your interest, there is an ECMWF ERA-40 Report coming out soon, which shows that Kalnay and Cai are wrong. It isn’t that strongly worded as the first author is a personal friend of Eugenia. The result is rather hidden in the middle of the report. It isn’t peer review, but a slimmed down version will go to a journal. KC are wrong because the difference between NCEP and real surface temps (CRU) over eastern N. America doesn’t happen with ERA-40. ERA-40 assimilates surface temps (which NCEP didn’t) and doing this makes the agreement with CRU better. Also ERA-40’s trends in the lower atmosphere are all physically consistent where NCEP’s are not - over eastern US.
I can send if you want, but it won’t be out as a report for a couple of months.
Cheers
Phil
The claim that “ERA-40 assimilates surface temps (which NCEP didn’t) and doing this makes the agreement with CRU better” is a circular argument as the CRU data (or its close proxy) is what ERA-40 assimilates, so of course it is better!
The claim that “[a]lso ERA-40’s trends in the lower atmosphere are all physically consistent where NCEP’s are not - over eastern Us” must just mean that the ERA-40 agrees better with the IPCC model predictions. To use a model prediction to test a reanalysis trend product is, of course, a violation of the scientific process.
The e-mails from CRU documents sloppy science.
Since the ERA-4o data is a major climate assessment tool, the introduction of surface temperature data with a warm bias (e.g. see, see and see) means that ERA-40 necessarily also has a warm bias in the diagnosis of the magnitude of global warming. See post here.
Would You Like Your Temperature Data Homogenized, or Pasteurized?
By Basil Copeland on Watts Up With That
A Smoldering Gun From Nashville, TN
The hits just keep on coming. About the same time that Willis Eschenbach revealed “The Smoking Gun at Darwin Zero,” The UK’s Met Office released a “subset” of the HadCRUT3 data set used to monitor global temperatures. I grabbed a copy of “the subset” and then began looking for a location near me (I live in central Arkansas) that had a long and generally complete station record that I could compare to a “homogenized” set of data for the same station from the GISTemp data set. I quickly, and more or less randomly, decided to take a closer look at the data for Nashville, TN. In the HadCRUT3 subset, this is “72730” in the folder “72.” A direct link to the homogenized GISTemp data used is here. After transforming the row data to column data (see the end of the post for a “bleg” about this), the first thing I did was plot the differences between the two series (below, enlarged here):
The GISTemp homogeneity adjustment looks a little hockey-stickish, and induces an upward trend by reducing older historical temperatures more than recent historical temperatures. This has the effect of turning what is a negative trend in the HadCRUT3 data into a positive trend in the GISTemp version (below, enlarged here):
So what would appear to be a general cooling trend over the past ~130 years at this location when using the unadjusted HadCRUT3 data, becomes a warming trend when the homogeneity adjustment is supplied.
“There is nothing to see here, move along.” I do not buy that. Whether or not the homogeneity adjustment is warranted, it has an effect that calls into question just how much the earth has in fact warmed over the past 120-150 years (the period covered, roughly, by GISTemp and HadCRUT3). There has to be a better, more “robust” way of measuring temperature trends, that is not so sensitive that it turns negative trends into positive trends (which we’ve seen it do twice how, first with Darwin Zero, and now here with Nashville). I believe there is.
Temperature Data: Pasteurized versus Homogenized
In a recent series of posts, here, here, and with Anthony here, I’ve been promoting a method of analyzing temperature data that reveals the full range of natural climate variability. Metaphorically, this strikes me as trying to make a case for “pasteurizing” the data, rather than “homogenizing” it. In homogenization, the object is to “mix things up” so that it is “the same throughout.” When milk is homogenized, this prevents the cream from rising to the top, thus preventing us from seeing the “natural variability” that is in milk. But with temperature data, I want very much to see the natural variability in the data. And I cannot see that with linear trends fitted through homogenized data. It may be a hokey analogy, but I want my data pasteurized - as clean as it can be - but not homogenized so that I cannot see the true and full range of natural climate variability. See full post here.
See this post on GISS Raw Station Data Before and After Homogenization for an eye opening view into blatant data manipulation and truncation.
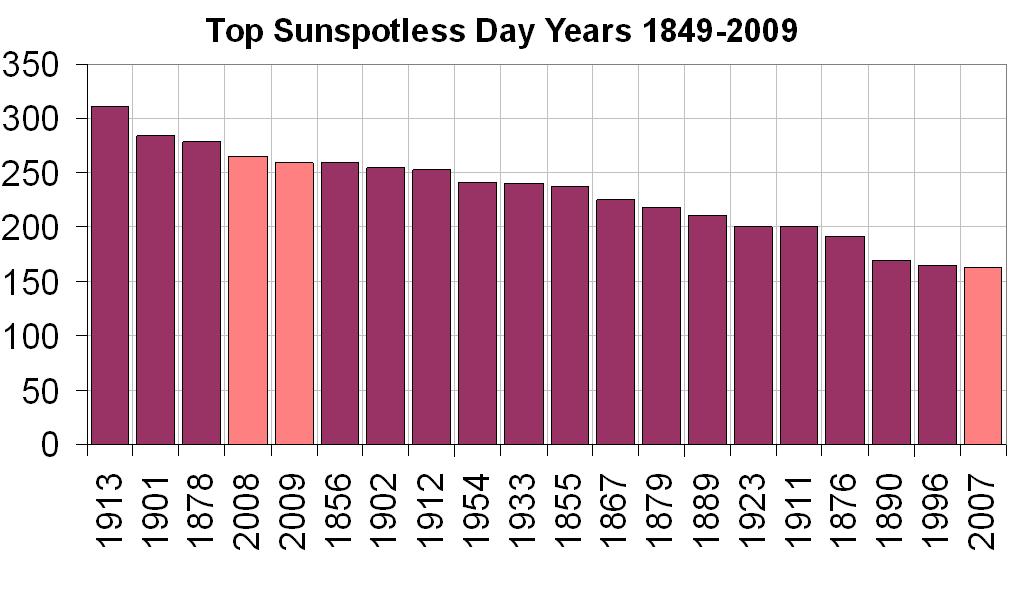
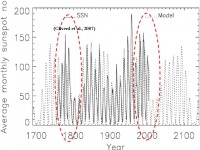
Tuesday marked the 16th straight day without a sunspot. According to spaceweather it marked the 259th sunspotless day this year and the 770th spotless day this minimum. During the day Wednesday, a few small spots emerged from a newly visible plage, an area of enhanced magnetic flux. This moves 2009 into a tie for 5th place with 1856 in the top 20 spotless years since 1849, when that kind of assessment became reasonable. See the enlarged image here.
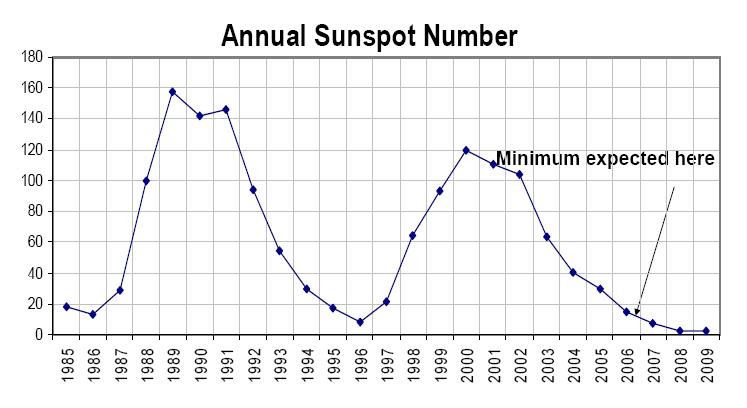
See how the sunspot number has not recovered from the expect minimum (declared by NASA first in December 2006!!!). See the enlarged image here.
This long cycle and the last 3 suggest that the phasing of the 213 year and 106 low solar cycles may be at work as it was in the late 1700s and the early 1800s, the so-called Dalton Minimum (below, enlarged here), the age of Dickens. Those days, snow was common in London. Ironically last winter was one of the snowiest in London in many a decade. Snow will fall next week in England (and Copenhagen). More later.

Enlarged here.
-------------------------------
See Dr. John Christy debate Gavin Schmidt on CNN below:
--------------------------------
Minnesotans For Global Warming announces our new Christmas Album “It’s A Climate Gate Christmas”. Actually there is no album all we have is the commercial.
This follows their parody for “Draggin the Line” by Tommy James and the Shondells about Climategate.
and their famous Minnesotans for Global Warming
An international group of scientists say there is an immediate need for a global assessment of the nitrogen cycle and its impact on climate.
On a planetary scale, human activities, especially fertiliser application, have more than doubled the amount of reactive nitrogen in circulation on land. This massive alteration of the nitrogen cycle affects climate, food security, energy security, human health and ecosystem health. The long-term consequences of these changes are yet to be fully realised, but the human impact on the nitrogen cycle has so far been largely missed in international environmental assessments.
Nitrogen’s role in climate change will be highlighted at an event on 7 December at the COP-15 United Nations Climate Change Conference in Copenhagen. Event organisers will be calling for a new assessment of nitrogen and climate, which will identify innovative nitrogen management strategies for global climate change mitigation and associated co-benefits to society.
Dr Cheryl Palm, the chair of the International Nitrogen Initiative (INI), which is organising the event, said “Nitrogen and climate interactions are not yet adequately included in the Intergovernmental Panel on Climate Change assessment process. There is an urgent need to assess the possibilities of nitrogen management for climate abatement and at the same time increase food security, while minimising environmental and human health impacts.”
Dr Palm added, “We believe that in tackling nitrogen new opportunities for climate abatement will be created.”
Professor Jan Willem Erisman from the Energy Research Centre of the Netherlands, who will speak at the event said: “An internationally-coordinated global nitrogen assessment is urgently required. A special report on nitrogen and climate is the natural first step.”
Kilaparti Ramakrishna, Senior Advisor on Environmental Law and Conventions at UNEP who will give the opening address at the side event said, “The nitrogen cycle is changing faster than that of any other element. In addition, the effects of reactive nitrogen are not limited to a single medium. A single molecule of reactive nitrogen may transition through many forms—ammonia, nitrogen oxide, nitric acid, nitrate and organic nitrogen—and may successively lead to a number of environmental, health and social impacts, including contributing to higher levels of ozone in the lower atmosphere. Over the last decade a number of global, regional and national initiatives have identified and addressed the issue of nutrient enrichment to the coastal zone. However, programmes are dispersed and fragmented and there is no single place to go for an overview of available information tools and mechanisms.”
Professor Sybil Seitzinger, Executive Director of the International Geosphere-Biosphere Programme said, “We have changed the complexity of the nitrogen cycle profoundly and are unaware of all the implications. In the meantime, policies that affect the nitrogen cycle are often made in isolation of the range of their impacts. This is in part because policies are made in departments/ministries with responsibility for only certain sectors (e.g., air, agriculture, etc.). Furthermore, the scientific community does not yet have an integrated understanding of the multiple impacts and feedbacks of changes in the nitorgen cycle, or the interconnections with other cycles, like carbon. An integrated global nitrogen assessment is needed as soon as possible. This will support the development of tools for policy makers to understand the multiple implications of their decision.”
The INI team believes that it is essential to untangle the complexity of the nitrogen and carbon cycle, identify the advantages of nitrogen management for climate abatement and investigates the costs and barriers to be overcome. Such an assessment needs to distinguish between developed areas where there is already an excess of nitrogen and the developing parts of the world where nitrogen management can help increase food security. Improved Nitrogen management will help limit fertilizer use, increase its efficiency and increase carbon sequestration in soils, decrease N2O emissions, while limiting other environmental and human health impacts.
The side event “Options for Including Nitrogen Management in Climate Policy Development” will be held in the US centre (Hall C5) from 6pm local time. The event will be followed by a networking reception supported by the Centre for Ecology & Hydrology (CEH), United Kingdom The organisers of the side event are the INI, CEH, the Ministry of Housing and Spatial Planning and Environment (VROM) of The Netherlands, the United Nations Environment Programme—Global Partnership on Nutrient Management (UNEP/GPNM), the David and Lucile Packard Foundation, SCOPE, the International Geosphere-Biosphere Programme, COST and the European Science Foundation Nitrogen in Europe Research Networking Programme (NinE-ESF).
Having been forced into some recognition of the fact that CO2 is not the demon as originally proposed, the social set have now found a second drum to beat so that as the demonization of CO2 fades, there will still be a “Problem” to solve! And considering it comprises 78% of our atmosphere versus just 0.038% for CO2, they have a bigger target. However man’s percentage impact is even smaller than with CO2. H/t JN
The Mathematics of Global WarmingBy Peter Landesman, The American Thinker
The forecasts of global warming are based on mathematical solutions for equations of weather models. But all of these solutions are inaccurate. Therefore, no valid scientific conclusions can be made concerning global warming. The false claim for the effectiveness of mathematics is an unreported scandal at least as important as the recent climate data fraud. Why is the math important? And why don’t the climatologists use it correctly?
Mathematics has a fundamental role in the development of all physical sciences. First, the researchers strive to understand the laws of nature determining the behavior of what they are studying. Then they build a model and express these laws in the mathematics of differential and difference equations. Next, the mathematicians analyze the solutions to these equations to improve the scientists’ understanding. Often the mathematicians can describe the evolution through time of the scientists’ model.
The most famous successful use of mathematics in this way was Isaac Newton’s demonstration that the planets travel in elliptical paths around the sun. He formulated the law of gravity (that the rate of change of the velocity between two masses is inversely proportional to the square of the distance between them) and then developed the mathematics of differential calculus to demonstrate his result.
Every college physics student studies many of the simple models and their successful solutions that have been found over the three hundred years since Newton. Engineers constantly use models and mathematics to gain insight into the physics of their field.
However, for many situations of interest, the mathematics become too difficult to be helpful. The mathematicians are unable to answer the scientist’s important questions because a complete understanding of the differential equations is beyond human knowledge. A famous, longstanding example is the n-body problem: if more than two planets are revolving around one another, according to the law of gravity, will the planets ram each other or will they drift out to infinity?
Fortunately, in the last fifty years, computers have been able to help mathematicians solve complex models over short time periods. Numerical analysts have developed techniques to graph solutions to differential equations and thus to yield new information about the model under consideration. All college calculus students use calculators to find solutions to simple differential equations called integrals. Space-travel is possible because computers can solve the n-body problem for short amounts of time and small n-values. The design of the stealth jet fighter could not have been accomplished without the computing speed of parallel processors. These successes have unrealistically raised the expectations for the application of mathematics to scientific problems.
Unfortunately, even assuming the model of the physics is correct, computers and mathematicians cannot solve more difficult problems, such as weather equations, for several reasons. First, the solution may require more computations than computers can make. Faster and faster computers push back the speed barrier every year. Second, it may be too difficult to collect enough data to accurately determine the initial conditions of the model. Third, the equations of the model may be non-linear. This means that no simplification of the equations can accurately predict the properties of the solutions of the differential equations. The solutions are often unstable. This means that a small variation in initial conditions will lead to large variations some time later. This property makes it impossible to compute solutions over long time periods.
As an expert in the solutions of non-linear differential equations, I can attest to the fact that the more than two-dozen non-linear differential equations in weather models are too difficult for humans to have any idea how to solve accurately. No approximation over long time periods has any chance of accurately predicting global warming. Yet approximation is exactly what the global warming advocates are doing. Each of the more than thirty models being used around the world to predict the weather is just a different inaccurate approximation of the weather equations. (Of course, this is an issue only if the model of the weather is correct. It is probably not, because the climatologists probably do not understand all of the physical processes determining the weather.)
Therefore, one cannot logically conclude that any of the global warming predictions are correct. To base economic policy on the wishful thinking of these so-called scientists is just foolhardy from a mathematical point of view. The leaders of the mathematical community, ensconced in universities flush with global warming dollars, have not adequately explained to the public the above facts.
President Obama should appoint a Mathematics Czar to consult before he goes to Copenhagen. See post here.
Icecap Note: Kevin Trenberth, a Lead Author for IPCC 4th Assessment on the Nature blog back in June 27th admitted “In fact there are no predictions by IPCC at all. And there never have been. The IPCC instead proffers “what if” projections of future climate that correspond to certain emissions scenarios. None of the models used by IPCC are initialized to the observed state and none of the climate states in the models correspond even remotely to the current observed climate. In particular, the state of the oceans, sea ice, and soil moisture has no relationship to the observed state at any recent time in any of the IPCC models. There is neither an El Nino sequence nor any Pacific Decadal Oscillation that replicates the recent past; yet these are critical modes of variability that affect Pacific rim countries and beyond. In the whistleblower emails Trenberth laments “The fact is that we can’t account for the lack of warming at the moment” - this “moment” is in its second decade-"and it is a travesty that we can’t.”
Also Gerard Roe, an associate professor of earth and space sciences at the University of Washington-Seattle said “Small uncertainties in the physical processes are amplified into large uncertainties in the climate response, and there is nothing we can do about that.”
Copenhagen Realist Videos
Dear friends,
As representatives of the nations of the world meet in Copenhagen on Monday to attempt to restrict the use of energy produced from coal, gas and oil in the guise of fighting global warming, many scientists and scholars are expressing grave concerns about what they are trying to do. Recognizing these concerns, we have posted a series of YouTube video vignettes in which such scientists and scholars present the reasons behind them.
We invite you to view the videos and do all you can to inform the public about their presence. Each of the videos can be accessed from the CO2 Science website, from the CO2Science YouTube channel , and other locations across the Internet, such as here. A categorized-list of the videos we have posted is presented on these sites. More will be added early this week.
Wise decisions are made only when all pertinent aspects of an issue are examined. It is our sincere hope that the information presented in these videos will elucidate important truths that are presently ignored.
With kind regards,
Craig Idso, Ph.D.
Chairman
Center for the Study of Carbon Dioxide and Global Change
See also audio interviews with many scientists on Its Rainmaking Time here. See live coverage here from AFP including a live video with special guest Lord Monckton, who is a leading expert—and a YouTube sensation—on the U.N. Conference on Wednesday December 9th at 12:00PM EST
------------------------------------
CBC’s Murphy Unloads About ClimateGate
Canadian CBC TV commentator Rex Murphy, unleashed on the top UN scientists involved in the growing Climategate scandal during a December 3, 2009 television broadcast. CBC’s Murphy declared that Climategate “pulls back the curtain on a scene of pettiness, turf protection, manipulation, defiance of freedom of information, loss or destroyed data and attempts to blacklist critics or skeptics of the global warming cause.”
“You wouldn’t accept that at a grade 9 science fair,” Murphy stated. Murphy’s commentary appeared on “The National” program, CBC’s flagship nightly news program.
Watch Full Rex Murphy Video here. Murphy was a former a executive assistant to the leader of the Liberal Party of Newfoundland. (Also see viewers growing frustration at lack of coverage of Climategate on broadcast TV. See: Video: Canadian news heckled on live TV: ‘Climategate: It Wont Go Away. Report it, CBC!’ “Climate science and global warming advocacy have become so entwined, so enmeshed into a mutant creature,” he added.
“Climategate is evidence that the science has gone to bed with advocacy and both have had a very good time,” Murphy continued. Murphy’s criticism aims directly for the top UN scientists involved in this scandal.
“Too many of the current leadership on global warming are more players than observers. Gatekeepers not investigators. Angry partisans of some global reengineering, rather than some humble servants of the facts of the case,” Murphy explained. “Read the emails, you will never think of climate science, quite the same way again,” Murphy implored. “Let’s here no more talk of the ‘science is settled’ when it turns out some of the principle scientists behave as if they own the very question of global warming,” he added.
“Climate science has been shown to be in part to be a sub branch of climate politics,” Murphy explained. “Climate science needs its own reset button,” he added.
--------------------------
Also the NYT’s Friedman on CNN “Ignores Cost, Insists Action on Climate Change is Necessary Regardless of Risk”. Showing his elitist roots, Friedman who has expertise in Middle East and globalism is suddenly a self-proclaimed expert (and author) on climate change. Watch him show how little he really knows about what is breaking here and the degree of pain for no gain or need for the remedies he supports.
---------------------------
Houston: we have a problem - it’s snowing!
UPDATE: A new record snowfall of 1.00 inch was set at Houston Intercontinental Friday. This was the earliest snowfall of the season that has been recorded since the 1880’s when the current official records began in downtown Houston. The previous earliest snow occurred last year on December 10th 2008 and December 10th back in 1944.
Anthony Watts, Watts Up With That
From the “it’s weather not climate department” - I never thought I’d see this today on the header of the Houston Chronicle: The snow is the earliest on record. Of note is the fact that in 2008, it snowed in Houston on December 10th. Place your bets for next year.
Houston braces for about 2 inches of snow. Some in Houston area may even see half a foot of the white stuff.
By Eric Berger and Peggy O’Hare, Houston Chronicle
Houston this morning broke a record with the earliest snowfall ever recorded in the city’s history. Forecasters are still hedging their bets on the amount, but say the most likely scenario is 1 to 2 inches of widespread snowfall through the day. Some areas could get up to a half a foot.

Light snow already was falling downtown and in other areas before 8:30 a.m. Other forms of precipitation - such as rain, freezing, rain, sleet and hail - also have been reported. Houston’s main weather recording station at Bush Intercontinental Airport reported at trace of snow at 8 a.m., meaning Dec. 4 will go down as the new record.
But emergency management officials say snow isn’t the biggest concern - it’s icy roads. A 12-hour freeze period is expected to begin after sundown today, continuing into Saturday, which could cause hazardous driving conditions.
A freeze warning has been issued for more than 20 Texas counties, including the coastal counties of Chambers, Galveston, Brazoria, Matagorda and Jackson, extending northward through Harris, Montgomery, Fort Bend, Wharton and Liberty counties, then stretching as far northwest as the cities of Bryan and College Station and as far northeast as Trinity and Polk counties.
“Even though we can’t say for sure this weather event is going to occur, we can definitely say our confidence has increased substantially compared to three or four days ago,” said Fred Schmude, a meteorologist with ImpactWeather, a private, Houston-based forecasting service.
In other news: Dr. James Hansen is coming to Houston to promote his new book Storms of my Grandchilden.
Is he thinking snowstorms? See post here.
PS Kyle posted this image on WUWT from Houston (below, enlarged here):
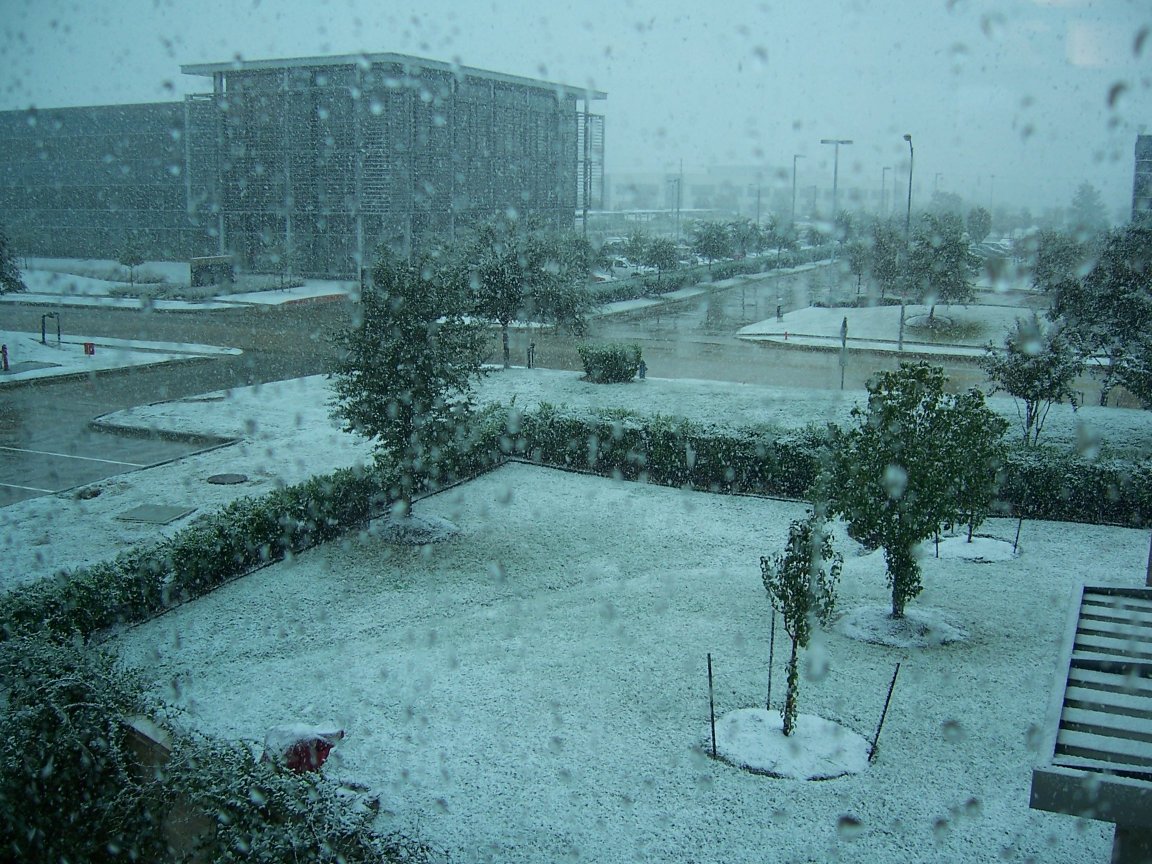

Anthony also shows how CRU sought and received big money from BIG OIL here. Now who is the shill for Big Oil again? Next time somebody brings up that ridiculous argument about skeptics, show them this. h/t and thanks to WUWT reader “boballab”
By John Coleman
“I was wrong.” This simple three word phrase is almost impossible to say because it changes everything. It is easiest for a child to say it. After all a child isn’t expected to right about things. But the higher you climb through life the more difficult it comes to admit being wrong. It would be devastating for a President of the United States to say, “I was wrong.” And, it may be about as difficult for an established, respected scientist who does research at an institution funded by millions of tax dollars. That is why I don’t expect any of the scientists caught by the Climategate leak, to admit “I was wrong” anytime soon.
Consider the case of Roger Revelle, the Grandfather of Global Warming. He didn’t say “I was wrong” through all the years he was heading up the Scripps Oceanographic Institute or the Harvard Population Studies program. He waited until he was in a retirement job back as UCSD, a mere professor without any research or grant monies coming in, to admit he was wrong about CO2 being an important greenhouse gas. But to his credit, he did say it in his final years (see post here). I respect that he did clear the air before leaving the scene. I regret that Al Gore and IPCC and the media were no longer listening to him.
The media rarely has said, “We were wrong.” I have worked in newsrooms for 56 years. I have never heard it. In fact, I cannot recall that I have ever heard “We were wrong.” I have on several occasions heard, “We were miss-informed”, “We were misled” and even “We were duped”, On several occasions I have heard “We must correct this item”. but even on these rare occasions there is great reluctance. It would take a monumental event to force the media to say “We were wrong.”
The media also claims to be unbiased. Everybody knows that is not true. “Fair and balanced”, is a great slogan, but not a reality. I have witnessed that bias at all three of the old-line networks (yes, I did the circuit.) and major market network stations. There happens to be less bias and better balance at the small independent station where I work in my retirement job than anywhere else I have worked. But still every person in the newsroom, including me, comes to work with personal biases and as hard as we try to set them aside at work, they shine through from time to time.
Generally speaking, people who launch media careers are ‘do gooders’, wanting to inform the people about how to make the world and their communities better places. It comes off, mostly, as a liberal bias. Most news people in the United States voted for Al Gore. They support the United Nations. They want to advance the environmental issues of clean water and clean air and protect our natural areas.
So when global warming came along they accepted it immediately and without question as a major environmental challenge that they needed to tell the public about and felt they needed to help bring about the changes required to solve the problem. For years and years, peaking with the Al Gore movie and the UN conference in Bali, every scientific paper about melting ice, the plight of polar bears, the fear of flooding coast lines and the entire spectrum of farfetched global warming related claims and studies were reported with importance and without question. The media felt it was doing great service to save the planet. And the bosses knew there is nothing that builds ratings more than claims “the sky is falling.” The skeptics were regarded as cranks and shills for evil polluters such as the oil companies. If they got coverage at all, it was negative.
Now comes Climategate. It is out of step with the media agenda. What does the media do now. Ignore it is the first answer. Regard it as an unimportant story. Not nearly as important as Tiger Woods or the couple that crashed a White House party. It is just another hacker and undoubtedly the work of one of those oil company shills. Yes, ignore it. It will fade away. The other answer was to write about its general unimportance and give the parties involved a platform to dismiss the charges. Various outlets took minor steps to cover in a limited dismissive way but the major networks stonewalled.
You must know this about the leaked files. While the emails were damming, the real ‘meat’ was in sections of computer code leaked. Skeptical climate scientists have already studied it and find it an amazing manipulation that takes real temperature data and turns into a warming fairytale. Since this data forms the baseline for the research used by the United Nations Intergovernmental Panel on Climate Change, this is huge. Those who counter this argument, by saying there three other data bases and the two that use surface temperatures agree with this data, need to rethink what they are saying. Think about it. This indicates that since the Angelica University data is scientifically meaningless, and the scientists at the other centers are in constant contact with the scientists there, there is a strong likelihood their data is similarly without scientific merit.
Meanwhile, I am very impressed with the wide ranging internet coverage; the blogs and postings. It is mostly of excellent quality, too. Media News Editors, Producers and columnists and opinion page editors all use the internet for ideas and research. This has been a forcing factor to the media. As a result, a few have picked up on the internet items. The AP has posted some stories. But still the television news channels and networks (except for Fox) have ignored the story as much as they can.
While there will be continuing ramifications in science and among the researchers and organizations involved, without significant media coverage, Climategate will soon fade away. We skeptics will continue to talk about it, but no one will be listening. Things will quiet down to “normal”.
There is one possibility that could grow Climategate and demand mainstream coverage. That possibility is my hope. I hope the person who leaked the damming files comes out of the shadow and speaks out about the outrage of what is transpiring among the global warming team. That person had to feel strongly about to perform the leak. And, if that person is an important scientist or is accompanied by a prominent scientist, that could break Climategate into the headlines.
If Al Gore or Michael Mann or Jim Hanson were to say “I was wrong”, it become a major news development and global warming frenzy would be dead.
I am not holding my breath.
See this post and other Coleman Corner posts here.
The American Geophysical Union is sending science back four hundred years
By Willie Soon and David R. Legates
Four centuries ago, “heretics” who disagreed with religious orthodoxy risked being burned at the stake. Many were the dissenting views that could send offenders to a fiery end.
In 1633, the astronomer Galileo Galilei may have come within a singed whisker of the same fate, for insisting that the sun (and not the Earth) was at the center of the solar system. In the end, he agreed to recant his “heresy” (at least publicly) and submit to living under house arrest until the end of his days.
Growing evidence ultimately proved Galileo was right, and the controversy dissipated. Theology gave way to nature in determining the truth about nature.
We wish that were the case today. Unfortunately, lessons learned 400 years ago have yet to be adopted where the Church of Anthro-Climatism is involved. Burning dissenters at the stake may no longer be an option - perhaps because it would send prodigious quantities of carbon dioxide into the atmosphere. However, many other ingenious punishments are often meted out, to ensure that dissent is kept within “acceptable” limits, or dissenters no longer dissent.
Just recently, as scientists who specialize in environmental science, climatology, and solar variability, we welcomed the acceptance of our scientific session, Diverse Views from Galileo’s Window: Researching Factors and Processes of Climate Change in the Age of Anthropogenic CO2. The session was to be hosted at the upcoming Fall 2009 Meeting of the American Geophysical Union (AGU) in San Francisco.
Our session was to focus on “knowledge that spans an extremely diverse range of expertise” and provides “an integrated assessment of the vast array of disciplines that affect and, in turn, are affected by the Earth’s climate.” Our ultimate goal was to stimulate discussion at this professional meeting, prior to the upcoming UN Intergovernmental Panel on Climate Change (IPCC) fifth assessment report.
We developed this session to honor the great tradition of science and scientific inquiry, as exemplified by Galileo when, 400 years ago this year, he first pointed his telescope at the Earth’s moon and at the moons of Jupiter, analyzed his findings, and subsequently challenged the orthodoxy of a geocentric universe. Our proposed session was accepted by the AGU.
In response to its acceptance, we were joined by a highly distinguished group of scientists - including members of the National Academy of Sciences of the USA, France and China, as well as recipients of the AGU’s own William Bowie, Charles Whitten and James MacElwane medals. Our participants faithfully submitted abstracts for the session.
But by late September, several puzzling events left us wondering whether the AGU truly serves science and environmental scientists - or simply reflects, protects and advances the political agendas of those who espouse belief in manmade CO2-induced catastrophic global warming.
On September 14, Dr. Nicola Scafetta of Duke University contacted us, to say the AGU had cancelled his previously-approved 12-paper session on Solar Variability and Its Effect on Climate Change, since it did not have enough papers. He asked if the papers from his session could be merged into our session; since they fit our theme well, we accepted his papers.
The merger was approved by the AGU Planning Committee. Thus our Galileo session now had grown to a total of 27 papers and was approved as a poster session at the Fall Meeting. However, a few days later, after first approving our session and after we had assigned time slots for these new papers at AGU’s request, the Planning Committee revoked its approval and summarily dissolved our session. Now the committee claimed our session was “thematically divergent,” and divided the papers in our original session among six different sessions.
To cover its tracks, the committee created a new session called Diverse Views from Galileo’s Window: Solar Forcing of Climate Change with 15 papers - including the 12 from Dr. Scafetta’s original session that it had cancelled. That reduced the focus of this session to just solar forcing of climate, and eliminated discussions of the impact of anthropogenic CO2 that we had planned for our original session. The remaining papers from our cancelled session were moved to five other sessions, thereby undermining our original intent: comparing solar variability and manmade carbon dioxide as factors in planetary climate change.
In responding to us, the Planning Committee defended its actions by asserting: “none of [the papers in our session] have to do with the Galilean moons of Saturn [sic], which have to do with climate change or solar activity.” That claim reflects either a poor grasp of our purpose or a failure to read our proposal - and leads the question, Why wasn’t this issue raised when they originally decided to accept our session?
Our session proposal had clearly intended to honor Galileo’s observations of Jupiter’s (not Saturn’s) moons, which had led him to challenge the orthodoxy of the geocentric universe. We wanted to highlight how current research into the climatic effects of anthropogenic CO2 is challenging the supposed “scientific consensus” that humans are causing catastrophic climate change.
This arbitrary dissolution of our original session has serious implications for proper scientific enquiry. Our request that the session be reinstated has gone unheeded, despite the fact that the AGU has reinstated at least one cancelled session in the past. We have repeatedly been told that the decisions of the Planning Committee are final, though it has made clearly contradictory decisions regarding our session.
Reduced sunspot activity and solar energy output, stable or even cooling planetary temperatures, concerns over the high cost of proposed cap-and-trade legislation, political developments in Washington and Copenhagen, and other factors have caused more people to question manmade global warming disaster claims. This has led to consternation among scientists and organizations that have supported those claims.
However, as scientists, we are profoundly concerned by this behavior from a professional society that is supposed to serve science and its members. The AGU certainly had the right to reject our proposed session at the outset or before the solar variability session was merged with it. But given the topic of our session and the good faith approach we have taken in accepting papers from the cancelled solar variability session, it seems odd (at the very least) that our session was summarily dissolved, and that the AGU refuses to discuss the matter.
The AGU action is hardly reasonable. Indeed, it is counter-productive to the scientific method and to promoting open scientific discussions. It smacks of censorship. Something is rotten in Copenhagen, Denmark. Scientific inquiry has once again been silenced...just as it was 400 years ago. The AGU should be ashamed. Its members should be outraged.
Dr. Willie Soon is a scientist who studies solar and climate co-variability. Dr. David Legates is a scientist who studies climatology and hydrology. Both are members of the American Geophysical Union.
----------------------------
The once great Scientific American on a downward death spiral? See this post by Lubos Motl here.
By Roger Pielke Sr.
On the weblog Dot Earth today, there is text from Michael Schlesinger, a climatologist at the University of Illinois, that presents analyses of long term surface temperature trends from NASA, NCDC and Japan as if these are from independent sets of data from the analysis of CRU. Andy Revkin is perpetuating this myth in this write-up by not presenting the real fact that these analyses draw from the same original raw data. While they may use only a subset of this raw data, the overlap has been estimated as about 90-95%.
The unresolved problems with this surface data (which, of course, applies to all four locations) is reported in the peer reviewed paper
Pielke Sr., R.A., C. Davey, D. Niyogi, S. Fall, J. Steinweg-Woods, K. Hubbard, X. Lin, M. Cai, Y.-K. Lim, H. Li, J. Nielsen-Gammon, K. Gallo, R. Hale, R. Mahmood, S. Foster, R.T. McNider, and P. Blanken, 2007: Unresolved issues with the assessment of multi-decadal global land surface temperature trends. J. Geophys. Res., 112, D24S08, doi:10.1029/2006JD008229.
I discuss this issue in my recent post
Further Comment On The Surface Temperature Data Used In The CRU, GISS And NCDC Analyses where I document that even the CCSP 1.1. report acknowledged this lack of independence.
Andy Revkin’s post on the surface temperature record data sets is not journalistically accurate. See Roger’s post here.
By Declan McCullagh, CBS On-line
A few days after leaked e-mail messages appeared on the Internet, the U.S. Congress may probe whether prominent scientists who are advocates of global warming theories misrepresented the truth about climate change.
Sen. James Inhofe, an Oklahoma Republican, said on Monday the leaked correspondence suggested researchers “cooked the science to make this thing look as if the science was settled, when all the time of course we knew it was not,” according to a transcript of a radio interview posted on his Web site. Aides for Rep. Darrell Issa, a California Republican, are also looking into the disclosure.
A few days after leaked e-mail messages appeared on the Internet, the U.S. Congress may probe whether prominent scientists who are advocates of global warming theories misrepresented the truth about climate change.
The leaked documents (see our previous coverage) come from the Climatic Research Unit of the University of East Anglia in eastern England. In global warming circles, the CRU wields outsize influence: it claims the world’s largest temperature data set, and its work and mathematical models were incorporated into the United Nations Intergovernmental Panel on Climate Change’s 2007 report. That report, in turn, is what the Environmental Protection Agency acknowledged it “relies on most heavily” when concluding that carbon dioxide emissions endanger public health and should be regulated.
Last week’s leaked e-mails range from innocuous to embarrassing and, critics believe, scandalous. They show that some of the field’s most prominent scientists were so wedded to theories of man-made global warming that they ridiculed dissenters who asked for copies of their data ("have to respond to more crap criticisms from the idiots"), cheered the deaths of skeptical journalists, and plotted how to keep researchers who reached different conclusions from publishing in peer-reviewed journals.
One e-mail message, apparently from CRU director Phil Jones, references the U.K.’s Freedom of Information Act when asking another researcher to delete correspondence that might be disclosed in response to public records law: “Can you delete any emails you may have had with Keith re AR4? Keith will do likewise.” Another, also apparently from Jones: global warming skeptics “have been after the CRU station data for years. If they ever hear there is a Freedom of Information Act now in the UK, I think I’ll delete the file rather than send to anyone.” (Jones was a contributing author to the chapter of the U.N.’s IPCC report titled “Detection of Climate Change and Attribution of Causes.")
In addition to e-mail messages, the roughly 3,600 leaked documents posted on sites including Wikileaks.org and EastAngliaEmails.com include computer code and a description of how an unfortunate programmer named “Harry”—possibly the CRU’s Ian “Harry” Harris—was tasked with resuscitating and updating a key temperature database that proved to be problematic. Some excerpts from what appear to be his notes, emphasis added:
I am seriously worried that our flagship gridded data product is produced by Delaunay triangulation - apparently linear as well. As far as I can see, this renders the station counts totally meaningless. It also means that we cannot say exactly how the gridded data is arrived at from a statistical perspective - since we’re using an off-the-shelf product that isn’t documented sufficiently to say that. Why this wasn’t coded up in Fortran I don’t know - time pressures perhaps? Was too much effort expended on homogenisation, that there wasn’t enough time to write a gridding procedure? Of course, it’s too late for me to fix it too. Meh.
I am very sorry to report that the rest of the databases seem to be in nearly as poor a state as Australia was. There are hundreds if not thousands of pairs of dummy stations, one with no WMO and one with, usually overlapping and with the same station name and very similar coordinates. I know it could be old and new stations, but why such large overlaps if that’s the case? Aarrggghhh! There truly is no end in sight… So, we can have a proper result, but only by including a load of garbage!
One thing that’s unsettling is that many of the assigned WMo codes for Canadian stations do not return any hits with a web search. Usually the country’s met office, or at least the Weather Underground, show up – but for these stations, nothing at all. Makes me wonder if these are long-discontinued, or were even invented somewhere other than Canada!
Knowing how long it takes to debug this suite - the experiment endeth here. The option (like all the anomdtb options) is totally undocumented so we’ll never know what we lost. 22. Right, time to stop pussyfooting around the niceties of Tim’s labyrinthine software suites - let’s have a go at producing CRU TS 3.0! since failing to do that will be the definitive failure of the entire project.
Ulp! I am seriously close to giving up, again. The history of this is so complex that I can’t get far enough into it before by head hurts and I have to stop. Each parameter has a tortuous history of manual and semi-automated interventions that I simply cannot just go back to early versions and run the update prog. I could be throwing away all kinds of corrections - to lat/lons, to WMOs (yes!), and more. So what the hell can I do about all these duplicate stations?…
As the leaked messages, and especially the HARRY_READ_ME.txt file, found their way around technical circles, two things happened: first, programmers unaffiliated with East Anglia started taking a close look at the quality of the CRU’s code, and second, they began to feel sympathetic for anyone who had to spend three years (including working weekends) trying to make sense of code that appeared to be undocumented and buggy, while representing the core of CRU’s climate model.
One programmer highlighted the error of relying on computer code that, if it generates an error message, continues as if nothing untoward ever occurred. Another debugged the code by pointing out why the output of a calculation that should always generate a positive number was incorrectly generating a negative one. A third concluded: “I feel for this guy. He’s obviously spent years trying to get data from undocumented and completely messy sources.”
Programmer-written comments inserted into CRU’s Fortran code have drawn fire as well. The file briffa_sep98_d.pro says: “Apply a VERY ARTIFICAL correction for decline!!” and “APPLY ARTIFICIAL CORRECTION.” Another, quantify_tsdcal.pro, says: “Low pass filtering at century and longer time scales never gets rid of the trend - so eventually I start to scale down the 120-yr low pass time series to mimic the effect of removing/adding longer time scales!”
It’s not clear how the files were leaked. One theory says that a malicious hacker slipped into East Anglia’s network and snatched thousands of documents. Another says that the files had already been assembled in response to a Freedom of Information request and, immediately after it was denied, a whistleblower decided to disclose them. (Lending credence to that theory is the fact that no personal e-mail messages unrelated to climate change appear to have been leaked.)
For its part, the University of East Anglia has posted a statement calling the disclosure “mischievous” and saying it is aiding the police in an investigation.
The statement also quotes Jones, CRU’s director, explaining his November 1999 e-mail, which said: “I’ve just completed Mike’s Nature trick of adding in the real temps to each series for the last 20 years (ie from 1981 onwards) amd from 1961 for Keith’s to hide the decline.” Jones said that the word trick was used “colloquially as in a clever thing to do” and that it “is ludicrous to suggest that it refers to anything untoward.”
Also unclear is the ultimate impact of the leak, which came before next month’s Copenhagen summit and Democratic plans for cap and trade legislation.
On one hand, over at RealClimate.org, Gavin Schmidt, a modeler for the NASA Goddard Institute for Space Studies, has been downplaying the leak. Schmidt wrote: “There is no evidence of any worldwide conspiracy, no mention of George Soros nefariously funding climate research ... no admission that global warming is a hoax, no evidence of the falsifying of data, and no ‘marching orders’ from our socialist/communist/vegetarian overlords.”
On the other, groups like the free-market Competitive Enterprise Institute, the target of repeated derision in the leaked e-mails, have said: “We have argued for many years that much of the scientific case for global warming alarmism was weak and some of it was phony. It now looks like a lot of it may be phony.”
ScienceMag.org published an article noting that deleting e-mail messages to hide them from a FOI request is a crime in the United Kingdom. George Monbiot, a U.K. activist and journalist who previously called for dramatic action to deal with global warming, wrote: “It’s no use pretending that this isn’t a major blow. The emails extracted by a hacker from the climatic research unit at the University of East Anglia could scarcely be more damaging.”
Read more of this excellent coverage by CBS here.
By Phil Green, Financial Post
A French scientist’s temperature data show results different from the official climate science. Why was he stonewalled? Climate Research Unit emails detail efforts to deny access to global temperature data.
By Phil Green
The global average temperature is calculated by climatologists at the Climatic Research Unit (CRU) at the University of East Anglia. The temperature graph the CRU produces from its monthly averages is the main indicator of global temperature change used by the International Panel on Climate Change, and it shows a steady increase in global lower atmospheric temperature over the 20th century. Similar graphs for regions of the world, such as Europe and North America, show the same trend. This is consistent with increasing industrialization, growing use of fossil fuels, and rising atmospheric concentrations of carbon dioxide.
It took the CRU workers decades to assemble millions of temperature measurements from around the globe. The earliest measurements they gathered came from the mid 19th century, when mariners threw buckets over the side of their square riggers and hauled them up to measure water temperature. Meteorologists increasingly started recording regular temperature on land around the same time. Today they collect measurements electronically from national meteorological services and ocean-going ships.
Millions of measurements, global coverage, consistently rising temperatures, case closed: The Earth is warming. Except for one problem. CRU’s average temperature data doesn’t jibe with that of Vincent Courtillot, a French geo-magneticist, director of the Institut de Physique du Globe in Paris, and a former scientific advisor to the French Cabinet. Last year he and three colleagues plotted an average temperature chart for Europe that shows a surprisingly different trend. Aside from a very cold spell in 1940, temperatures were flat for most of the 20th century, showing no warming while fossil fuel use grew. Then in 1987 they shot up by about 1 C and have not shown any warming since (below, enlarged here). This pattern cannot be explained by rising carbon dioxide concentrations, unless some critical threshold was reached in 1987; nor can it be explained by climate models.
Courtillot and Jean-Louis Le Mouel, a French geo-magneticist, and three Russian colleagues first came into climate research as outsiders four years ago. The Earth’s magnetic field responds to changes in solar output, so geomagnetic measurements are good indicators of solar activity. They thought it would be interesting to compare solar activity with climatic temperature measurements.
Their first step was to assemble a database of temperature measurements and plot temperature charts. To do that, they needed raw temperature measurements that had not been averaged or adjusted in any way. Courtillot asked Phil Jones, the scientist who runs the CRU database, for his raw data, telling him (according to one of the ‘Climategate’ emails that surfaced following the recent hacking of CRU’s computer systems) “there may be some quite important information in the daily values which is likely lost on monthly averaging.” Jones refused Courtillot’s request for data, saying that CRU had “signed agreements with national meteorological services saying they would not pass the raw data onto third parties.” (Interestingly, in another of the CRU emails, Jones said something very different: “I took a decision not to release our [meteorological] station data, mainly because of McIntyre,” referring to Canadian Steve McIntyre, who helped uncover the flaws in the hockey stick graph.)
Courtillot and his colleagues were forced to turn to other sources of temperature measurements. They found 44 European weather stations that had long series of daily minimum temperatures that covered most of the 20th century, with few or no gaps. They removed annual seasonal trends for each series with a three-year running average of daily minimum temperatures. Finally they averaged all the European series for each day of the 20th century.
CRU, in contrast, calculates average temperatures by month - rather than daily - over individual grid boxes on the Earth’s surface that are 5 degrees of latitude by 5 degrees of longitude, from 1850 to the present. First it makes hundreds of adjustments to the raw data, which sometimes require educated guesses, to try to correct for such things as changes in the type and location of thermometers. It also combines air temperatures and water temperatures from the sea. It uses fancy statistical techniques to fill in gaps of missing data in grid boxes with few or no temperature measurements. CRU then adjusts the averages to show changes in temperature since 1961-1990.
CRU calls the 1961-1990 the “normal” period and the average temperature of this period it calls the “normal.” It subtracts the normal from each monthly average and calls these the monthly “anomalies.” A positive anomaly means a temperature was warmer than CRU’s normal period. Finally CRU averages the grid box anomalies over regions such as Europe or over the entire surface of the globe for each month to get the European or global monthly average anomaly. You see the result in the IPCC graph nearby, which shows rising temperatures.
The decision to consider the 1961-1990 period as ‘normal’ was CRUs. Had CRU chosen a different period under consideration, the IPCC graph would have shown less warming, as discussed in one of the Climategate emails, from David Parker of the UK meteorological office. In it, Parker advised Jones not to select a different period, saying “anomalies will seem less positive than before if we change to newer normals, so the impression of global warming will be muted.” That’s hardly a compelling scientific justification!
It is well known to statisticians that in any but the simplest data sets, there are many possible ways to calculate an indicator using averages. Paradoxically, and counter-intuitively, they often contradict each other. As a simple example of how the same data can be teased to produce divergent results, consider the batting averages of David Justice and Derek Jeter. For each of three years in 1995-97, Justice had a higher batting average than Jeter did. Yet, overall, Jeter had the highest batting average.
In addition to calculating temperature averages for Europe, Courtillot and his colleagues calculated temperature averages for the United States. Once again, their method yielded more refined averages that were not a close match with the coarser CRU temperature averages. The warmest period was in 1930, slightly above the temperatures at the end of the 20th century. This was followed by 30 years of cooling, then another 30 years of warming.
Courtillot’s calculations show the importance of making climate data freely available to all scientists to calculate global average temperature according to the best science. Phil Jones, in response to the email hacking, said that CRU’s global temperature series show the same results as “completely independent groups of scientists.” Yet CRU would not share its data with independent scientists such as Courtillot and McIntyre, and Courtillot’s series are clearly different.
At the upcoming Copenhagen conference, governments are expected to fail to agree to an ambitious plan to cut greenhouse gas emissions. Here’s a more modest, if mundane goal for them: They should agree to share the data from their national meteorological services so that independent scientists can calculate global climatic temperature and identify the roles of carbon dioxide and the sun in changing it.
Phil Green is a statistician, president of Greenbridge Management Inc. and author of the upcoming book misLeading Indicators.
Read more here. See post on New Zealand temperatures here and on record highs and lows for the US here.
By Dr. Roy Spencer
The hundreds of e-mails being made public after someone hacked into Phil Jones’ Climatic Research Unit (CRU) computer system offer a revealing peek inside the IPCC machine. It will take some time before we know whether any illegal activity has been uncovered (e.g. hiding or destruction of data to avoid Freedom of Information Act inquiries).
Some commentators even think this is the beginning of the end for the IPCC. I doubt it.
The scientists at the center of this row are defending themselves. Phil Jones has claimed that some of the more alarming statements in his e-mails have been taken out of context. The semi-official response from RealClimate.org, a website whose roots can be traced to George Soros (which I’m sure is irrelevant), claims the whole episode is much ado about nothing.
At a minimum, some of these e-mails reveal an undercurrent of elitism that many of us have always claimed existed in the IPCC. These scientists look upon us skeptics with scorn. It is well known that the IPCC machine is made up of bureaucrats and scientists who think they know how the world should be run. The language contained in a draft of the latest climate treaty (meant to replace the Kyoto treaty) involves global governance and the most authoritarian means by which people’s energy use will be restricted and monitored by the government.
Even if this language does not survive in the treaty’s final form, it illustrates the kind of people we are dealing with. The IPCC folks jet around the world to all kinds of exotic locations for their UN-organized meetings where they eat the finest food. Their gigantic carbon footprints stomp around the planet as they deride poor Brazilian farmers who convert jungle into farmland simply to survive.
Even mainstream journalists, who are usually on board with the latest environmental craze, have commented on this blatant display of hypocrisy. It seems like those participating - possibly the best example being Al Gore - are not even aware of how it looks to the rest of us.
The elitist attitudes exist elsewhere, too. While the skeptics’ blogs allow those who disagree to post opinions as long as they remain civil about it, RealClimate.org routinely ignores or deletes posts that might cast doubt on their tidy worldview. The same thing happens at Wikipedia, where a gatekeeper deletes newly posted content that departs from the IPCC party line.
A few of the CRU e-mails suggest that manipulation of climate data in order to reduce the signature of natural climate variations, and to exaggerate the supposed evidence for manmade climate change, is OK with these folks. Apparently, the ends justify the means.
The defense posted at RealClimate.org actually reinforces my point. Do the IPCC scientists assume that this is how all climate scientists behave? If it really was how the rest of us behave, why would our eyebrows be raised up to our hairlines as we read the e-mails?
If all of this sounds incompatible with the process of scientific investigation, it shouldn’t. One of the biggest misconceptions the public has about science is that research is a straightforward process of making measurements, and then seeing whether the data support hypothesis A or B. The truth is that the interpretation of data is seldom that simple.
There are all kinds of subjective decisions that must be made along the way, and the scientist must remain vigilant that he or she is not making those decisions based upon preconceived notions. Data are almost always dirty, with errors of various kinds. Which data will be ignored? Which data will be emphasized? How will the data be processed to tease out the signal we think we see?
Hopefully, the scientist is more interested in discovering how nature really works, rather than twisting the data to support some other agenda. It took me years to develop the discipline to question every research result I got. It is really easy to be wrong in this business, and very difficult to be right.
Skepticism really is at the core of scientific progress. I’m willing to admit that I could be wrong about all my views on manmade global warming. Can the IPCC scientists admit the same thing?
Year after year, the evidence keeps mounting that most climate research now being funded is for the purpose of supporting the IPCC’s politics, not to find out how nature works. The ‘data spin’ is increasingly difficult to ignore or to explain away as just sloppy science. If it walks like a duck, and quacks like a duck…
See Roy’s Post here. See Roger Pielke Sr.’s post here.
See Bob Webster’s “Tip of the Climategate Iceberg” post here.
See how the roots of the carbon trading efforts Kerry-Boxer or Cap-and-Trade lead to the top of the adminstration and their Wall Street advisors and green movement/world governance leaders. here and here
By Christopher Monckton on Pajamas Media
This is what they did - these climate “scientists” on whose unsupported word the world’s classe politique proposes to set up an unelected global government this December in Copenhagen, with vast and unprecedented powers to control all formerly free markets, to tax wealthy nations and all of their financial transactions, to regulate the economic and environmental affairs of all nations, and to confiscate and extinguish all patent and intellectual property rights.
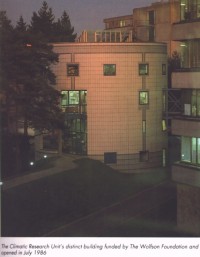
The tiny, close-knit clique of climate scientists who invented and now drive the “global warming” fraud - for fraud is what we now know it to be - tampered with temperature data so assiduously that, on the recent admission of one of them, land temperatures since 1980 have risen twice as fast as ocean temperatures. One of the thousands of emails recently circulated by a whistleblower at the University of East Anglia, where one of the world’s four global-temperature datasets is compiled, reveals that data were altered so as to prevent a recent decline in temperature from showing in the record. In fact, there has been no statistically significant “global warming” for 15 years - and there has been rapid and significant cooling for nine years.
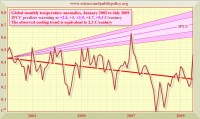
Worse, these arrogant fraudsters - for fraudsters are what we now know them to be - have refused, for years and years and years, to reveal their data and their computer program listings. Now we know why: As a revealing 15,000-line document from the computer division at the Climate Research Unit shows, the programs and data are a hopeless, tangled mess. In effect, the global temperature trends have simply been made up. Unfortunately, the British researchers have been acting closely in league with their U.S. counterparts who compile the other terrestrial temperature dataset - the GISS/NCDC dataset. That dataset too contains numerous biases intended artificially to inflate the natural warming of the 20th century.
Finally, these huckstering snake-oil salesmen and “global warming” profiteers - for that is what they are - have written to each other encouraging the destruction of data that had been lawfully requested under the Freedom of Information Act in the UK by scientists who wanted to check whether their global temperature record had been properly compiled. And that procurement of data destruction, as they are about to find out to their cost, is a criminal offense. They are not merely bad scientists - they are crooks. And crooks who have perpetrated their crimes at the expense of British and U.S. taxpayers.
I am angry, and so should you be.
What have the mainstream news media said about the Climategate affair? Remarkably little. The few who have brought themselves to comment, through gritted teeth, have said that all of this is a storm in a teacup, and that their friends in the University of East Anglia and elsewhere in the climatological community are good people, really.
No, they’re not. They’re criminals. With Professor Fred Singer, who founded the U.S. Satellite Weather Service, I have reported them to the UK’s Information Commissioner, with a request that he investigate their offenses and, if thought fit, prosecute. But I won’t be holding my breath: In the police state that Britain has now sadly become, with supine news media largely owned and controlled by the government, the establishment tends to look after its own.
At our expense, and at the expense of the truth.
Read more here.