


By Joseph D’Aleo, CCM
Next week is Green Week on NBC, the GE network. GE has created a cleantech empire, having bought its way into wind, solar, and water in a big way with a belief that global warming offered a huge opportunity”. Don’t expect objective reporting from NBC or the GE owned Weather Channel on either climate change or energy. Their CEO Jeff Immelt is a member of the Obama administration as an advisor, a fact which will ensure the erroneous claim that carbon dioxide is a dangerous pollutant despite all the evidence emerging to the contrary. It will likely be worse than the ethanol debacle under Bush.
Though there is a place for renewables like solar and wind and geothermal, except for a few special places globally (like Iceland and maybe Yellowstone for geothermal, and the desert southwest for solar and wind), they are no more than supplemental sources.
I have for decades been a strong believer in conserving energy. I am all for innovation and cleaner burning fuels. I am old enough to recall the soot from burning coal in the big cities and the morning mixing down of sooty pollution from incinerators when the first mixing of the new day took place. We often had to brush the soot and particulates off windshields. I remember when cars gave off choking levels of hydrocarbons, nitrous oxides and carbon monoxide as well as particulates and we yearned for the day the internal combustion engine would burn clean and only gave off harmless water vapor and carbon dioxide. We got there. Then suddenly carbon dioxide was demonized thanks in part thanks to the efforts of ENRON looking for the next big opportunity after in the early 1990s Enron had helped establish the market for, and became the major trader in, EPA’s $20 billion-per-year sulphur dioxide cap-and-trade program, a story for another day.
The quest to reduce carbon dioxide emissions and greater efficiency led us to the ethanol debacle. California is now stopping the use of ethanol in their gasoline and that will gradually spread. It turns out, in addition to driving up the prices of food, it actually nets out less efficient than plain gasoline when considering the entire end to end processing and total emissions are up not down.
I support solar and understand the technology has improved to provide more energy from the sun even on partly cloudy days but it is expensive and though it makes a lot of sense in the desert, can be nothing more than a part-time supplemental energy source in the north where there is little sunshine in fall and winter and of course, the sun doesn’t shine at night.
Today we are going to compile recent findings about another of the renewables - wind power, potentially another very expensive boondoggle, despite the T. Boone Pickens and GE hype.

Read more on the experiences of Spain, Denmark, Great Britain the Czech Republic and some early issues here in the U.S. in this PDF.
By Joseph D’Aleo, CCM
UPDATE 4/17/09
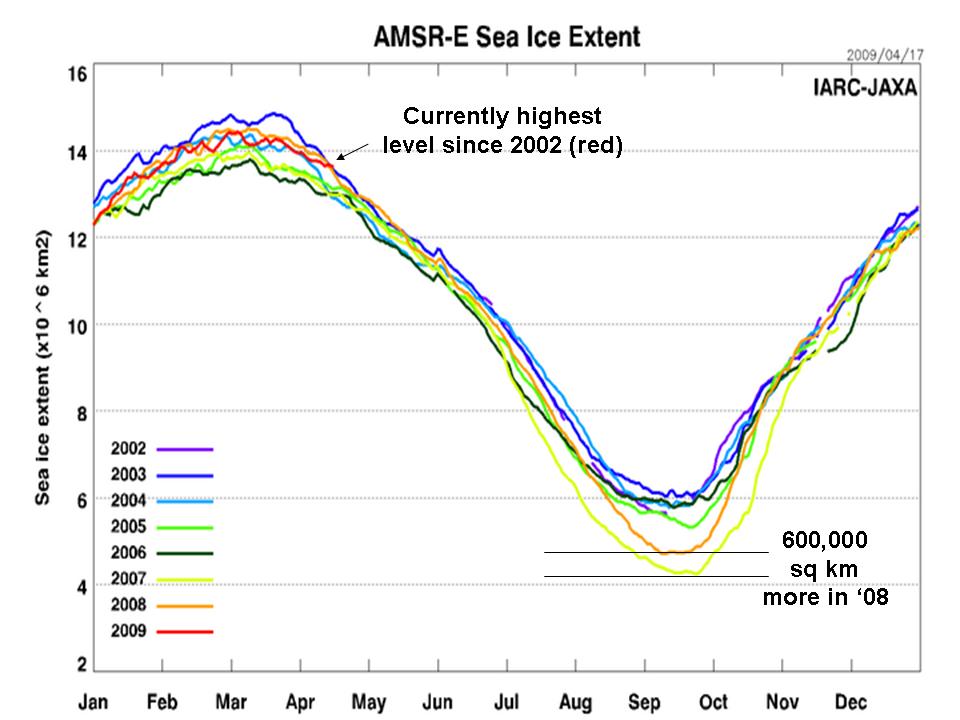
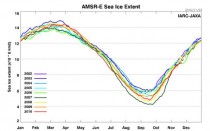
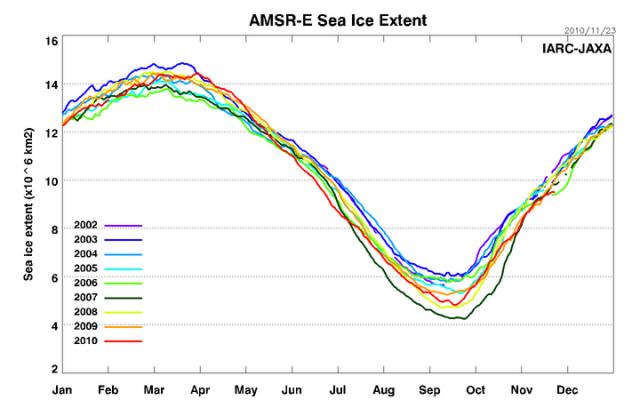
The IARC-JAXA AMSR-E ice extent daily data for the 16th of April is now the highest in the record going back to 2003, just beating out 2003.
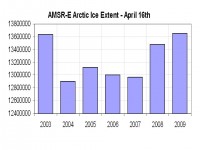
See larger image here.
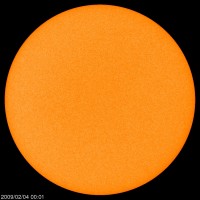
The sun remains in a deep slumber.
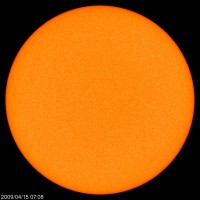
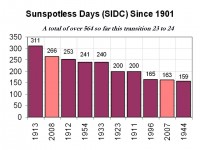
Today we are 15 days into April without a sunspot and with 603 sunspotless day this cycle minimum, 92 already this year. 2009 at this rate, is likely to enter the top 10 years the last century along with 2007 (9th) and 2008 (2nd) this summer.
See larger image here.
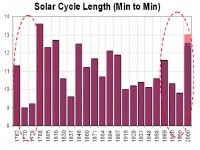
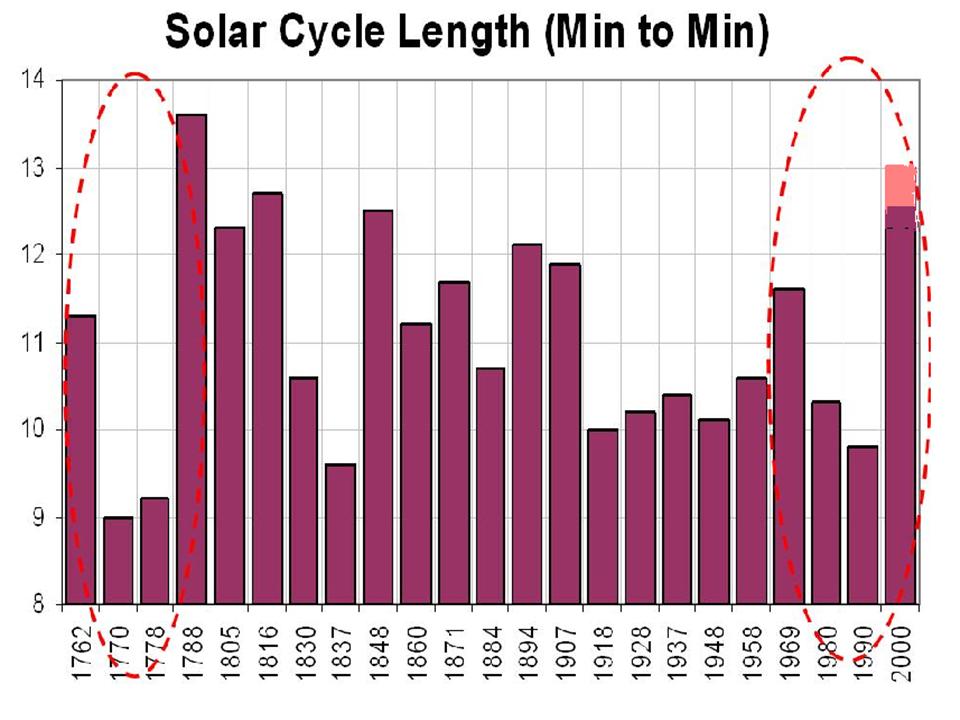
If it stays quiet the rest of this month, the minimum can be no earlier than November 2008, at least a 12.5 year cycle length. I believe January 2009 is a better shot to be the solar minimum as sunspot number would have to be below 0.5 in June 2008 to prevent the running mean (13 month) from blipping up then. April needs only to stay below 3.2 and May 3.4 to get us to January. This would be very like cycles 1 to 4 in the late 1700s and early 1800s, preceding the Dalton Minimum. That was a cold era, the age of Dickens and the children playing in the snow in London, much like this past winter.
See larger image here.
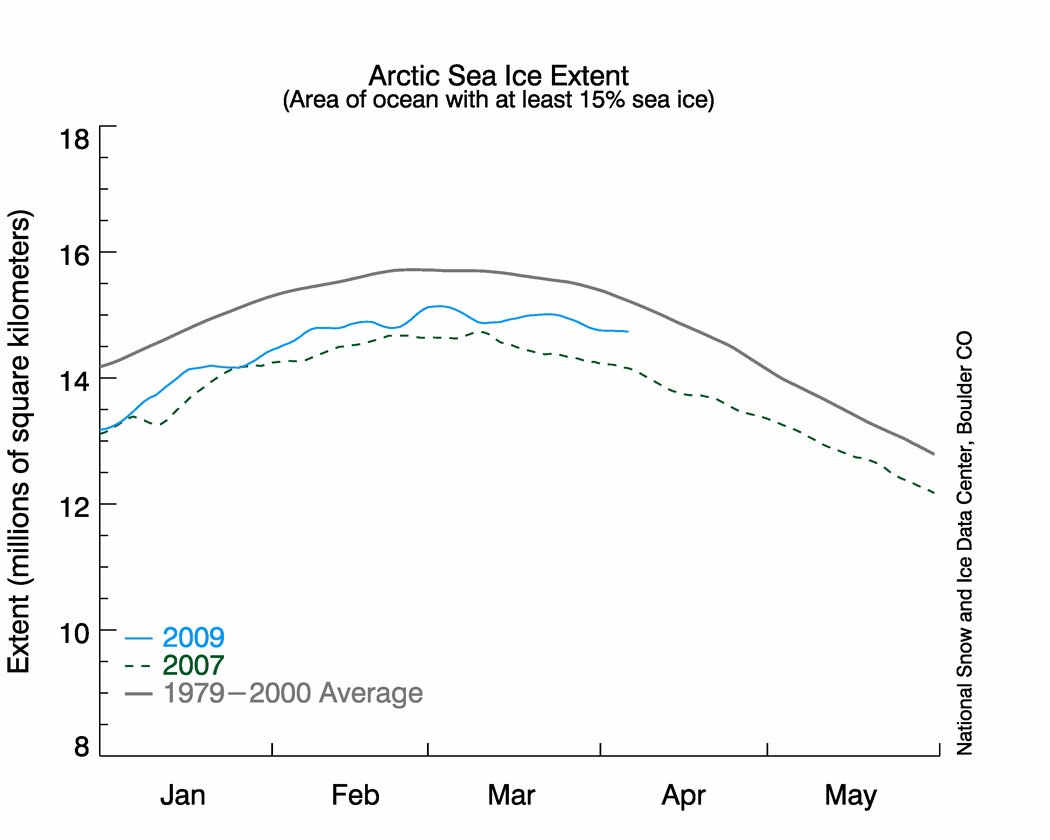
THE ARCTIC AND ANTARCTIC ICE STORY
As for the ice, we hear in the media the hype about the arctic and Antarctic ice. The arctic ice we are told is more first and second year ice and very vulnerable to a summer melt.

See larger image here.
Actually the arctic ice is the highest level since 2002 according to IARC-JAXA. The anomaly is a relatively small 250,000 square km according to NSIDC.
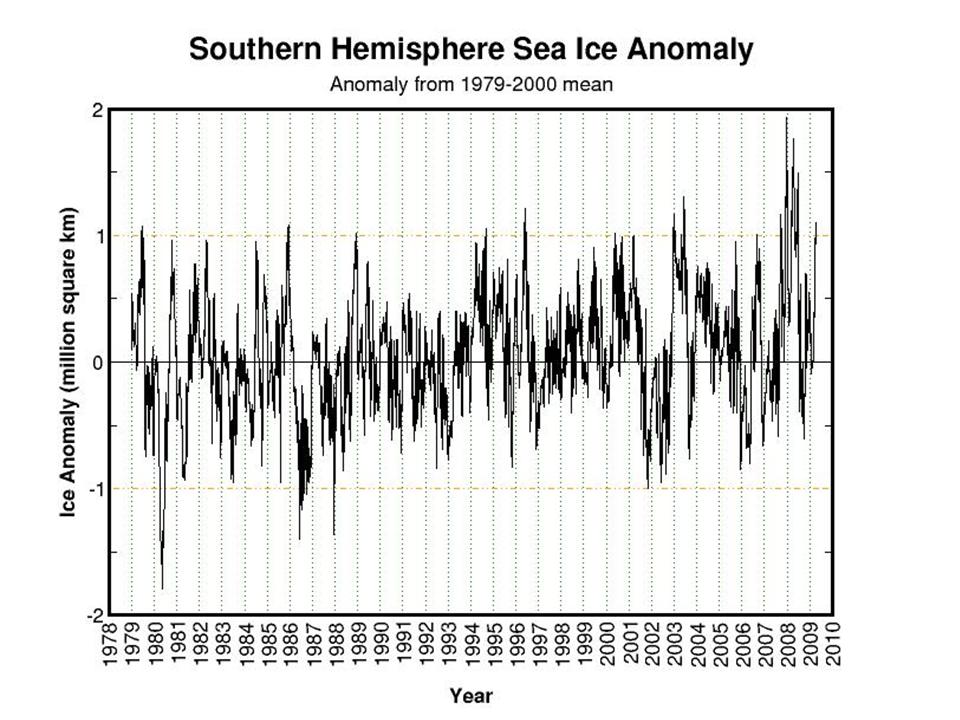
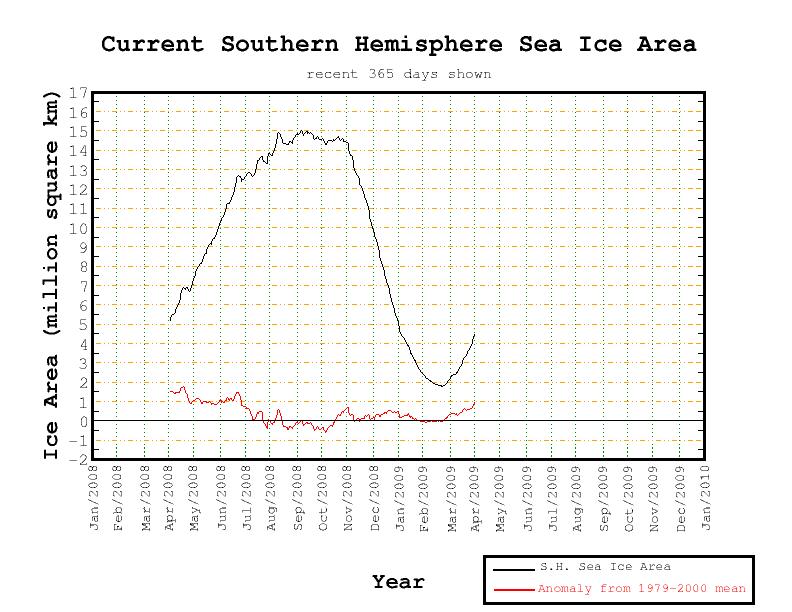
There was much attention paid in the media to the crack in the Wilkins Ice sheet bridge. It was not even reflected as a blip on the Southern Hemisphere ice extent, which has grown rapidly as the southern hemisphere winter set in to 1,250,000 square kms (as of 4/18) above the normal for this date and rising rapidly.
See larger image here.
The net GLOBAL sea ice anomaly is also positive, 850,000 square km above the normal. See full PDF here. See in this Watts Up With That post how the media and NSIDC recyclced stories and photos from 2008 in their 2009 Wilkins stories.
Last Page: Where Is Science Behind Climate Change Claims?
By Dave Epstein
As an environmental advocate I have placed land under conservation and restored habitats. I recycle, reuse rainwater, walk when others drive, and generally leave a small environmental footprint. Yet I am angered by climatologists, environmentalists, and politicians who purvey one of the biggest myths of modern time: that climate change (aka global warming) during the past half century is primarily due to anthropogenic (manmade) causes.
I know this statement will likely have readers scurrying to fire off rebuttals. Many may point to the Intergovernmental Panel on Climate Change (IPCC) report that says a 90-percent chance exists that the observed temperature increases of the last 50 years are the result of greenhouse gas emissions. The report goes further to say that human activities have begun affecting specific aspects of the climate, such as heat waves, wind patterns, and continental temperatures.
The IPCC doesn’t conduct its own research or monitor data. Its function is to collect original research produced around the world and synthesize the results. The 90 percent, often quoted by the media, was chosen to draw attention to the panel’s findings and is rooted in no hard data. It is used as the basis for a prediction of global catastrophe, but we should remember that science is hardly infallible.
Recall for yourself all of the scientific predictions from reputable individuals and organizations that have failed to come to fruition. Here are a few: The Y2K catastrophe on Dec. 31, 1999, the planet running out of oil, Legionnaires’ disease, the bird flu epidemic, solar flares knocking out the power grid, the global cooling of the 1970s, and even Einstein predicting that nuclear energy was “unattainable.” However, now our computer models are trusted to be the definitive predictor of the behavior of the planet’s climate well into the future?
Here’s what a Ph.D. friend said to me regarding his view about whether man is the major cause of climate change: “Maybe it’s like religion to me. It’s just a feeling, faith, and belief in something I can’t prove but intrinsically I know is right.” Therein lies the problem. The argument about the cause of climate change is not like faith or religion, right or wrong; it’s a scientific hypothesis. Climate models are produced by computers that are fed a series of equations and assumptions and then spit out a prediction of rapid global warming. To date these models have failed to identify the current planetary cooling. In 2006 NASA scientists said the cooling was just a “speed bump” on the road to global warming.
Many factors contribute to the climate. As I write this (during a Jan Plan at Colby, when temperatures plummeted to minus 25 F) we are in the second-quietest period of sunspots since 1900. The Pacific Ocean remains in a cool phase of a multi-decadal oscillation and actually may contribute to a cooling the planet over the next decade. Long-term climate data indicate that world climate varies naturally, and those cycles are the collective result of scores of interrelated variables, playing out either in consort or not. Volcanic activity, sunspots, ocean currents, global winds, and more interact to cool and warm Earth. Man plays a role, but it is dwarfed by the natural variability of the planet.
The media support the idea of man-made warming through the omission of important facts. They fail to tell the public that glaciers grew in Alaska in 2008 - the first time in 250 years - or that overall ice coverage in Antarctica has reached an all-time record level. We cannot assume that the data used to report the worldwide temperature warming are accurate. NOAA’s reported October 2008 warm record was thrown out after some of September’s data had “accidently” been used in the calculation. Over the past 20 years, hundreds of colder, former Soviet Union stations have been dropped from the temperature database, leaving a warmer bias in the data. In an ongoing project, Anthony Watts, a former television meteorologist and expert on weather measurement, discovered hundreds of the U.S. observational stations are not compliant with NOAA regulations.
Examination of past data shows there have been far more alarming temperature trends than we have witnessed recently. As the last glacial period was ending, about 12,000 years ago, and temperatures rose, an abrupt return to glacial cold occurred. This lasted for about 1,000 years and is known as the Younger Dryas. Evidence of the end of this cold period found in ice cores shows where temperatures in Greenland rose 15 F (8 C) in less than a decade. No Hummer caused that meteoric rise in temperature. What exactly is this ideal climate we are trying to achieve? What level of cooling is acceptable? Are we trying to return to the 16th and 17th centuries and the Little Ice Age, where massive crop failure and severe cold were the norm? If we now were in another Little Ice Age, would these scientists urge burning of fossil fuels?
The entire premise of man controlling the weather or climate will, if left unchallenged, yield rules and regulations as crazy as the very premise on which they will be based. Conserve, preserve, and find alternative forms of energy. But let’s do it because it’s the right thing to do, not because of the fear associated with some unproven hypothesis. See the post here.
Dave Epstein ‘86 is a television meteorologist in Boston, teaches at Framingham State College, has taught Jan Plans at Colby, and is host of a gardening Web site, GrowingWisdom.com
By Nick Meo, UK Telegraph
Zoo keepers saved the life of a German woman who jumped into a polar bear enclosure at Berlin Zoo by pushing away of one of the animals when it attacked her.
The keepers’ bravery was praised after they dragged the 32-year-old out of a moat for the animals. They had to shove the animal out of the way after one of four polar bears dived into the water and attacked her, inflicting serious bites to her legs and arms.
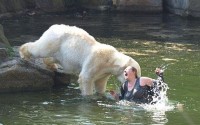
Knut, the zoo’s baby bear that became an international celebrity in 2007 after it was hand-reared by a keeper, was in the enclosure at the time. Germany went polar bear crazy after the birth of the cute animal.
Police did not say why the woman jumped into the enclosure. She had to climb over a fence, a line of prickly hedges and a wall to get in. She suffered serious injuries after being bitten on her arms and legs.
Last December a man who afterwards said he was “lonely” survived jumping into the same zoo enclosure when keepers diverted the bears with chunks of beef.
“The woman has proved herself to be careless by jumping into the enclosure,” a police spokesman said afterwards. “Logic tells us that polar bears will do this type of thing in this situation.” Read more here.
You knew this would happen someday as the environmentalists and the media have portrayed the polar bears as cute, cuddly animals, when instead they are ferocious grizzly bears who have adapted to their environment by growing white fur. Also likely to happen at some point is a fatality or fatalities of people venturing to the North Pole not prepared for the extremes of the climate. The Catlin Expedition is one such group in jeopardy. See story under What’s New and Cool.
As Anthony Watts reported here, NASA GISS now points to aerosols as the cause of recent anomalous arctic warming.
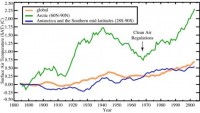
Since the 1890s, surface temperatures on Earth have risen faster in the Arctic than in other regions of the world. Usually, discussions on global warming tend to focus on greenhouse gases as the culprit for the trend. But new NASA research suggests about half the atmospheric warming measured in the Arctic is due to airborne particles called aerosols.
Aerosols are emitted by both natural and human sources. They can influence climate by reflecting or absorbing sunlight. The particles also affect climate by changing cloud properties, such as reflectivity. There is one type of aerosol that, according to the study, [reduces] rather than increases in its emissions seem to have promoted warming.
The research team, led by climate scientist Drew Shindell of the NASA Goddard Institute for Space Studies used a computer model to investigate how sensitive different regional climates are to changes in levels of carbon dioxide, ozone, and aerosols.
They found that Earth’s middle and high latitudes are particularly responsive to changes in aerosol levels. The model suggests aerosols likely account for 45 % or more of the warming measured in the Arctic since 1976.
Though there are several types of aerosols, previous research indicates two in particular, sulfates and black carbon, play leading roles in climate. Both are products of human activity. Sulfates, which come mainly from the burning of coal and oil, scatter sunlight and cool the air. Over the past three decades, the United States and European countries have passed clean-air laws that have halved sulfate emissions.
See larger image here.
Since the 1890s, surface temperatures have risen faster in the Arctic than in other regions of the world. In part, these rapid changes could be due to changes in aerosol levels. Clean air regulations passed in the 1970s, for example, have likely accelerated warming by diminishing the cooling effect of sulfates. Credit: Drew Shindell, Goddard Institute for Space Studies.
The models showed that regions of Earth that showed the strongest responses to aerosols in the model are the same regions that have witnessed the greatest actual temperature increases since 1976, specifically the Arctic. However in the Antarctic, aerosols play less of a role. Read more here.
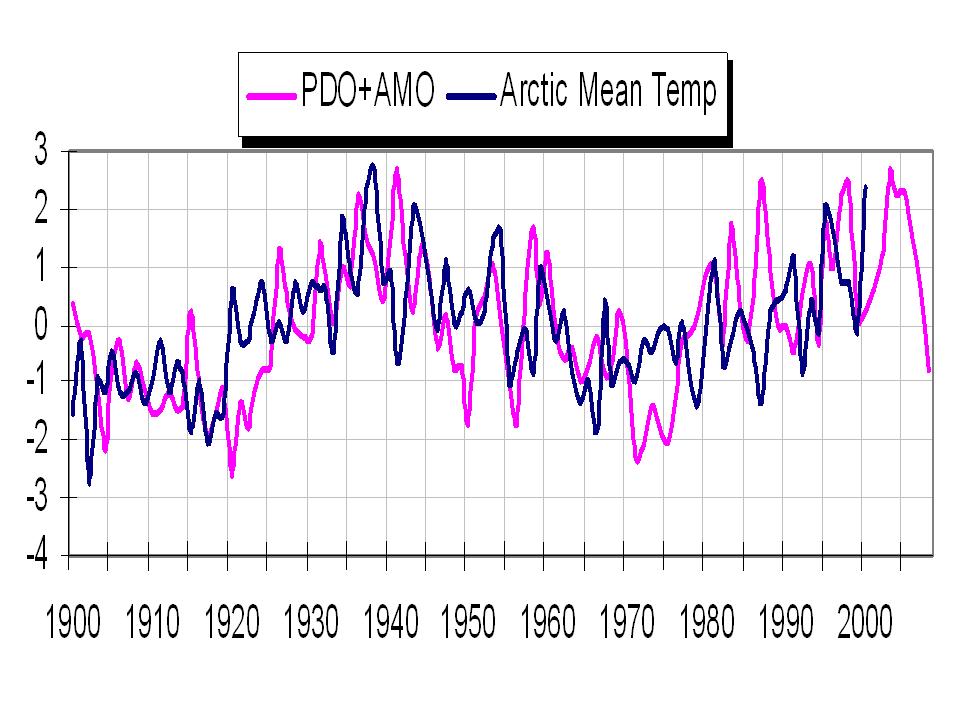
Icecap Notes: This is a another attempt to blame man and our evil ways for the natural changes we see in the arctic. If not CO2, then carbon soot or aerosols. Willie Soon in 2004 showed how well arctic basin temperatures (Polyakov) correlated with total solar irradiance (Hoyt/Schatten) and how poorly it correlated with CO2.
See larger image here
I have found the Atlantic and Pacific temperature cycles (PDO and AMO) also matched very well with the arctic temperatures as shown below. Water intrudes into the arctic beneath the ice through the Bering Straits or the North Atlantic near the Barents Sea. When the water is unusually warm, there is more melting, cold less.

See larger image here
Both Willie and I used the Polyakov data set for the arctic basin available to 2000. Craig Loehle has shown how the RSS satellite analysis of the arctic shows a cooling since 2005, consistent with the global trend.
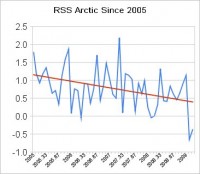
See larger image here
How does their model explain this? You must understand there is an effort to discount any natural factors from influencing climate or the crack in the dyke that would create could open up the theory to increasing questions, more holes in the dyke than they have fingers or model answers to fill. With every new model explanation, they sound less convincing, more desperate.
By Mish Michaels, WBZ Boston
“The Sun is the all encompassing energy giver to life on planet Earth,” said Dr. Willie Soon, an Astrophysicist at the Harvard-Smithsonian Center for Astrophysics.

And these days the sun is getting a lot of attention from scientists.
“The Sun is just slightly dimmer and has been for about the last 18 months,” said Dr. Soon. “And that is because there are very few sunspots.”
Sunspots are giant islands of magnetism on the Sun and the appearance of sunspots runs in 11 year cycles. When sunspots are abundant during the cycle, it is called the “solar maximum” and when there are few sunspots, it is considered to be the “solar minimum.”
Track changes in sunspots
“Right now we are in the deepest solar minimum of the entire Space Age,” stated Dr. Soon. “In fact, this is the quietest (fewest sunspots) Sun we have had in almost a century.”
And those lack of sunspots have a link to our climate.
“When you have a lot of sunspots, there is a lot more light energy coming from the Sun and that tends to warm the Earth,” added Dr. Soon."When the Sun produces less sunspots, it essentially gives up less energy to the Earth’s climate system.”
And less energy means a cooler planet.
“There were very few sunspots in 2008 and by all measures, 2008 was a cold year,” said Dr. Soon. And that link between temperatures on Earth and sunspot activity can be picked out many times from past history.
“For example, from 1645 to 1715 there were no sunspots and it was a very, very cold period for our planet. Most call it the “Little Ice Age,” said Dr. Soon. “Based on my research, I tend to be in support of a very, very strong role by the Sun’s energy input as a climate driver. If you were to ask me about the role of CO2, I would say its very, very small,” he added.
In fact, Dr. Soon sees this historic solar minimum as an opportunity to reframe our understanding of Earth’s climate system.
“If this deep solar minimum continues and our planet cools while CO2 levels continue to rise, thinking needs to change. This will be a very telling time and it’s very, very useful in terms of science and society in my opinion,” concluded Dr. Soon.
Get a video about the Sun’s connection to Earth’s Climate: The general public can purchase the original Unstoppable Solar Cycles DVD here And teachers only can receive/purchase the school version here. See story here.
See video interviews of Dr. Soon on Why the Sun is Dimmer These Days and the possible effects here.
See this excellent follow-up story and comments here .
Guest post by Steven Goddard on Watts Up With That
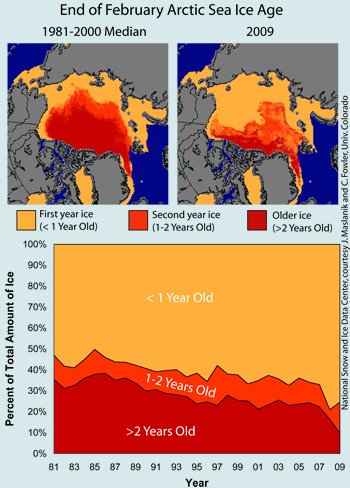
In past years, NSIDC has referred to “declining multi-year ice” as the problem which the Arctic faces. Mark Serreze at NSIDC forecast a possible “Ice Free North Pole” in 2008, based on the fact that it had only first year ice. This year, multi-year ice has increased and NSIDC is now referring to declining “2+ year old” ice as the problem. Note the missing age group (2 year old ice) in the paragraph below from their latest press release.
First-year ice in particular is thinner and more prone to melting away than thicker, older, multi-year ice. This year, ice older than two years accounted for less than 10% of the ice cover at the end of February. From 1981 through 2000, such older ice made up an average of 30% of the total sea ice cover at this time of the year.
Due to the record minimum in 2007, it goes without saying that there isn’t a lot of three year old ice in 2009. Maybe next year they can raise the bar to 3+ year old ice, as the multi-year ice ages one more year?
The press has picked up on the 10% figure, based on the new higher standard NSIDC has set. “Ice older than two years once accounted for some 30 to 40 percent of the Arctic’s wintertime cover and made up 25 percent as recently as 2007. But last year it represented only 14 percent of the maximum. This year the figure fell to 10 percent.”

Multi-year ice has increased from 2008, up to nearly 25%. See larger image here.
Note too that ice extent is nearly back to normal and has not declined significantly from the winter maximum. See larger image here.
Read post and comments here.
Icecap Note: Also NBC(GE)and AP’s Seth Borenstein have hyped this nonsense as expected and also played up the crack in the Wilkins. It was a frustrating melt seasons for all the expeditions near Antarctica where they were convinced the Wilkins would go. A press release was expected to play up a non-story. Keep the focus off the fact all the alarmists predictions are failing. They are now resorting to mis characterization and outright lies to try and keep their failing theory alive long enough to get legislation through congress. There is HUGE money behind this hype. The Southern Hemisphere ice is 1 million square kilometers greater than the 30 year average AND RAPIDLY INCREASING, but the press releases would lead you to believe its vanishing. There is no integrity anymore in science or journalism and certainly in politics.
See larger image here.
By Joseph D’Aleo, CCM
In 2002, I was in addition to doing R&D correlations on climate teleconnections for our statistical models at WSI, I was Dr. Dewpoint on Intellicast, in essence an early weblog. This article from the library in 2002 on Why Tracking Climate Change is Like Tracking the Stock Market was prophetic as it predicted the downturn in temperatures we have seen since 2002.
Written March 12, 2002
Those of you who invest in stocks or funds have felt the joy and pains of the market’s ups and downs in recent years. Stock experts point to a number of different factors to explain why the market has moved in a particular direction. They also use these factors and forecasts of these factors to predict where the market will be going and to recommend whether to buy or sell. Not all economists agree on what factors are at play and they often vary greatly in their opinion about what will happen.
THE STOCK MARKET
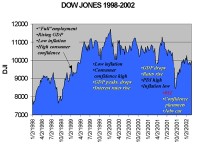
I thought it might be instructive to look at the recent changes in the Dow Jones Index in the last 5 years in relation to the factors. I am not an economist and don’t claim to be a financial expert (though my dad was a financial newspaper and magazine editor of some note).
First note the rapid rise from below 8000 in October 1998 to over 11,000 just 6 months later in the spring and summer of 1999. During that time, many factors were lined up positive including a strong technology driven economy with rising GDP, very low unemployment, low inflation and a very high consumer confidence level.
During the year 2000, the market peaked and then treaded water as some of the factors turned negative. Even as some factors pointed to a down market, others like high personal disposable income and low inflation and relatively high consumer confidence levels kept it from a big correction. Then came 911, a greatly destabilizing event and a real shock to the economic system. Markets plunged, as did the consumer confidence. Unemployment increased as companies attempted to cut costs and improve profitability. The Fed reacted by forcing interest levels down to historically low levels. This together with other stimuli started a rebound and today we are back within 10% or so of the peak (larger image here).
This is not unlike climate change, which goes through ups and downs as the climate factors go through their cycles. Climatologists use the factors to explain the ups and downs and predict where the climate is going. Again not all climatologists agree about what factors are behind the changes and what the future holds for our climate.
There are also some underlying trends. Stocks have risen over the long term, in part because of inflation. If you factor in inflation, the rise is smaller and you more clearly see the cycles of bull and bear markets. In the climate too there are trends. Global temperatures have been rising over the last century. When you factor in factors such as the urban heat island, you find a much smaller rise and the cycles become more obvious.
When we look at the long-term temperature trends for the United States (courtesy of the NCDC), we find many ups and downs on a short term, and we see evidence of long-term trends and cycles.
A close-up examination would show many of the short terms swings are due to El Nino and La Nina cycles (here). Occasionally short-lived shocks to the system like major volcanic eruptions (e.g. Pinatubo 1991) take place with widespread cooling that lasts a few years.
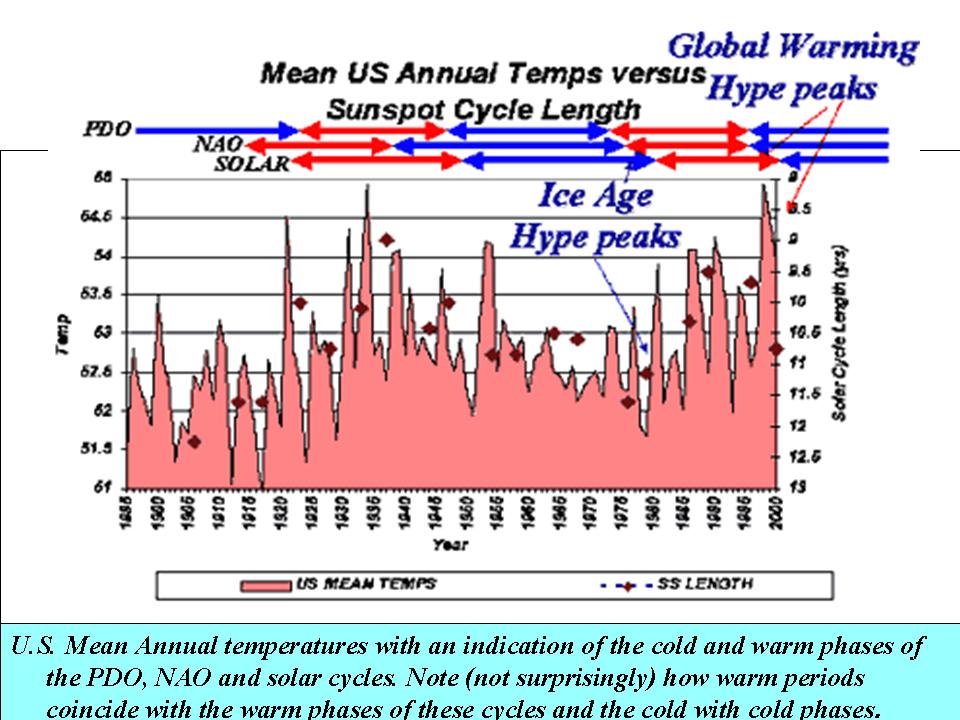
In addition there are factors that control the long-term tendencies and trends. In the chart below you can see one apparent relationship between the length (and strength) of the solar cycle (diamonds) and annual mean temperatures. During periods of strong, short cycles, we see warmer temperatures and during periods with longer, weaker cycles, we find a cooling.
Note that much like the factors in the stock market, when the various factors were all in the warm phase (as they were from around 1920 to near 1950 and again from the very late 1970s to the late 1990s) temperatures tended to be higher. When the factors were all aligned in their cold phase (as they were from the 1950s through the middle 1970s), temperatures fell.
At the end of the cold phase in the late 1970s, three incredibly cold winters caused many to believe that an “Ice Age” was returning. This is like the flurry of experts we see on television during a market free-fall that tell us that “no end is in sight” and that the market had a long way to go “down”. Many experienced investors see this as a buying opportunity. Similarly during the boom times in the stock market, many experts are heard to promise “no end in sight to the bull market”. Many investors will be selling as they see the factors begin to weaken.
Now we appear to be at the end of the warm cycle. Already, the PDO and NAO cycles seem to have shifted to the start of their cold phases. There is also some evidence in this current cycle which has been longer and at least in terms of the sunspot numbers, weaker than the prior two cycles, suggesting it too is shifting into a colder mode. Now we are hearing “gloom and doom” reports of runaway global warming.
We have also discussed in recent stories how the oceans play a role through decadal scale shifts in circulations and positions of warm and cool pools. This affects the frequency of El Nino and La Nina and tropical and winter storms. These tend to cause changes in atmospheric patterns over the globe and through them affect the surface temperature trends. In the following version, we have added the Pacific and Atlantic cycles (both warm and cold phases to the solar cycles).
In the chart below we show U.S. Mean Annual temperatures with an indication of the cold and warm phases of the PDO, NAO and solar cycles. Note (not surprisingly) how warm periods coincide with the warm phases of these cycles and the cold with cold phases.
Given the apparent changes in the three factors, if I owned global warming stock, I would sell now. See full story here. Note this cycle (23 min to min) will be at least 12.5 years and the PDO is strongly negative.
By Sherwood and Craig Idso
In an editorial in the 13 March 2009 issue of Science, Christopher Reddy (Director of the Coastal Ocean Institute of the Woods Hole Oceanographic Institution) writes that “one often-overlooked responsibility of scientists is explaining their work to people,” in order that they might contribute to “sound policymaking.” Now more than ever, he notes that “issues such as climate change ... are migrating from scientific journals to the non-science community,” and he says “it’s critical that scientists venture beyond their laboratories to put these issues into the correct contexts and help the public understand what is known, unknown, and under debate,” which is precisely what we try to do—and have been doing for well over a decade now—in each weekly issue of our CO2 Science website.
Most recently, in this regard, we have also affixed our names to a declaration sponsored by the Cato Institute that was widely published in a number of major U.S. newspapers. It began with the following statement that was made by President-Elect Barack Obama on 19 November 2008: Few challenges facing America and the world are more urgent than combating climate change. The science is beyond dispute and the facts are clear.
The signatories to this declaration all agreed, as we next said, that “with all due respect Mr. President, that is not true,” and we went on to state that “the case for alarm regarding climate change is grossly overstated,” that “surface temperature changes over the past century have been episodic and modest,” and that “there has been no net global warming for over a decade now.”
We also told the president that “after controlling for population growth and property values, there has been no increase in damages from severe weather-related events,” that “computer models forecasting rapid temperature change abjectly fail to explain recent climate behavior,” and that his “characterization of the scientific facts regarding climate change and the degree of certainty informing the scientific debate is simply incorrect.”
Why did we do this? We did it because we believe it is our sacred duty—as “scientist citizens”—to help President Obama (and other elected officials) better understand “what is known, unknown, and under debate” regarding CO2 and climate change. By virtue of joining with many of our fellow scientists in disputing the so-called scientific consensus on this issue, we demonstrated—by that very act—that the science is not beyond dispute, and that there is not a consensus, much less a scientific consensus, regarding the subject.
Proof of this contention is evident on nearly every page of our website, where we have archived all of the contents of each of the weekly issues we have produced over the past eleven-plus years, and where we have also filed these materials under various subject headings, producing succinct summaries of many of them. We urge all who seek to become better informed on the many aspects of the CO2-climate debate to read what we have culled from the scientific literature that stands in stark contrast to what is claimed by the climate-alarmist community, and to afterward judge for themselves what they think is most nearly correct with regard to this most vital topic, upon which legislative action at the highest level of government within the United States is imminent. Read more with references here .
And if you are not yet familiar with this site as a valuable reference with respect to carbon dioxide and climate change take a look around and at their extensive subject index. Each paper is carefully researched. See their extensive library and their special section on Medieval Warm Period with a listing of peer review work published by 687 individual scientists from 402 separate research institutions in 40 different countries and counting.
By Joseph D’Aleo, CCM
UPDATE: NOAA predicts the Red River Will Crest Again in Fargo-Moorhead in Late April here possibly again at records levels.
Just a week after the last major northern plains blizzard another significant snowfall occurred this weekend. Blizzard conditions were reported with up to 16 inches of snow in Nebraska (Cody). Models had difficulty with the location of the heaviest snow bands and storm track.
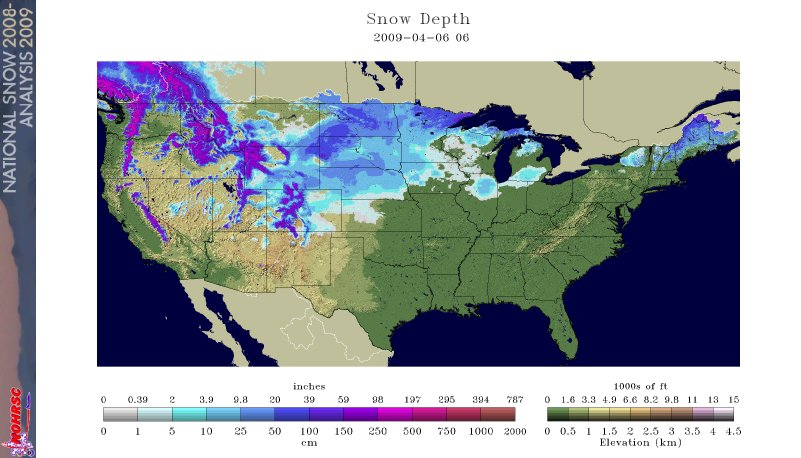
Several inches of snow fell in Nebraska, South Dakota, Iowa, southern Minnesota into southern Wisconsin and Monday into Illinois, Indiana, northern Ohio and Michigan. This included parts of the Red River Basin already in flood and with deep snowcover (click here to enlarge).
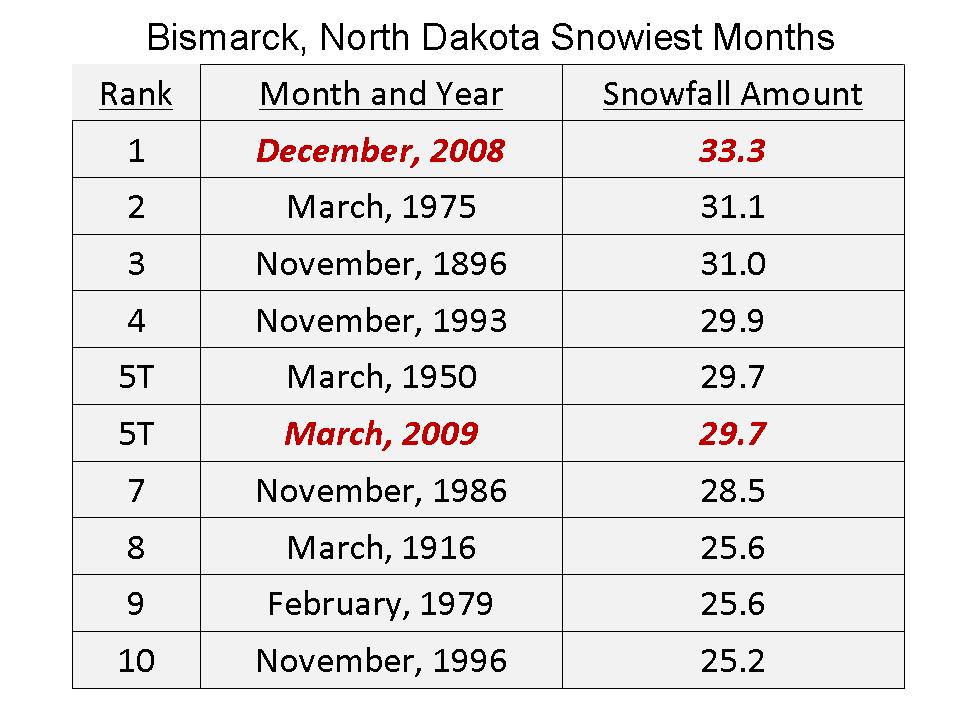
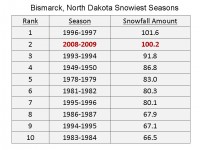
The northern plains has been hit hard this year. Fargo set a record for snowfall and precipitation for March, Bismarck also in North Dakota had record snowfall in December and the second snowiest March, the first year with with two monthly totals in the top ten enlarged here.
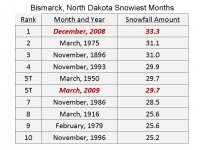
Bismarck is on the northern edge of this storm. If they get more than 1.4 inches of snow from this (or some later) storm, they will set an all-time snow record. See the enlarged listing shown below here as of April 1 after the big blizzard. See all the watches and warnings here.
The National Weather Service said International Falls, with the reputation as the nation’s icebox, recorded 124.2 inches of snow this winter. That tops the old record of 116 inches set in 1995-1996. The nearly 9-inch dump from this week’s snowstorm pushed International Falls over the edge. The Minnesota-Ontario border area has been pummeled with snowstorms this winter.
And from KOMO News Weary Spokane residents who are sick of snow can at least now be consoled by the fact that they were a part of history.
A snow storm on Sunday has made this the snowiest winter on record in Spokane. The National Weather Service said 93.6 inches of snow has been recorded at Spokane International Airport this winter, breaking the record set in 1949-50 by a tenth of an inch. It took snowfall of 3.9 inches of Sunday, a record for the date, to break the all-time record. This is the second-consecutive heavy winter in Spokane. Last year, more than 92 inches of snow fell on the Lilac City, third most since records started in 1893.
Spokane’s Top 5 Snow Years:
RANK WINTER SNOW TOTAL
1 2008-2009 93.6
2 1949-1950 93.5
3 2007-2008 92.6
4 1974-1975 89.0
5 1992-1993 87.3
Spokane is also mired in unseasonable cold. Normal high temperatures at the of March are in the low 50s, but this month has seen highs in the 30s and 40s.
See here how an amazing 358 lowest temperature records and 409 snowfall records were broken for the week ending Apr 2, 2009.
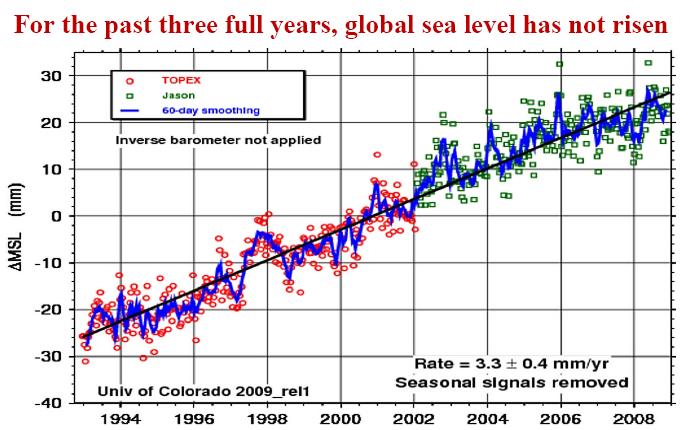
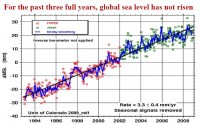
Sea Level Has Not Risen for Three Years - New Monthly SPPI CO2 ReportSPPI’s authoritative Monthly CO2 Report shows that in recent years global mean sea level, as measured by the JASON satellite, has not risen for three years, probably in response to ocean cooling.
Main points
The University of Colorado, at SPPI’s request, has updated the sea-level data from the JASON satellite to the end of 2008. Though James Hansen of NASA says sea level will rise 246 feet, sea level has not risen since the beginning of 2006. Sea level rose just 8 inches in the 20th century and has been rising at just 1 ft/century since 1993.
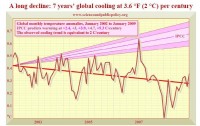
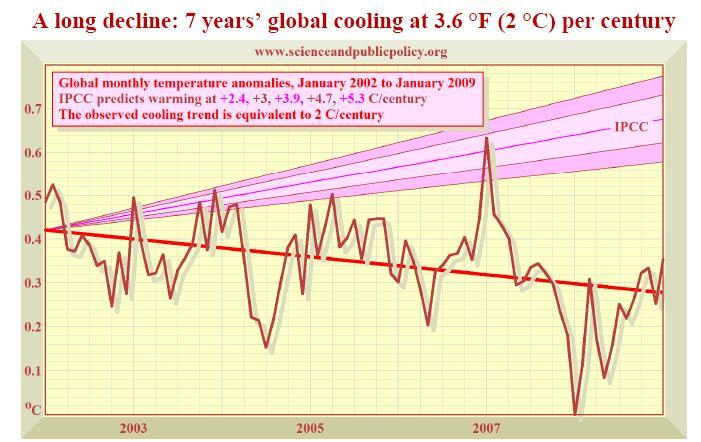
Since Al Gore’s climate movie An Inconvenient Truth was launched in January 2005, global cooling has occurred at the equivalent of 10F (5.5C) per century. If this rapid cooling were to continue, the Earth would be in an Ice Age by 2100.
The UN’s climate panel, the IPCC, had projected temperature increases at 4.5 to 9.5F (2.4 to 5.3C) per century, with a central estimate of 7F (3.9C) per century. None of the IPCC’s computer models had predicted a prolonged cooling.
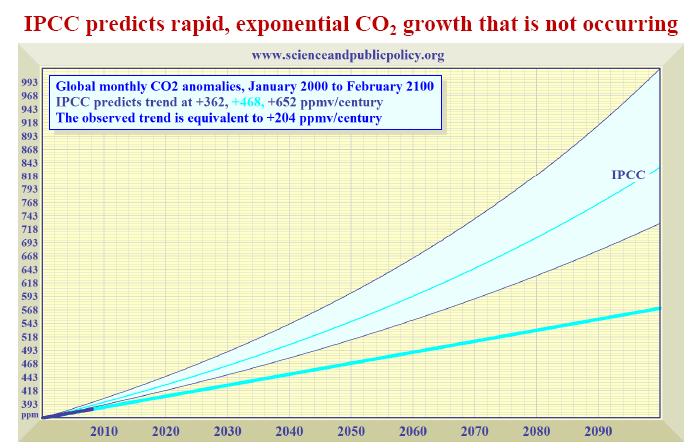
The IPCC’s estimates of growth in atmospheric CO2 concentration are excessive. They assume CO2 concentration will rise exponentially from today’s 385 parts per million to reach 730 to 1020 ppm, central estimate 836 ppm, by 2100. However, for seven years, CO2 concentration has been rising in a straight line towards just 575 ppmv by 2100. This alone halves the IPCC’s temperature projections.
Sea ice extent in the Arctic recovered to the 30-year average during the early winter of 2008. In the Antarctic, sea ice extent reached a record high late in 2007, and has remained plentiful since. Global sea ice extent shows no trend for 30 years.
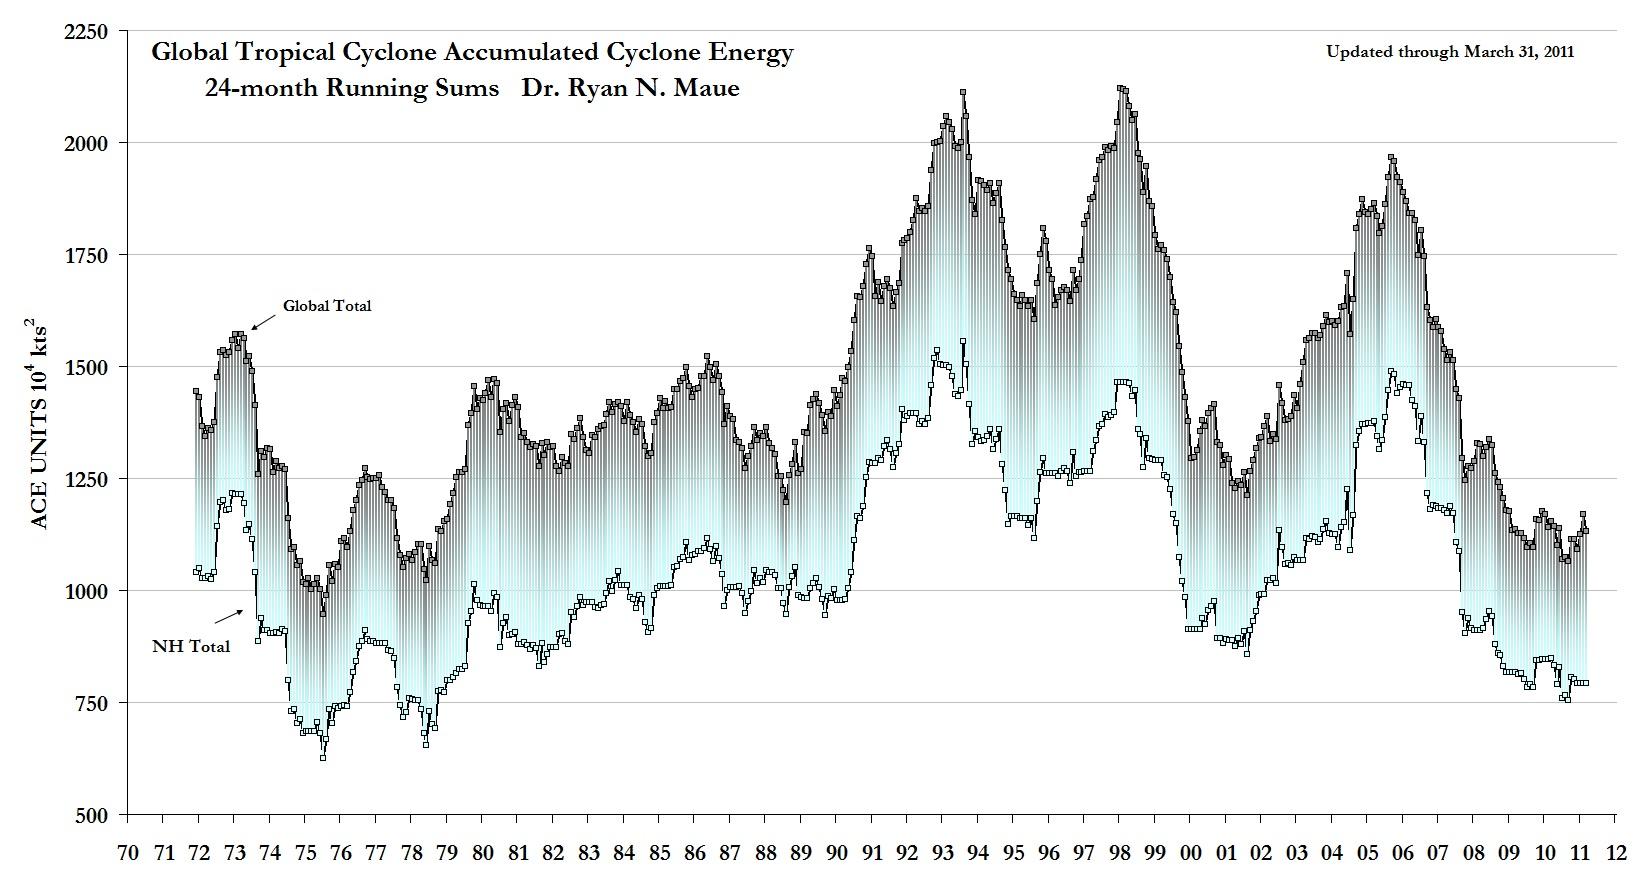
The Accumulated Cyclone Energy Index is a 24-month running sum of monthly energy levels in all hurricanes, typhoons and tropical cyclones. The Accumulated Cyclone Energy Index hit a 30-year low in October 2008.
Read the full SPPI Monthly CO2 Report including a debunking of railroad engineer IPCC chief Pachauri claims here.
By Paul Chesser, Climate Strategies Watch
Remember last month when the president and vice president photo-opped the signing of the $787 billion stimulus bill in Denver? Part of the trip was devoted to President Obama’s promotion of “green” energy initiatives, many of which will benefit from the mass subsidization in the new legislation. One project he toured was a solar panel project on top of the Denver Museum of Nature and Science, which the Denver Post says, “The sun generates enough energy on the museum rooftop to power about 30 homes.” Well, investigative reporter Todd Shepherd of Colorado’s Independence Institute tried to verify that and other claims about the project:
“That claim cannot be verified at this time, and in fact, seems to be belied by the scant information provided by the museum and other sources. Laura Holtman, public relations manager for the museum said in an email, “Because the array generates less than 5 percent of the museum’s power, [the purchased energy] is not a particularly large bill.”
The Independence Institute asked the Denver Museum of Science and Nature to provide certain statistical information regarding the now-famous solar array. Specifically, the Institute asked for: 1 ) Two years worth of electric bills prior to the installation of the solar array, 2 ) All electric bills following the completion of the installation. The Museum denied those requests.
As Shepherd explains, it turns out the solar panels were so expensive ($720,000) that the museum declined to undertake the project for itself. Instead, a private company was able to make it worthwhile to own the project via taxpayer-subsidized “rebates” through Xcel Energy, and via state and federal tax “incentives.”
Given the circumstances it is absurd to believe the claims made about the amount of power generated by the panels. But note the statement: “The sun generates enough energy on the museum rooftop to power about 30 homes.” Any detail beyond that hopeful generality is lost on the uncurious, lazy reporter. Note that the statement isn’t talking about the energy generated from the panels; just how much solar energy is hitting the top of the roof. And enough energy on the rooftop to power 30 homes for how long? Or how long does the sun have to hit the roof to power the homes (and for how long)? How big are the homes? Etc., etc.
And the museum has no business withholding the information that Shepherd is looking for. According to its 2007 annual report, almost a quarter (22.6%) of DMNS’s support was coerced from taxpayers: from the City and County of Denver, and from the Scientific and Cultural Facilities District (which receives 1 percent of a sales and use tax in a seven-county region surrounding the city). I would say that reaches the public interest threshold where you ought to turn over your electric bills, especially when you are trying to get to the bottom of another dubious project that is heavily subsidized by taxes and surcharges.
Bonus observation from the Denver Post story: Obama cheerleading reporter Allison Sherry, again demonstrating she is devoid of any critical thinking capacity, regurgitates his assertion that “the stimulus bill could create 60,000 jobs here and 400,000 jobs nationwide.” Really? Colorado would likely get 15 percent of the stimulus-driven jobs for the whole nation?
Bonus observation II from the article: Blake Jones, who owns the company that installed the solar panels, looks forward to the stimulus funds: Jones said he called other CEOs of solar companies to evaluate what they found in the stimulus bill. “The consensus is that this bill will immediately benefit companies like ours,” he said. Jones said green-technology companies have dozens of projects on hold because of the freeze on venture-capital funding. He believes the stimulus package will get that funding flowing again. More proof that these things are only attractive with a massive influx of the taxpayers’ hard-earned money. See post here.
More congressional stupidity unleashed
Read also how Representatives Henry Waxman (D-California) and Edward Markey (D-Massachusetts) today unveiled the Clean Energy and Security Act, a massive bill that incorporates virtually every lame-brained global warming policy ever considered by Congress (and then some) here.
By Dr. Richard Lindzen, Alfred P. Sloan Professor of Meteorology, Department of Earth, Atmospheric and Planetary Science, MIT on Watts Up With That
The basic idea is that the atmosphere is roughly transparent to visible light, but, due to the presence of greenhouse substances like water vapor, clouds, and (to a much lesser extent) CO2 (which all absorb heat radiation, and hence inhibit the cooling emission), the earth is warmer than it would be in the absence of such gases.
If water vapor and clouds respond to the increase in temperature in such a manner as to further enhance the cooling inhibition then we have what is called a positive feedback, and the temperature needed to reestablish equilibrium will be increased. In the climate GCMs (General Circulation Models) referred to by the IPCC (the UN’s Intergovernmental Panel on Climate Change), this new temperature ranges from roughly 1.5C to 5C. The equilibrium response to a doubling of CO2 (including the effects of feedbacks) is commonly referred to as the climate sensitivity.
When temperature fluctuations lead to warmer temperatures, emitted heat radiation should increase, but positive feedbacks should inhibit these emissions by virtue of the enhanced ‘blanketing.’ Given the model climate sensitivities, this ‘blanketing’ should typically reduce the emissions by a factor of about 2 or 3 from what one would see in the absence of feedbacks. If the satellite data confirms the calculated emissions, then this would constitute solid evidence that the model feedbacks are correct.
Two Important Points: 1. Equilibration takes time, 2. The feedbacks are responses to temperature - not to CO2 increases per se. The time it takes depends primarily on the climate sensitivity, and the rapidity with which heat is transported down into the ocean. Both higher sensitivity and more rapid mixing lead to longer times. For the models referred to by the IPCC, this time is on the order of decades. This all leads to a crucial observational test of feedbacks!
The Results of an Inadvertent Test
From Wielicki, B.A., T. Wong, et al, 2002: Evidence for large decadal variability in the tropical mean radiative energy budget. Science, 295, 841-844.
Comparison of the observed broadband LW flux anomalies for the tropics with climate model simulations using observed SST records. The models are not given volcanic aerosols, so the should not expected to show the Mt. Pinatubo eruption effects in mid-1991 through mid-1993. The dashed line shows the mean of all five models, and the gray band shows the total rnage of model anomalies (maximum to minimum). Image below, larger here.
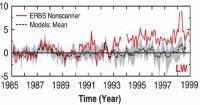
From 1985 until 1989 the models and observations are more or less the same - they have, in fact, been tuned to be so. However, with the warming after 1989, the observations characteristically exceed 7 times the model values. Recall that if the observations were only 2-3 times what the models produce, it would correspond to no feedback. What we see is much more than this - implying strong negative feedback. Note that the ups and downs of both the observations and the model (forced by observed sea surface temperature) follow the ups and downs of temperature (not shown). Note that these results were sufficiently surprising that they were confirmed by at least 4 other groups.
The authors did not dwell on the profound implications of these results - they had not intended a test of model feedbacks! Rather, they mostly emphasized that the differences had to arise from cloud behavior (a well acknowledged weakness of current models). However, as noted by Chou and Lindzen (2005, Comments on “Examination of the Decadal Tropical Mean ERBS Nonscanner Radiation Data for the Iris Hypothesis”, J. Climate, 18, 2123-2127), the results imply a strong negative feedback regardless of what one attributes this to.
The Bottom Line
The earth’s climate (in contrast to the climate in current climate GCMs) is dominated by a strong net negative feedback. Climate sensitivity is on the order of 0.3C, and such warming as may arise from increasing greenhouse gases will be indistinguishable from the fluctuations in climate that occur naturally from processes internal to the climate system itself.
Read full post and comments here.
Note: Many of the scientists are current and former UN IPCC reviewers and some have reversed their views on man-made warming and are now skeptical. Also note Nobel Laureate for Physics Dr. Ivar Giaever signed. Giaever endorsed Obama for President in an October 29, 2008 letter.
“Few challenges facing America and the world are more urgent than combating climate change. The science is beyond dispute and the facts are clear.”
- PRESIDENT-ELECT BARACK OBAMA, NOVEMBER 19 , 2008
With all due respect Mr. President, that is not true.
We, the undersigned scientists, maintain that the case for alarm regarding climate change is grossly overstated. Surface temperature changes over the past century have been episodic and modest and there has been no net global warming for over a decade now.
After controlling for population growth and property values, there has been no increase in damages from severe weather-related events.1,2
The computer models forecasting rapid temperature change abjectly fail to explain recent climate behavior. 3
Mr. President, your characterization of the scientific facts regarding climate change and the degree of certainty informing the scientific debate is simply incorrect. 4
Signed by over 100 scientists (see letter and list here).
Footnotes
1. Swanson, K.L., and A. A. Tsonis. Geophysical Research Letters, in press: DOI:10.1029/2008GL037022.
2. Brohan, P., et al. Journal of Geophysical Research, 2006: DOI: 10.1029/2005JD006548.
3. Pielke, R. A. Jr., et al. Bulletin of the American Meteorological Society, 2005: DOI: 10.1175/BAMS-86-10-1481.
4. Douglass, D. H., et al. International Journal of Climatology, 2007: DOI: 10.1002/joc.1651.
See Roger Pielke Sr’s post on the support for these positions and the predictable dismissive responses on Real Climate and Grist here.
By Allison Shelley, The Washington Times
One man’s meat may be another man’s poison, but the Environmental Protection Agency has taken the idea to an absurdity. EPA has just sent a proposal to the White House that would classify carbon dioxide as a health hazard.
But if there wasn’t carbon dioxide around, there would be no plants. And, for that matter, neither would there be any people or pets if we weren’t allowed to exhale. The claimed “health hazard” from carbon dioxide is, of course, global warming, yet the data we have seen, such as Stanford economist Thomas Gale Moore’s work, show that warmer temperatures and higher incomes are associated with healthier, longer-living people. In case environmentalists haven’t noticed, bio-diversity is also much greater when temperatures are higher. Over history, human civilizations have expanded during warmer periods but declined when it got cold. For a history lesson, we recommend University of California Professor Brian Fagan’s excellent book, “The Little Ice Age: How Climate Made History.”
Obviously, higher temperatures support more plant life, and that in turn supplies the food for more animals. If you want more plants, animals, and healthier people, more carbon dioxide and higher temperatures are beneficial and certainly not “hazardous to health.” All sorts of bizarre regulations already are devoted to “protecting” us from warmer temperatures - regulations that do endanger health and safety. Take mile per gallon regulation rules for cars. These rules directly endanger health and life because smaller cars are simply inherently less able to protect their passengers. Then there are mandates for compact fluorescent light bulbs that contain mercury. The EPA itself has extremely detailed and scary instructions about requiring people to leave the area once a bulb is broken. You can’t vacuum the spot, and if the spill occurs on a carpet the EPA claims that you should cut out that portion of the carpet and dispose of it properly.
There is little rational discussion on global warming these days. Consider the following questions. A “no” to any of them should logically imply that we should not restrict carbon dioxide.
(1) Are global temperatures rising? They were clearly rising from the late 1970s to 1998, but temperatures just as clearly have not gone up in the last 11 years. Indeed, the more recent numbers show evidence of cooling.
(2) Is mankind responsible for a significant and noticeable portion of an increase in temperatures? Mankind is responsible for just a few percent of greenhouse gases, and changes in greenhouse gases are responsible for just a tiny fraction of changes in global temperatures. The big factor is variations in the sun’s energy output. Last December, the Senate Committee on Environment and Public Works released a list of 400 prominent scientists who questioned the general notion of significant manmade global warming.
(3) Are increased temperatures “bad”? That answer is hardly obvious. Higher temperatures could increase ocean levels by between 7 inches and 2 feet over the next 100 years. On the other hand, massive areas from Canada to Europe to Russia would be much more habitable than now. We have already noted the other benefits to life.
(4) Finally, let’s assume that the answer to all three previous questions is “yes.” Does that mean we need more regulations and taxes? No, that is still not clear.
If we believe that man-made global warming is “bad,” we still don’t want to eliminate all carbon emissions. Having no cars, no air conditioning, or no electricity would presumably be much worse than anything people claim results from global warming. We would want to balance the benefits with any costs of additional carbon dioxide emissions.
One can see government do stupid things daily; the staggeringly harmful course it is already on is breathtaking. But hold on to the gunwales, for the ship of state in President Obama’s new environmental era will leave the United States pitching and yawing, with the world much poorer and less healthy because of it. See post here.