


Info from the Boston Globe and Alaska Volcano Observatory
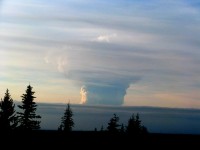
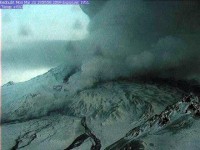
Alaska’s Mount Redoubt continued its volcanic explosions Friday, sending ash clouds as high as 60,000 feet above sea level and prompting drivers to head to the auto parts store for new air filters. The National Weather Service said most of the ash was expected to fall to the north, but trace amounts of ash from eruptions on Friday and smaller ones overnight could fall on Anchorage itself.
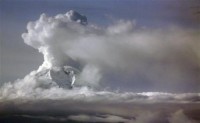
Since the series of eruptions began Sunday night, the volcano has had several (actually closer to a dozen) bursts. One on Thursday sent ash 65,000 feet high. 5 eruptions followed Friday sending ash as high as 51,000 and 60,000 feet. The last time the volcano had erupted was during a four-month period in late 1989 and early 1990.
Two mudflows produced by the volcano Friday were moving down a slough and tributary toward the Drift River Terminal, where 6.2 million gallons of oil is stored, said Chris Waythomas, a geologist with the Alaska Volcano Observatory. A concrete-reinforced dike is holding the mud back and protecting the terminal’s oil storage tanks from damage. The Coast Guard said the plan was to keep the oil in the tanks instead of draining it. “The oil is safe where it is at right now,” said Coast Guard Cmdr. Joseph Losciuto.
Closer to Anchorage, the concern Friday was ash, a fear that proved mostly unfounded. There were no immediate reports of ash falling in the city. Airborne volcanic ash, even in relatively small amounts, can damage airplane and automobile engines. Because of the eruptions, Alaska Airlines, the state’s largest carrier, said there were limited flights in and out of Anchorage.
Follow Redoubt’s actviity at the Alaskan Volcano Observatory site here. Many pages of photos are included. The longer the eruptions continue and the stronger they are, the more climatic effects they are likely to produce. The more significant high latitude eruptions historically have led to cooler hemispheric summers, the failure of the African and Indian monsoon and a colder following winter with more high latitude blocking. Since high latitude blocking is favored at solar minimum years with a easterly QBO (Quasi-Biennial Oscillation) which is the case next winter, it could be interesting. Tropical eruptions like Pinatubo or El Chichon lead to a positive arctic oscillation and although the annual and winter global temperatures are colder than normal, western Europe and eastern North America tend to be milder than normal after tropical eruptions as a result.
Seth Kantner gives us a glimpse of the harsh winter in Kotzebue in the Alaska Dispatch
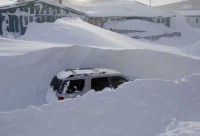
It’s March now, how March should be-blue and sunny, twenty to thirty below in the morning with daytime highs rising to zero. Winter is slipping into memory, but we still have the drifts around Kotzebue to remind us. January brought a longer-than-usual stretch of 30 and 40 below weather. We got restless, on the verge of cabin fever. We thought we deserved a break. Then the storms came, blizzards after blizzard--so often that we might as well have painted our windows white. Not that the paint would have stayed on.
Kotzebue is supposed to be stormy, but this year was more like drowning-we’d get a blow, and if we were lucky have a day to come up for air and shovel out, and then get hit with it again.
One night--the forth or fifth storm-it wailed all night from the northwest, so fierce and cold the school actually cancelled classes in the morning, a rare event here. By 10 a.m. it was sunny and bitter cold, and the kids were smiling at their amazing fortune. Twelve hours later it was 36 below and rising wind from the opposite direction. Twelve more and it was a full-on blizzard from the southeast. The radio was telling people to stay in their houses, and the town was shutdown yet again.
One morning I looked out at the nicest day in a week--two miles of gray, wind at 25mph (what we started calling “the new calm"). In the time it took to light a fire and make coffee, visibility dropped to a hundred yards and the wind doubled. Arctic Transportation Services was on approach in a Casa. It flew into the sudden whiteout. And crash-landed west of town on the ice.
Around the same time two snowmobilers left Kiana, traveling to Kotzebue. The men left the village during a rise in temperature. A 50-degree drop, combined with a whiteout on the trail lead to them becoming lost. It took five days for Search & Rescue to locate the men-just ten miles from Kotzebue--but not before they had succumbed to hypothermia.
By then folks were on edge, not just suffering from storm fever, but also from true concern. The winds had brought overflow out on Kotzebue Sound, and visibility remained so close to zero that few people ventured far on snowmobile. Half the roads in town were one lane, the rest buried.
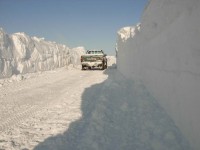
More storms lined up-one the worst I’ve ever experienced. Everyone in Kotzebue has a story a story from that blizzard. I put my camera in the freezer to chill, then went out to take photos. You could see your hand in front of your face, no problem, further than that and things started getting fuzzy. People were trapped in their trucks, lost only yards from their doors, stuck spending the night at their workplace and the school floor. Another tragedy: a person was found frozen after the storm, on the sandbar in front of town. And again, we weren’t finished-at the post office and stores people were telling their stories, and warning that another storm was coming. See more here.
By John Papineau, Ph.D, NWS Anchorage, Alaska
The climate of Alaska (i.e. long-term weather patterns) is a product of a number of different external and internal ‘forcings’. Climate varies over time as these forcings change (often small changes). The primary external forcings are: solar output, atmospheric gases (volcanic eruptions, CO2), the temperature of the water in the Pacific Ocean, as well as the strengthening or weakening of ocean currents. Changes in one or several of these forcings typically causes changes within the atmosphere as well (internal forcings), like the repositioning of the polar jet stream and the Aleutian low pressure system or the frequency of La Nina’s and El Nino’s. We will look at some of these forcings in some detail later in this study. Excerpts:
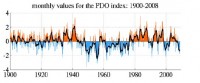
Pacific Decadal Oscillation
In the mid and late 1990’s researchers noticed that fish catches in the Gulf of Alaska seemed to fluctuate on a time scale of roughly 20 to 30 years. Closer investigation showed that sea surface temperatures (SST’s) across the region fluctuated roughly over the same time period (Manuta et al, 1997). The fluctuation from above normal water temperatures to below and vis versa has been termed the Pacific Decadal Oscillation or PDO. When SST’s in the central North Pacific are above normal, SST’s along the coast of Alaska and British Colombia tend to be warmer than normal, this is referred to as the positive phase of the PDO. When SST’s in the central North Pacific are below normal, water temperatures along the coasts are usually below normal (negative phase of the PDO). One phase of the PDO last approximately 20 to 30 years, there are occasions however where the PDO undergoes a 2-5 year mini-reversal, before reverting to its original state.
Combined Forcings
So far we have been considering forcings as individual events, in reality of course they can occur simultaneously - it is this interaction of climate forcings which makes climate research challenging. For example, El Nino’s that occur during the positive phase of the PDO do not have the same impact on temperatures and precipitation across Alaska that the equivalent El Nino would have if the PDO was in a negative phase. In some cases these climate forcings may positively interfere one with another, leading to a very large anomaly, at other times they may have a negative interference, effectively weakening each forcing.
Icecap Note: See the similarity in patterns in PDO and corresponding ENSO states.
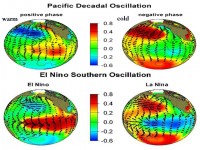
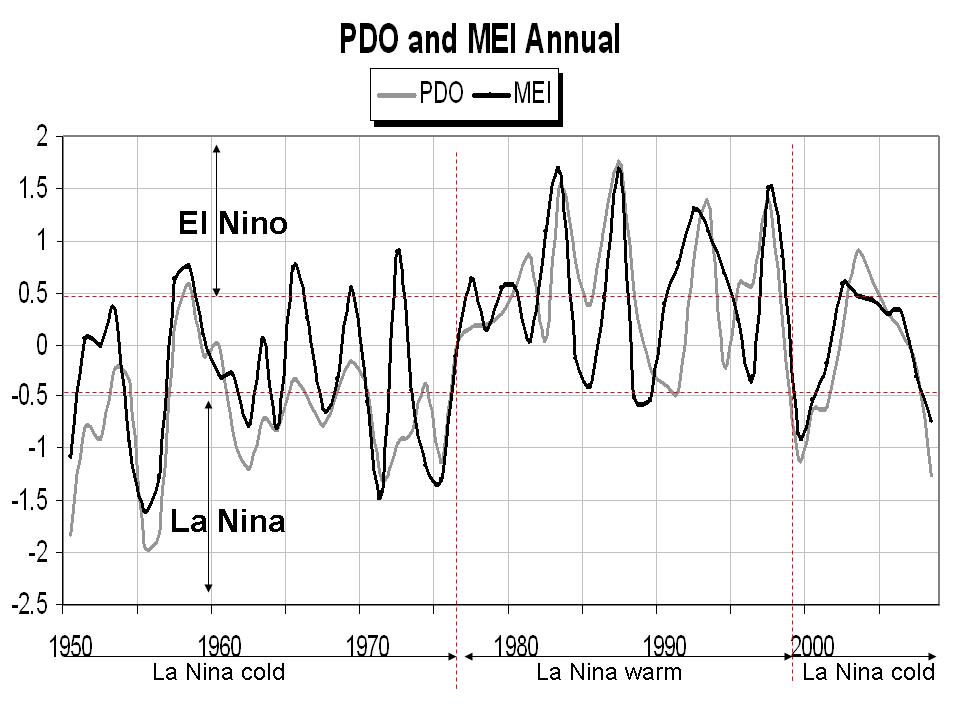
In general El Ninos are favored in the positive PDO and La Ninas in the negative phase. That can be seen in the tracking of ENSO (MEI) with PDO here)

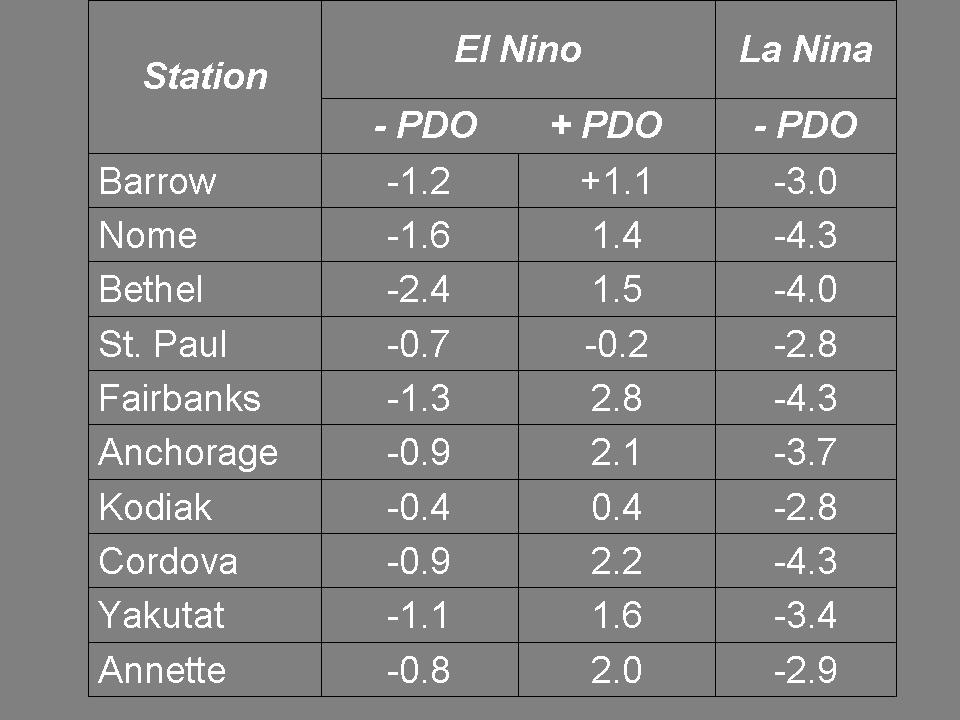
El Nino’s that occur when the PDO is negative tend to be slightly cooler when compared to the long-term mean, but the variability is large. During the positive phase of the PDO, El Nino’s tend to be warmer than normal, however there is still considerable variability (in statical terms the standard deviation is large). Notice that La Nina’s which occur during -PDO tend to produce abnormally cooler temperatures, with incidently very little variability. La Nina’s which occur during +PDO are not listed because only one occurred during the 1977-1996 period (which by the way may give some clue about the development of La Nina’s).
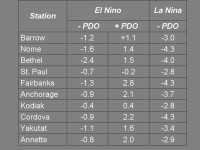
Winter temperature anomalies (F) larger version here.
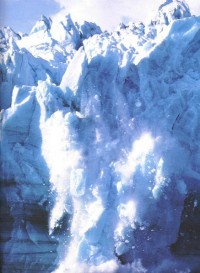
Read much more here. See earlier stories on this Alaska PDO connection here and here and advancing glaciers here.
By Nelson Lampe
In Montana, the Army National Guard dispatched two helicopters to help locate motorists stranded by a snowstorm in the southeastern part of the state. “We do know we have some motorists out there, but we don’t know where. So we have a serious situation,” said Charity Watt Levis, a spokeswoman for the Montana Department of Transportation.
Crews rescued stranded motorists, including a family of three, that had been trapped on a highway in northeast Wyoming. Up to 30 inches of snow had piled up in South Dakota’s rugged Black Hills, and the storm system also had generated tornadoes. The blowing snow cut visibility and piled in drifts as high as 4 feet in parts of Wyoming. See KELOland video here.
“We have wind gusts to 62 mph at Valentine this morning,” said National Weather Service meteorologist Clifford Cole in North Platte, Neb. A wind gust was clocked at 90 mph in Perkins County, S.D., on Tuesday, and Hettinger in southwestern North Dakota measured a gust to 55 mph.
The weather service posted blizzard warnings Tuesday for western sections of South Dakota and Nebraska, eastern Wyoming and the southeast corner of Montana. Much of western South Dakota was shut down Tuesday for a second day, with Interstate 90 closed from Chamberlain to Gillette, Wyo., a distance of 345 miles. The South Dakota Transportation Department reopened the route Tuesday night.
Visibility was so poor that the South Dakota Department of Transportation pulled snowplows off the roads. “It’s a safety concern primarily,” the DOT’s Gary Engel said. “In the November blizzard we didn’t do our closure quite as soon in that one, and we had trucks stopped right on the road. We had trucks stuck in the ditch because they couldn’t see where they were going.” Read more here.
The snowmelt after what was in parts of the Northern Plains an all-time snowiest winter, has already produced some major river flooding mainly across the Red River. Forecasters say that the Red River of the North in Fargo and Grand Forks, N.D., will ultimately reach major and possibly all-time record flood stage and has a strong likelihood of a crest measuring among the top five highest on record. Away from rivers, widespread over-land flooding is expected due to the flat terrain and frozen drainage networks in the Red River Basin. The threat in this area was so great that the National Weather Service created a new category - “High Risk” - to distinguish it from the existing “Above Average” category for flooding potential. Flooding occurred in this area in 1997 after a very snowy winter and early spring after a second year La Nina like this one. This event is said to be a “100 year” flood in parts of the area.
Larger image here.
Meanwhile, after some early spring like warmth, an early spring snowstorms is in the cards for the central plains including the drought stricken western high plains from Colorado and western Kansas south to the Oklahoma and Texas Panhandles. 12 plus inches is likely to fall Friday to Saturday.
UPDATE: Major eruption today (Thursday) at Mt. Redoubt with ash and gas cloud reaching AT LEAST 65,000 feet.
Alaska’s Mt. Redoubt volcano erupted several times starting late Sunday, sending ash plumes up to as high as an estimated 12 miles into the air, the Alaska Volcano Observatory reported. Geologists at the observatory say the volcano, located 100 miles southwest of Anchorage, began erupting at about 10:30 p.m. local time Sunday. “The ash cloud went to 50,000 feet, and it’s currently drifting toward the north, northeast,” said Janet Schaefer, a geologist with the Alaska Volcano Observatory. The wind patterns took the ash cloud away from Anchorage and instead headed toward Willow and Talkneetna, two communities near Mount McKinley, North America’s largest mountain in Denali National Park
The Anchorage Daily News reported that a fifth eruption took place sometime before 5 a.m. Alaska Daylight Time (AKDT), or 9 a.m. EDT Monday. “Another large explosion is occurring at Redoubt,” the AVO posted on its Web site 4:37 a.m. AKDT. “This is a fairly large eruption, close to the larger cities in Alaska,” said AVO geophysicist John Power. Another followed. As of Tuesday, at least 6 eruptions have taken place, with ash reaching as high as 12 miles (60,000 feet).
Read more here. See this radar loop from photo bucket and wunderground (H/T Tom Woods on WUWT).
Climatologists may disagree on how much the recent global warming is natural or manmade but there is general agreement that volcanism constitutes a wildcard in climate, producing significant global scale cooling for at least a few years following a major eruption. However, there are some interesting seasonal and regional variations of the effects.
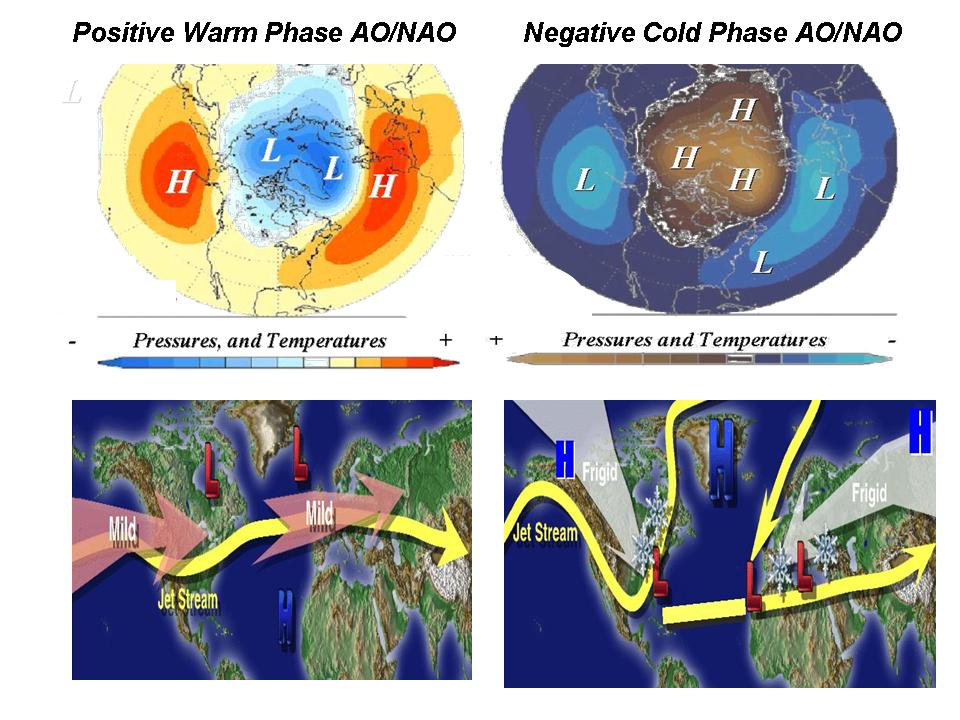
We showed that Oman and Robock (2003) and others have shown that though major volcanic eruptions seem to have their greatest cooling effect in the summer months, the location of the volcano determines whether the winters are colder or warmer over large parts of North America and Eurasia. According to Oman, tropical region volcanoes like El Chichon and Pinatubo actually produce a warming in winter due to a tendency for a more positive North Atlantic Oscillation (NAO) and Arctic Oscillation (AO) - below left top and bottom. In the positive phase of these large scale pressure oscillations, low pressure and cold air is trapped in high latitudes and the resulting more westerly jet stream winds drives milder maritime air into the continents.
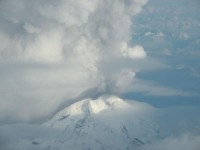
Oman found high latitude volcanoes like Katmai (Alaska in 1912) instead favored the negative phase of the Arctic and North Atlantic Oscillations and cold winters - right side top and bottom. In the negative phase, the jet stream winds buckled and forced cold air south from Canada into the eastern United States and west from Siberia into Europe. They also favored a cooling of middle and higher latitudes the year round of that atmosphere and a weakening of the summer monsoon in India. Is this event strong enough and the material injected into the stratosphere which is lower in high latitudes (well below 60,000 feet) large enough to have a major impact. That assessment will take a few days. Eruptions may continue for days or weeks or as in 1989/90, the time of the last Redoubt eruption, for months.
Mt. Redoubt when it erupted in 1989.
By Casey Kazan
A team of MIT scientists recorded a nearly simultaneous world-wide increase in methane levels -the first increase in ten years. What baffles the team is that this data contradicts theories stating humans are the primary source of increase in greenhouse gas. It takes about one full year for gases generated in the highly industrial northern hemisphere to cycle through and reach the southern hemisphere. Since all worldwide levels rose simultaneously throughout the same year, however, it is probable that this may be part of a natural cycle - and not the direct result of man’s contributions.
MIT’s Matthew Rigby and Ronald Prinn, the TEPCO Professor of Atmospheric Chemistry in MIT’s Department of Earth, Atmospheric and Planetary Science, state that this imbalance has resulted in several million metric tons of additional methane in the atmosphere. Methane is produced by wetlands, rice paddies, cattle, and the gas and coal industries, and is destroyed by reaction with the hydroxyl free radical (OH), often referred to as the atmosphere’s “cleanser.”
Methane accounts for roughly one-fifth of greenhouse gases in the atmosphere, though its effect is 25x greater than that of carbon dioxide. Its impact on global warming comes from the reflection of the sun’s light back to the Earth. Methane is broken down in the atmosphere by the free radical hydroxyl (OH), a naturally occuring process. This atmospheric cleanser has been shown to adjust itself up and down periodically, and is believed to account for the lack of increases in methane levels in Earth’s atmosphere over the past ten years despite notable simultaneous increases by man.
One thing does seem very clear, however; science is only beginning to get a focus on the big picture of global warming. Findings like these tell us it’s too early to know for sure if man’s impact is affecting things at “alarming rates.” We may simply be going through another natural cycle of warmer and colder times - one that’s been observed through a scientific analysis of the Earth to be naturally occurring for hundreds of thousands of years. See the full study here.
By Jay Dwight and Joe D’Aleo
Many states and the Federal Government are putting a lot of faith in renewable energy sources especially wind and solar as solutions for our energy independence and future cost reduction. However, unlike other energy sources such as natural gas, oil, coal, nuclear, tidal, geothermal and to a large degree hydro, wind and solar are much less reliable and cost effective, requiring heavy subsidization. See how Shell Oil just announced today it is backing off its wind and solar efforts as they found them to be not cost effective.
In fact of the primary energy sources, wind power is the most expensive:
Wind = 21.97 cents per kwh
Gas and oil = 12.28 cents per kwh
Nuclear = 11.06 cents per kwh
Hydro = 7.60 cents per kwh
Believing in wind is a fool’s errand. The reasons are simple. Wind is costly, inefficient and erratic.
The New Hampshire Climate Action plan to be released on March 27th by Governor Lynch like the one in neighbor state Maine relies heavily on wind power. Dr. Fred Ward using the NHDES’s own calculations, found you could put a wind power turbine on every hill in the state and yet get at most half the electricity that one single nuclear power plant could deliver.

Vaclac Klaus from the Czech Republic in his book “Blue Planet in Green Shackles” asked the question “Could the Czech Republic replace the power output from the Temelin nuclear power plant by wind?” Using conservative estimates the answer is yes but it would take 7,750 wind turbine power plants requiring 8.6 million tons of material and would cover a 413 mile long line of turbines 492 feet high, corresponding to a distance from Temelin in the southern Czech Republic to Brussels in Belgium or in the US, the distance from Concord, NH to Washington DC.
Even if, under ideal conditions, wind could provide a substantial portion of the energy needed for a state or region, you would have to have a back-up permanent and reliable source to turn to when the wind fails. See examples of how the wind has stopped when needed most here, here and here. In other words, hydro, gas, oil, nuclear, or coal turbines must be available and in ready back-up mode at all times. If the ‘shovel ready’ sources are at a much less expensive cost, why waste money on an unreliable source? Ask Arnold how the enviro inspired government programs are working so far in his state, which he proudly announced was leading the nation.
Wind energy can be a ‘supplemental’, but is will never be a reliable ‘primary’ supply of electricity on a large scale. Solar and wind both may have greater potential regionally, say in the deserts of the southwest, the intermountain and the high western plains, but that generated energy must be carried to the national grid and the transmission lines often meet resistance from the same environmental groups pushing the wind and solar as the solutions. Also wind turbines kill birds and bats in large number, upsetting other environmental groups.
There is just nothing we can do to ensure the wind will blow or sun will shine. The governors, state legislature even congress and the administration can’t mandate the wind blow and sun shine, like they can and do control virtually every other aspect of our lives. They brush this off with talk of a smart grid, but while that is necessary, energy storage is just as important, and that has gotten little attention.
To summarize, wind power has half a dozen major problems: erratic behavior, system load problems, dependency problems, need to transmit the energy usually long distances from remote locations, energy must be stored and merged with other sources and the technology requires heavy taxpayer subsidy.
We certainly support conservation and energy innovation but we believe all sources of energy must be pursued including (as Obama called for during his campaign in coal states) clean coal, drilling for oil and gas offshore near the Gulf and in ANWR, extracting oil from tar sands and oil shale, a second generation nuclear, geothermal, tidal, solar and wind. If we don’t let the environmental lobby control our future using a failed theory to focus all attention on the carbon dioxide boogeyman and restricting our choices for future energy sources, we CAN be energy independent and have the future we all envisioned possible not too many months ago. Read more and see calculations here. See similar story from the Scientific Alliance Newsletter here.
See this excellent detailed analysis of all the sources that concludes natural gas is the best alternative here. See here how one alternative energy company whines about the low cost of natural gas making solar and wind less competitive.
See current energy sources - enlarged here.
By L.B. Klyashtorin, A.A. Lyubushin English Version Edited by Dr. Gary Sharp
Icecap Note: My presentation at the ICCC 2009 conference related to both data integrity and the cycles (averaging around 60 years) of the sun and oceans which fit like a glove with temperatures. I had to leave out the Arctic which exhibits the identical behavior because of time limitations.
Here is a larger graph.
I received a copy of this PDF from the authors of a book that discovered a 60 year cycle and a strong relationship with fish productivity, after they saw the presentation on-line and how well it fit with their book “Climate Changes and Fish Productivity”. Here are some relevant excerpts of their excellent book (PDF here):
Recently, 60-70 year repeating alterations of hemispherical and global climate were detected [Schlesinger, Ramankutty, 1994; Minobe, 1997, 1999, 2000]. Temperature sequences for the recent 1500 years, reconstructed from Greenland ice core samples, show domination of approximately 60-year periodicity of the climate fluctuations [Klyashtorin, Lyubushin, 2003; Klyashtorin, Lyubushin, 2005]. For the same period, similar (50-70 year) temperature periodicity was detected in the analysis of long-living tree annual growth rings in the Arctic region and California. Reconstruction of sardine and anchovy population fluctuations by analysis of scales in bottom sediments in Californian upwelling for the latest 1700 years has indicated their approximately 60-year periodicity [Baumgartner et al., 1992].
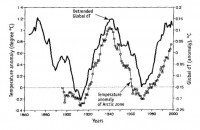
At the background of the secular linear trend, Global dT undergoes longperiod, up to 60-year long, fluctuations. These fluctuations can be detected by detrending with the help of a standard statistical operation [Statgraphics, 1988]. After detrending, the long-period fluctuations of Global dT with the maxima at about 1870s, 1930s and, apparently, at 1990s are clearly observed. Global dT detrending allows detection of 2.5 cycles of approximately 60-year global dT fluctuations. An approximately 60-year repeating pattern is also observed well from temperature anomaly dynamics in the circumpolar Arctic zone (Arctic dT) between 60 and 85N. Detrended Global dT behavior compared with Arctic dT is shown in the following:
Here is a larger graph.
The specific feature of the long-period temperature dynamics in the Arctic zone is the absence of secular, linearly increasing temperature trend observed for Global dT (note this is more evidence that the global warming trend is exaggerated, largely due to UHI and data issues as I covered in my ICCC powerpoint). Comparison of detrended Global dT and Arctic dT fluctuation dynamics demonstrates almost complete coincidence in behavior of these two indices during the last 100 years. This indicates that, actually, the Global dT linear increasing trend is not a global phenomenon. At the same time, approximate 60-70-year repeating pattern is observed for both Global dT and Arctic dT [Alekseev et al., 2000; Alekseev, 2003].
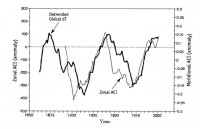
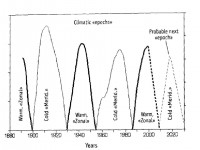
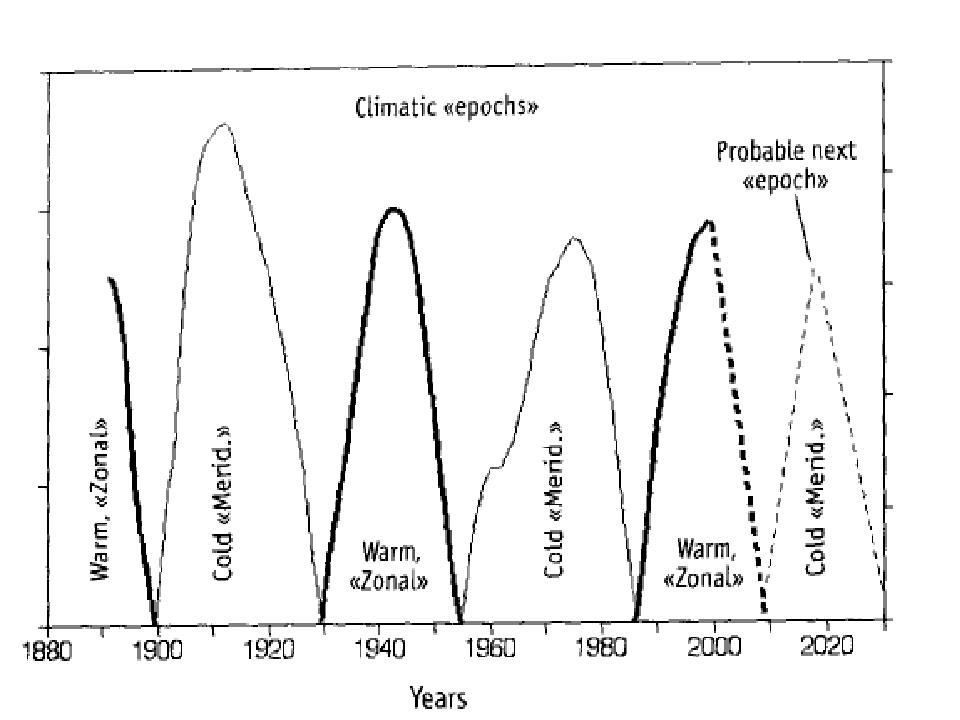
Another important climate index is Atmospheric Circulation Index (ACI), which characterizes periods of relative predominance of “zonal” or “meridional” air transfer by the hemisphere. This index is known as the Vangenheim-Girs Index and is calculated from the observations for direction of the air transfer in Atlantic-Eurasian region (30-80N and 45-75E) during the last 110 years [Vangenheim, 1940; Girs, 1971]. The Vangenheim-Girs classification is based on the multiyear repetition of air transfer directions, which is widely used in the works by Russian experts in meteorology and climatology.
Here is a larger graph.
For separating climatic epochs by alteration of atmospheric circulation forms and Global dT fluctuations only upper parts of the curves are used. The scheme clearly demonstrates alteration of warm (zonal) and cold (meridional) epochs with approximately 30-year repetition during the last 110 years. On this basis it is reasonable that the current warm or zonal climatic epoch, started in 1970s, will probably finish in the first decade of 2000s, and the subsequent cold epoch will last since 2010s till 2030s.
Here is a larger graph.
This fits with the prior analysis and also with the work of Easterbrook, Spencer and Tsonis and many others. Read much more of this excellent, thorough review of the conference here in the American Thinker and here in the American Spectator. See videos of the keynotes (and soon of all the talks) and powerpoints of the talks here.
By Peter Risdon on Freeborn John
Last June I reported on the allegations of academic fraud levelled by a British mathematician, Doug Keenan, against Professor Wei-Chyung Wang of New York State University at Albany. Dr Keenan alleged that in work that has come to be widely cited in climate studies, work that included the collation of data from temperature measuring stations in China, Professor Wang made statements that “cannot be true and could not be in error by accident. The statements are fabricated.”
In August 2007, Dr Keenan submitted a report (pdf) of his allegations to the Vice President for Research at Wang’s university and an inquiry was initiated. In February 2008 this was escalated into a full investigation by the Inquiry Committee. All this was summarised in my earlier post, together with quotations from Dr Keenan’s allegation.
So far, things had run as might be expected. A fraud had been alleged, the University at Albany looked into it and decided to hold a formal investigation. Dr Keenan waited to be contacted by the investigation and asked to put his case, in line with the university’s Policy and Procedures on Misconduct in Research and Scholarship
The complainant is responsible for making allegations in good faith, maintaining confidentiality, and cooperating fully with an inquiry and/or investigation. Dr Keenan lived up to the responsibility as stated in the final paragraph above so far as he could. He had made the allegation in good faith and given Professor Wang an opportunity to explain how he had reached his results, an opportunity the Professor had not taken. Keenan maintained confidentiality. In order to cooperate with the investigation, though he would first have to be contacted by it. Dr Keenan waited.
Late in May 2008 a communication arrived from Albany. It said: “After careful review of the evidence and thoughtful deliberation, the Investigation Committee finds no evidence of the alleged fabrication of results and nothing that rises to the level of research misconduct having been committed by Dr. Wang.” As the institutional official responsible for this case, I have accepted the Committee’s findings and the Report. You have fourteen (14) calendar days from the date of this letter to provide any comments to add to the report for the record. Contrary to its own rules, the Committee had not given Keenan the opportunity to “review portions of the inquiry and investigation reports”.
That’s astonishing, but here’s where it becomes Kafkaesque. Keenan was being asked, in this most recent communication, to comment on the report of the Committee. But he was not sent a copy of the report. When he challenged this, he received an email from Adrienne Bonilla explaining that: [Keenan] did not receive a copy of the Investigation report because the report did not include portions addressing your role and opinions in the investigation phase.
Keenan then wrote to the Vice President for Research at Albany, Lynn Videka, pointing out the various ways in which the University had breached its own policy, stating that its behaviour was consistent with a cover up, and pointing out that Professor Wang has received more than $7 million in grants from a couple of US federal agencies. In August 2008, Lynn Videka wrote to Keenan enclosing a final copy of a “determination” of the investigation. In her covering note, she stated: “I am notifying you of the case outcome because you were the complainant in this case. The University’s misconduct policies and the Office of Research Integrity regulations preclude discussion of any information pertaining to this case with others who were not directly involved in the investigation.”
To summarise, the university initiated an investigation, then broke its own rules by not involving Dr Keenan. It then produced a report that carefully avoided mentioning Dr Keenan, so it could claim he was not entitled to see a copy of this report. But Doug Keenan is a tenacious man. In July 2008, after being refused sight of the report, he submitted a formal complaint (pdf) to the Public Integrity Bureau at the Office of the Attorney General of New York State, alleging criminal fraud. Read much more here.
WISN Milwaukee
The bitter cold and record snowfalls from two wicked winters are causing people to ask if the global climate is truly changing.The climate is known to be variable and, in recent years, more scientific thought and research has been focused on the global temperature and how humanity might be influencing it.
However, a new study by the University of Wisconsin-Milwaukee could turn the climate change world upside down. Scientists at the university used a math application known as synchronized chaos and applied it to climate data taken over the past 100 years. “Imagine that you have four synchronized swimmers and they are not holding hands and they do their program and everything is fine; now, if they begin to hold hands and hold hands tightly, most likely a slight error will destroy the synchronization. Well, we applied the same analogy to climate,” researcher Dr. Anastasios Tsonis said.
Scientists said that the air and ocean systems of the earth are now showing signs of synchronizing with each other. Eventually, the systems begin to couple and the synchronous state is destroyed, leading to a climate shift.
“In climate, when this happens, the climate state changes. You go from a cooling regime to a warming regime or a warming regime to a cooling regime. This way we were able to explain all the fluctuations in the global temperature trend in the past century,” Tsonis said. “The research team has found the warming trend of the past 30 years has stopped and in fact global temperatures have leveled off since 2001.”
The most recent climate shift probably occurred at about the year 2000. Now the question is how has warming slowed and how much influence does human activity have? “But if we don’t understand what is natural, I don’t think we can say much about what the humans are doing. So our interest is to understand—first the natural variability of climate—and then take it from there. So we were very excited when we realized a lot of changes in the past century from warmer to cooler and then back to warmer were all natural,” Tsonis said. Tsonis said he thinks the current trend of steady or even cooling earth temps may last a couple of decades or until the next climate shift occurs. Read more here.
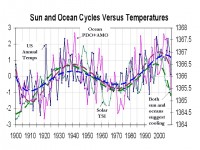
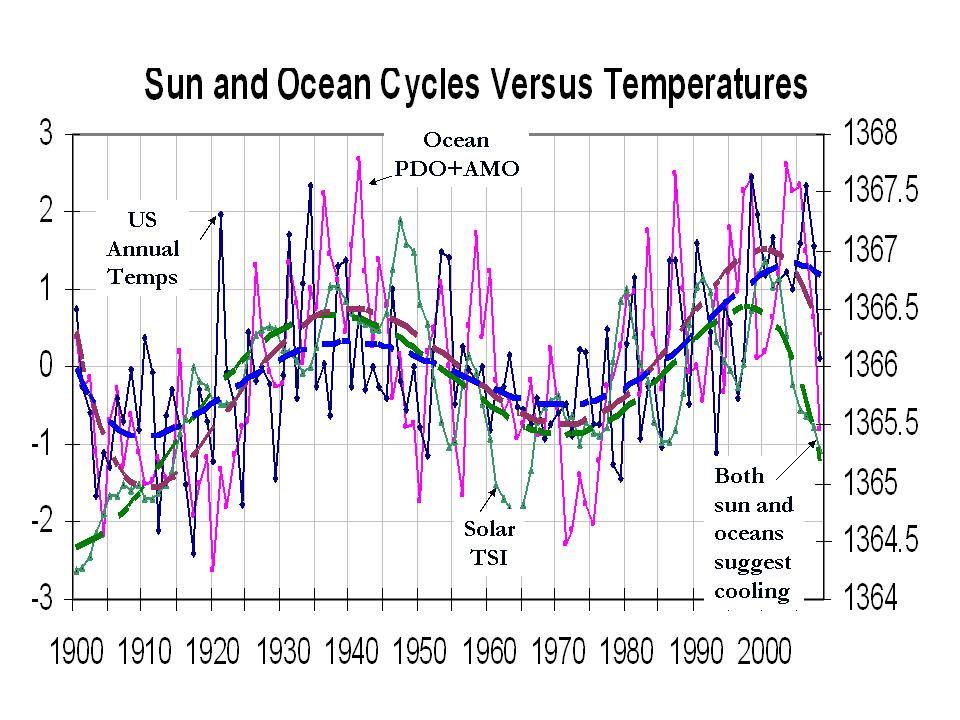
This image shows how the ocean cycles (Pacific PDO, Atlantic AMO which relates to the NAO) and solar cycles (Total Solar Irradiance) corresponds with the USHCN Us annual mean temperatures. Notice the changes occurring around 2000 and before in the 1970s and around 1940. See larger image here.
By Marc Sheppard, the American Thinker
“There is no convincing scientific evidence that human release of carbon dioxide, methane, or other greenhouse gasses is causing or will, in the foreseeable future, cause catastrophic heating of the Earth’s atmosphere and disruption of the Earth’s climate. Moreover, there is substantial scientific evidence that increases in atmospheric carbon dioxide produce many beneficial effects upon the natural plant and animal environments of the Earth.”—from the Oregon Petition, signed by over 31,000 scientists.
United by that conviction, over 800 scientists, economists, and policy makers arrived in New York City last Sunday to attend the Heartland Institute’s 2nd Annual International Conference on Climate Change. They came to talk a wide range of subjects, from climatology to energy policy, from computer climate models to cap-and-trade, from greenhouse gas (GHG) effects to solar irradiation. But most of all they came to help spread the word that the answer to the question posed by this year’s theme—Global warming: Was it ever really a crisis?—is a resounding NO.
Sunday’s keynote speakers wasted no time making that point. Czech Republic President Vaclav Klaus scolded those whose alarmist opinions are driven by profits from writing and speaking fees, carbon trading and investments in non-carbon fuel products. And policy makers who blindly accept hyped Intergovernmental Panel on Climate Change (IPCC) publications as the final word in climate science. In truth, says Klaus, there is no fixed relationship between CO2 and temperatures, as clearly illustrated by the wavering heat trends of the 20th century, despite the steady rise in CO2.
Next, M.I.T’s Richard Lindzen explained that many scientists tow the anthropogenic global warming (AGW) line to “make their lives easier,” as underfunded scientists can write a single paper endorsing AGW and suddenly be inundated with offers. Even ambiguous or meaningless statements that can be easily spun are financially beneficial to scientists, so why complain about the spin? Ever wonder why you never stop hearing about studies finding GW responsible for everything from kidney stones to cannibalism? Explains Lindzen: It’s become standard that whatever you’re studying, include global warming’s effects in your proposal and you’ll get your funding.
Lindzen then dismissed climate models that alarmists depend on as they themselves depend entirely on warming positive feedback but, unlike nature, ignore the cooling effects of negative feedback. And rejected the warming alarmists alarm us about as so miniscule that there’s no need for any external forcing to achieve or explain it. In reality, said the world renowned atmospheric physicist, doubling or even tripling CO2 would have only marginal impacts on temperatures. Both speakers masterfully set the stage for the days and sessions to come. What follows is just a sampling of the brilliance I encountered.
Roy Spencer echoed Lindzen’s position that negative feedbacks ultimately bring equilibrium to the energy balance, making sustained global warming a non-issue. David Douglass assured us that ocean and atmospheric heat will always work toward such balance as per conservation of energy laws. S. Fred Singer commented that a 2005 paper by Hansen et al claiming that Earth’s energy imbalance is proof of AGW was absurd. Geologist and former astronaut Jack Schmidt inverted the IPCC position that burning fossil fuels increases atmospheric CO2, which in turn warms the planet. Slowly increasing temperatures from 1660 AD or so, said he, would increase CO2 and methane from land, land confined water, the biosphere and, mostly, the oceans. The vapor pressure of CO2 is temperature sensitive. So as a matter of established physics of gases, we’d expect atmospheric CO2 to increase as temperature increases. Therefore, he concludes, saying that CO2 causes heating is like saying “accidents cause speeding.”
Singer moderated a panel discussion thoroughly debunking a recent paper claiming that CO2 put into the atmosphere lasts thousands of years. Participant Douglass questioned the premise as “it has nothing to do with global warming as CO2 continues to rise but GW stopped after 1991.” But as Singer pointed out, alarmists will claim it proves that peak values reached in the next few years will determine climate for the next millennium. And Christopher Essex nailed it: Their 1000 year forecast is remarkable - even groundhogs only predict 6 months ahead.
Astrophysicist Willie Soon proclaimed the sun-induced climate change theory alive and well. He believes that, while IPCC AR4 fraudulently disregarded Milankovitch’s theory of orbital influences on climate, the comings and goings of the ice ages may be controlled by changes in solar insolation at climatically sensitive latitudes. He displayed adjacent line graphs overlaying 20th Century arctic temperature anomalies with solar irradiance levels on one and atmospheric CO2 levels on the other. Whereas the former lined up almost perfectly, the latter wasn’t even close. Jack Schmidt pointed out that the 1400 -1900 cold period known as the Little Ice Age corresponds to a cycling sequence of 3 deep minima of sunspot activity and was at its coldest during the last of these minima, the 70 year period of exceptionally few spots we now know as the Maunder Minimum. Dennis Avery reinforced his 1,500 year climate cycle argument and its implications for the current warming period. He told us that solar variations are linked to decade-lagging sea temperatures. What’s more, diminished sunspot activity since 2000 and Pacific Sea Surface cooling since 2008 predict a 20-30 year global cooling due to short term Pacific Decadal Oscillation (PDO). Don Easterbrook neatly tied variances in the PDO and another natural climate variability, the Atlantic Multidecadal Oscillation (AMO), to that of solar activity and, ultimately, temperatures. The geologist pointed out that while the IPCC predicted 1F warming by 2011, there’s been none since 1998, and that the 1F drop in 2008 was the largest global temperature change ever recorded. He too believes that the current PDO cool phase assures global cooling for as long as the next three decades.
Roy Spencer blamed the PDO for 75% of twentieth century warming. He provided a line graph plotting temperatures against the PDO and the correlation was quite remarkable. Weaker PDOs yielded warmer temperatures and the onset of stronger circulations cooled things down. As one might suspect—Spencer’s graph depicted a decided cooling trend beginning in 2003. ICECAP’s Joe D’Aleo also made an extremely compelling argument against the greenhouse effect and for the natural climate drivers of oceans, the sun, and yet another—volcanoes. On D’Aleo’s graphs, PDO/AMO aligned well with USHCN temperatures over last century, as did stratospheric aerosol levels from volcanic eruptions, and total solar irradiance. He remarked that “all three show a cycle where the last few years look a lot like the 1960’s,” which immediately caught my attention. You see, just hours prior, I had been discussing NY weather with a British representative and had commented that this winter reminded me of those I experienced as a child in the 60’s.
California Congressman Tom McClintock offered examples of just how global warming is damaging his state --- all in the form of radical construction blocking, agriculture crippling, resource wasting legislation the warm-mongers have gotten through to fight it. Here’s a beauty—a homeowner can be fined $1000/day for refusal to cut down his trees if they block a neighbor’s solar panels, but also faces fines if he cuts them down or clears brush for fire preventive purposes. And Gov. Schwarzenegger - who just proposed the largest tax increase in history to make up for funds lost by his failed green policies—wants Cal-E-Fornia to be “an example to the country.” Bennie Peiser, founder and editor of the fabulous CCNet, explained the political backlash European greenies are experiencing. And it’s pretty bad—Labor and Green parties are seeing the amalgamation of the recession and failed Kyoto-inspired energy policies driving their core voters away. Lawrence Solomon offered more examples of overseas carbon regulation disasters, declaring Kyoto the greatest single destroyer of the environment, especially in the third world. Dave Kreutzer warned that analytical models predict estimated aggregate losses to Gross Domestic Product (GDP) of $4.8 trillion and job losses in the manufacturing sector of nearly 3 million by 2029 if CAT were imposed under S. 2191. That’s over and above the million manufacturing job losses economists predict will occur even if we do nothing.
And the losses will extend beyond the monetary. Professor Arthur Robinson, author of the afore-quoted Oregon petition, revealed the true reasons we import 30% of our energy, even though “one Palo Verde Nuclear Installation in each state results in $200 billion net export of energy.” Robinson says there are those who would prefer that 30% grow much larger, encouraging higher energy prices and ultimately - rationing. And quickly advised—once we become victims of rationing in the west we lose our all of our freedoms, but energy deprivation in third world countries will lead to the loss of tens of millions of lives.
And Monckton took on another deadly green scheme as only his Lordship can: “Their biofuel scam, a nasty by-product of their shoddy, senseless, failed, falsified, fraudulent ‘global warming’ bugaboo, has turned millions of acres of agricultural land from growing food for humans to growing fuel for automobiles. If we let them, they will carelessly kill tens of millions more by pursuing Osamabamarama’s stated ambition of shutting down nine-tenths of the economies of the West and flinging us back to the Stone Age without even the right to light fires in our caves.”
Retired senior NASA atmospheric scientist John Theon expressed his regret that former employee, James Hansen, “didn’t receive the attention from me that he should have.” What followed was a heartfelt denunciation that included the fact that Hansen’s 1988 announcement of “unprecedented global warming” came as a surprise and embarrassment to Theon, as it was not NASA’s position. He then cried foul over Hansen’s endorsement of John Kerry for president in 2004, particularly after receiving the Heinz Environment Award, a $250,000 prize honoring the late-husband of Kerry’s wife in 2001. He pointed out that a civil servant endorsing a political cause violated the Hatch Act, and that alone should be grounds for dismissal, which he has publically called for. Says Theon: “I think the man is sincere, but he is suffering from a bad case of megalomania.”
There were a number of problems with data collection methods discussed. Tom Segalstad gave us a lesson in the dubious integrity of ice-core samples. WUWT’s Anthony Watts favored us once again with stories and photographs of misplaced Maximum-Minimum Temperature Systems (MMTS). He and his cohorts have photographed and analyzed 75% of the 1200 plus national weather stations, and the results range from bad to hysterically bad. One slide showed a station in Detroit Lakes, Minnesota where the thermometer was placed within feet of not one, but two air conditioning outlets. The fact this town reported temperature well above those of its neighbors didn’t seem to raise any red-flags with the good folks ate NOAA. So it’s not particularly shocking that only 11% of stations surveyed met the required Class I or Class II requirement of likely measurement error under 1C. Joe D’Aleo believes that surface data suffer from serious issues biasing them to the warm side, this due to station dropout, missing monthly data, and inadequate or nonexistent urban heat island effect (UHI) adjustment. Half of the warming since 1880 may be attributed to these measurement contaminations. In fact, Climate Audit’s Steve McIntyre said we don’t actually know that the 1998 was the warmest year of the millennium as minor variations in data version yield different results.
There was also much talk about response and adaptation: Dennis Avery reminded us that history shows that warm times have been good times. During the Medieval Warm Period, world population doubled, crops flourished, there was less disease and no bubonic plague. Most of Europe’s castles and cathedrals as well as India’s most famous temples were built during that period. And that as polar bears date back 130,000 years, they’ve managed to adapt through many warming periods more severe than the current one.
During Tuesday’s standing-O-rousing conference-closing speech, in which he marvelously referred to alarmists as “bed-wetting moaning Minnies of the Apocalyptic Traffic-Light Tendency—those Greens too yellow to admit they’re really Reds,” Lord Monckton added: “Every opinion poll--even those conducted by the bed-wetters themselves - shows that global public opinion is cooling as fast as the global climate. In one recent survey, ‘global warming’ came at the very bottom of a list of political and environmental concerns, immediately behind the need to clean up dog-poop on the streets. Why? Because dog-poop is a real environmental problem and ‘Global warming’ is not. The correct policy response to the non-problem of climate change is to have the courage to do nothing.” And then emphasized unequivocally: “There is no climate crisis. There was no climate crisis. There will be no climate crisis.” Read much more of this excellent, thorough review of the conference here. See videos of the keynotes (and soon of all the talks) and powerpoints of the talks here.
By Joseph D’Aleo
Over 800 scientists and economists from 24 countries were in attendance this week at the Second Annual ICCC in New York City organized by the Heartland and with 60 co-sponsoring organizations including Icecap. They heard talks by 80 scientists from 14 countries. The opening remarks were made by the Heartland’s Joe Bast. The presentations of the keynote speakers which included Vaclav Klaus, President of the Czech Republic and the European Union, Dr. Richard Lindzen, Astronaut Harrison Schmidt, former Hansen boss Dr. John Theon, Former Governor Dr. John Sununu, Dr. Arthur Robinson, Dr. Bob Carter, Lord Monckton, and Dr. Willie Soon ARE NOW all available on the Heartland ICCC 2009 web site. The others were all videotaped and will be made available over upcoming weeks. THE POWERPOINTS ARE NOW ALREADY LOADED for all the excellent talks. Sections from the talks will be combined into other videos that tell the real climate story and distributed to decision makers and schools and groups that care about the truth or wish to hear both sides of the story.
One of the major outputs was Anthony Watt’s report on the surface station project. He documented the results of the siting survey of the US climate network. He and his team of volunteers are now 75% through the climate network and only 11% of the stations meet the government’s own published standards. He had a wonderful publication that will be widely distributed to decision makers.
The success of the conference was proof positive that we have won the battle of the science despite the media’s and alarmist blog proclamations and resistance to even acknowledge we exist.
To counter us and try and feed the hungry media and keep the world in a state of alarm, there has been a flurry of recent bogus papers that should never have passed peer review by Solomon and Steig/Mann.
Meanwhile grant toting scientists are meeting in Copenhagen to scare monger and present more total nonsense, huge exaggerations and outright contrived model based fabrications (here, here, here, here and here) to try and save their movement and keep the gravy train of money flowing. See in this ICCC paper by Astronaut Harrison Schmitt how the alarmists intentionally attempt to mislead. Even Andy Revkin in the New York Times dotearth blog worries this doom mongering by the alarmists in Copenhagen is bordering on “climate porn” and will backfire.
Despite the desperation on the part of the alarmist community, the irony is that the public is coming around to our side in droves (here and here and here) even as the media tries to promote the alarmist drivel and ignore us and the rapidly increasing body of peer review science that has been debunked the greenhouse warming theory while proclaiming we “climate realists” are in disarray and in decline.
The alarmist blogs and media are doing their thing claiming the difference on opinion among the many attendees of the ICCC was proof we were without a consistent message and therefore without credibility compared to the alarmists for whom AGW has become a religion and whose bible is the IPCC report and who worship at the alter of the climate models. In reality with an issue as complex as science, there are many different factors and the fact that we are not monolithic in our beliefs and tend to rely much more on actual data instead of models is proof that we are the real scientists. We are in fact more energized and motivated than ever before.
We also recognize the lack of coverage represents the media’s attempt not to derail any Cap-and-Trade (in reality Tax-and-Trade) legislation that the they and the environmental groups with their billions of dollars have pushed onto the table that has been eagerly adopted by politicians who always will embrace potential for more taxes and the excuse of being able to create green jobs and many corporation who see profit potential from selling green products. Just ask Arnold how well that environmental green agenda is working in California.
Yes we admit there may be thousands of new green jobs created but it will be at the expense of many millions of real jobs and the cost of thousands of dollars in hidden taxes and inflated energy costs for the average family. As Vaclav Klaus stated so well global warming is not a scientific theory it is a political ideology.
We all left the conference buoyed by what we accomplished in the last year, published in the journals and the progress made in the court of public opinion. Yet we all worry: Although we’ve won the science battle, unless we can enlist your support to speak out en masse to the decision makers, we could lose the political battle, thanks to the agenda of this administration, corrupt leaders in congress, and the media’s complicity. That will be tragic to the great citizens of the U.S. and the world turning a faltering recession into a serious worldwide long-lasting depression. See PDF here. See this compilation of stories about the meeting and recent related findings from Marc Morano here Also see this follow-up story from the Australian on how 90% of the scientists at the Japan Geoscience Union symposium last year, do not believe the IPCC report
By Sherwood, Keith and Craig Idso
In a paper published in the Proceedings of the National Academy of Sciences of the United States of America on 10 February 2009, Susan Solomon and three coauthors describe a climate modeling exercise that claims to show that “climate change that takes place due to increases in carbon dioxide concentration is largely irreversible for 1,000 years after emissions stop.” In the virtual world of computer-run climate models, such may well be so; but that need not be the case in the real world, where researchers still struggle to even understand—much less model—the suite of complex interactions that occur among the many physical, chemical and biological phenomena that combine to determine the planet’s multi-faceted climatic trajectory in response to a rise in the air’s CO2 content. Hence, there is a great need to carefully evaluate Solomon et al.’s claim.
The four scientists begin their analysis by setting forth three important criteria they feel should be met by the modeled climatic parameters they study: “(i) observed changes are already occurring and there is evidence for anthropogenic contributions to these changes, (ii) the phenomen[a] [are] based upon physical principles thought to be well understood, and (iii) projections are available and are broadly robust across models.” Consequently, we analyze these criteria to see how well they pertain to the first—and most basic—of the climatic phenomena Solomon et al. study, namely, atmospheric warming; for if there is a problem in this regard with respect to this phenomenon, there will be even greater problems with ancillary climatic phenomena that are driven by atmospheric warming.
Starting with the last of their three criteria, we note that the atmospheric warming studied by Solomon et al. is in absolute harmony with it, since that criterion precisely describes what the studied warming consists of: projections that “are available and are broadly robust across models.” Criterion number two, however, presents a bit of a problem; for just because projections are based upon physical principles that are thought to be well understood (and then only by some and not by others) does not mean that they really are well understood. And when one realizes there are non-modeled chemical and biological principles that may be equally as important as the physical principles employed in the models, one begins to realize just how tenuous the models’ projections might be. And if the model projections are extremely tenuous, any conclusions that might be drawn about the irreversibility of their projections will be extremely tenuous as well. And if true, this problem alone would render Solomon et al.’s conclusions of very little worth.
That this situation is likely to be the case, i.e., that the climate model projections analyzed by Solomon et al. are indeed extremely tenuous, is suggested by the results of the several “natural experiments” employed by Idso (1998) to quantitatively evaluate the response of earth’s near-surface air temperature to both short- and long-wave radiative perturbations caused by a number of well-defined, naturally-occurring, real-world phenomena. The set of results obtained from this exercise, as described by Idso, indicates that “a 300 to 600 ppm doubling of the atmosphere’s CO2 concentration could raise the planet’s mean surface air temperature by only about 0.4°C.” And he goes on to note that “even this modicum of warming may never be realized,” stating that “it could be negated by a number of planetary cooling forces that are intensified by warmer temperatures and by the strengthening of biological processes that are enhanced by the same rise in atmospheric CO2 concentration that drives the warming.”
Lastly, with respect to the first of Solomon et al.’s three criteria—their assumption that the modeled atmospheric warming is already occurring, and that there is evidence for anthropogenic (i.e., CO2-induced) contributions to it—the situation is much the same: real-world data provide little to no support for this contention.
In light of these several observations, it should be clear to all that Solomon et al.’s analyses of the irreversibility of climate-model-based atmospheric warming projections due to projected increases in the air’s CO2 content are utterly meaningless, because the projections themselves are meaningless, due to (1) their being based on overly-inflated values of the strength of the CO2 greenhouse effect, and (2) the long history of the non-correlation between historical climate change (both warming and cooling) and the concomitant history of the air’s CO2 content over the past two millennia. Read full reply here.
Climate Change: Driven by the Ocean not Human ActivityBy William M. Gray prepared for the Heartland ICCC
This paper discusses how the variation in the global ocean’s Meridional Overturning Circulation (MOC) resulting from changes in the Atlantic Thermohaline Circulation (THC) and deep water Surrounding Antarctica Subsidence (SAS) can be the primary cause of climate change. (MOC = THC + SAS) is the likely cause of most of the global warming that has been observed since the start of the industrial revolution (~1850) and for the more recent global warming that has occurred since the mid-1970s. Changes of the MOC since 1995 are hypothesized to have lead to the cessation of global warming since 1998 and to the beginning of a weak global cooling that has occurred since 2001. This weak cooling is projected to go on for the next couple of decades.
Recent GCM global warming scenarios assume that a slightly stronger hydrologic cycle (due to the increase in CO2) will cause additional upper-level tropospheric water vapor and cloudiness. Such vapor-cloudiness increases are assumed to allow the small initial warming due to increased CO2 to be unrealistically multiplied 2-4 or more times. This is where most of the global warming from the GCMs comes from - not the warming resulting from the CO2 increase by itself but the large extra warming due to the assumed increase of upper tropospheric water vapor and cloudiness. As CO2 increases, it does not follow that the net global upper-level water vapor and cloudiness will increase significantly. Observations of upper tropospheric water vapor over the last 3-4 decades from the National Centers for Environmental Prediction/National Center for Atmospheric Research (NCEP/NCAR) reanalysis data and the International Satellite Cloud Climatology Project (ISCCP) data show that upper tropospheric water vapor appears to undergo a small decrease while Outgoing Longwave Radiation (OLR) undergoes a small increase. This is opposite to what has been programmed into the GCMs. The predicted global warming due to a doubling of CO2 has been erroneously exaggerated by the GCMs due to this water vapor feedback.
CO2 increases without positive water vapor feedback could only have been responsible for about 0.1-0.2C of the 0.6-0.7C global mean surface temperature warming that has been observed since the early 20th century. Assuming a doubling of CO2 by the late 21st century (assuming no positive water vapor feedback), we should likely expect to see no more than about 0.3-0.5C global surface warming and certainly not the 2-5C warming that has been projected by the GCMs.
Full paper available here (under News). See comments from Richard Courtney on Bill’s paper here.
By Karen Harbert
We hear a lot today about generating green jobs along with green power and fuel. But as Congress just passed a stimulus package with tens of billions of dollars in spending for clean energy and infrastructure projects, we have to ask ourselves what are the odds these projects will go forward when existing projects are being stymied.
The fact is, our energy sector suffers from a lengthy, unpredictable, and needlessly complex regulatory maze that delays, if not halts entirely, construction of new energy infrastructure. Federal and state environmental statutes-such as the National Environmental Policy Act, state siting and permitting regulations, and a ‘build absolutely nothing anywhere near anything” mentality routinely are used to block construction and expansion of everything from transmission lines to power plants-and the economic activity and high-paying jobs that go with them.
And just because a project is “green” does not mean it fares any better. Indeed, it has become too easy for energy projects of any hue to be wrapped up in “green tape.” For instance, renewable energy projects and related infrastructure have recently been snagged, sued, or blocked in Idaho, New Hampshire, Kansas, New York, California, Maine, Pennsylvania, Texas, Massachusetts-home of the by-now infamous Cape Wind project-Virginia, and other states over environmental concerns. Moreover, the American Wind Energy Association reports that the review processes at many federal agencies are making it difficult to accommodate the growth of wind energy on federal lands.
Even if renewable projects can be permitted and built, many investors are still wary of these projects because it is so difficult to site the transmission lines needed to bring the electricity to consumers. Where these cross state lines, multiple jurisdictions become involved. One power company spent 13 years getting federal and state permits for a 90-mile interstate power line that took less than three years to build.
The stimulus legislation commits $11 billion to initiate the build out of a “smart grid” to support the expected growth of renewable power generation like wind, solar, and geothermal. But this money is largely unnecessary and does not address the actual obstacles to building new transmission lines...the siting process.
Under the Natural Gas Act, the Federal Energy Regulatory Commission has the authority, including eminent domain, to work with the states to site natural gas pipelines. Extending this authority to electricity transmission and other interstate energy infrastructure would simplify a time-consuming process and represent a huge step towards greater energy security.
Reforming NEPA is another way to get infrastructure projects moving ahead quickly. This Act is used by many groups to bring a swift halt to projects they oppose. Excluding actions that do not to have a significant impact on the environment and setting strict time limits for final decisions could lessen the opportunities for abuse and avoid indefinite project delays.
Also looming over the nation’s economic woes is the expectation that the Environmental Protection Agency will move ahead with regulating carbon dioxide emissions under the Clean Air Act, a law neither designed for nor suited to the task. EPA proposes that it can use its newly-discovered authorities under the Act to regulate carbon dioxide emissions from cars, trucks, planes, trains, boats, office buildings, refineries, pipelines, boilers, landfills, manufacturing plants, tractors, lawnmowers, motorcycles, schools, hospitals, breweries, bakeries, farms, and countless other sources large and small.
These sweeping new rules would have a chilling-indeed, freezing-effect on economic activity and derail many of the energy and other infrastructure projects the stimulus bill was crafted to facilitate, dealing a devastating blow to the U.S. economy at exactly the wrong time. A recent Heritage Foundation analysis found that a regulatory program of the magnitude contemplated by EPA would raise energy prices, cost an average $339 billion each year through 2029, and wipe out up to three million manufacturing jobs. We need a stimulus for businesses and workers, not activists and lawyers. Read more here.
Karen Harbert is President and CEO of the Institute for 21st Century Energy, an affiliate of the U.S. Chamber of Commerce