


Joseph S. D’Aleo, Jr., CCM, AMS Fellow
My whole career has focused on weather and climate attribution - my Master’s thesis was on the role of diabatic heating in explosive development (bombogenesis) in east coast storms. I taught my students how to think not what to think. We focused on the natural factors that causes the patterns, changes and extremes we see. 200 young men and women went on to make a significant contribution to weather forecasting, broadcasting and other related careers. Over 20 worked with me at The Weather Channel.
Decades later, after giving major addresses at AMS broadcast conferences (and chairing one), at NWS/BHO meetings, I was made chair of the AMS Weather Analysis and Forecasting committee and the first private sector meteorologist chosen by their peers to be on the AMS council. In my first council meeting in Boston, in the cocktail hour, I was attacked in a conversation stopping shouting match by a biologist Paul Higgins, now Director of the American Meteorological Society’s Policy Program for not bowing down to ‘the accepted science’.
On the committee where I hoped push ideas to increase the value of the society to meteorologists but had instead to push back on the AMS increasingly one-sided position on climate change and top 4 goal of climate policy advocacy. Early on, we discussed a statement on Climate change which was written in part by Lawrence Livermore Lab that ignored natural factors. The AMS posted the statements on the back pages of AMS site for feedback and usually got by with little blowback. I brought attention to it and encouraged comments back in the community and submitted my own 44 page comment challenging it point by point. Despite this, no changes were made though they went forced to go through the motions much as the IPCC did for the Summary for Policymakers which wrote the summary before the scientist combined their findings and conclusions - dismissing any scientist challenges base on their favorite paper, predominance of papers or the latest paper.
My challenges pushed me to establish Icecap which we launched with a booth at the AMS Annual meeting. Kevin Trenbeth pointed me out to the late Pete Leavitt (well known meteorologist and closet skeptic and a good friend) who was leaving our booth and complained “do you believe the AMS voted in a skeptic on the council - how do we let that happen?”
When Lou Dobbs had a show on CNN, I was asked to answer 7 questions on climate on videotape. A cameraman and crew came to my home and asked the questions to which I responded in crisp sound bites with pertinent facts. The producer on their end was not pleased and as my mic was being removed told them to put it back on and asked me a question that made no sense. My answer was less crisp and the producer ensured that is what was used. The morning and daytime meteorologists on CNN played my other questions and answers the next morning and it appears some actually lost their jobs as management were angered.
I gave a talk at the St. Johnsbury Museum in Vermont with a large crowd including some coming to challenge a doubter. I actually turned the crowd around and some became skeptics and one even started a skeptic organization in Vermont. There were attacks on me in the media claiming I must be dirty with coal.
Years later a women’s group in the area wanted a lively debate at that Museum but I was not available and I asked two of my colleagues to attend but their warmist choice refused to come if skeptics were to be included. The museum gave way and they had a lively one sided debate.
I was invited similarly to debate by Vermont Public Radio, but again their warmist choice, a cloud physicist who considered himself state climatologist and bragged about the tens of millions of dollars he has made from grants after coming to the US, refused to participate if I was included and my invite was withdrawn. I listened to the show and his presentation was full of attacks on Fred Singer and others claiming bad science and questionable funding.
I was always very impressed by the state climatologists and many became friends - over 75% were skeptics. I watched as the universities who appoint the scientist to that role, removed 50% of them and in many cases, where they could removing them from their role at the universities or limiting what they can teach. I could detail many examples. I also have stories that would curl your hair about how honest scientists were treated for daring to voice a different science data based opinion.
20 Climate Alarmists, most sitting on tens of millions of dollars in funding threatened to use RICO against skeptics who they claimed were doing so because they are getting major funding from big oil. Fortunately they were beaten in court.
I used to do stories in the local weekly here in southern NH. I got many thumbs up but an occasional complaint about why anyone would doubt the science and politicians. A few years ago, a hard hitting story got a nasty editorial from a California transplant claiming I was lying because it was well known I was enriched by big oil. I responded back strongly, and got a second supportive editorial from a former student who lived in the area. But he came back again with more false claims, but before I could respond back, the newspaper shut down. Cancel culture in action.
Please help us fight back. The site has 9000 posts and 162 million page views and the search capability that finds past information on most any climate topic. For the posts, I am most of the time now a one man band. The site requires a secure hosting which costs almost $500/year. A donation (secure PAYPAL button on the left column or here) would help me keep it going. Thanks.
happy New Year - See Unsung Zeroes: The Top 10 Under-Reported Climate Flops of 2021 by Steve Milloy here.
The year 2021 may go down in history as the year that foretold the end of the climate idiocy movement - although the movement is unlikely to take the hint. This year witnessed the follies, failures and lies of climate idiocy laid bare for all to see - that is, if the media had actually reported them.
So here are the 10 biggest failures of the climate movement in 2021. The only reason the climate movement survives past these flops is because the mainstream media keeps it afloat by failing to honestly report the news.
-----------
The Polar Bear Hype
Environmental NGO WWF Finland has apologized for using a retouched photo of a polar bear and cub standing on a tiny ice floe, apparently adrift in an ocean.
The organization’s communications head, Anne Brax, also defended the use of the image as an advertising tool commonly used as shorthand for climate change and its impact on arctic regions, rather than as a news item.
Polar bear ads during Gore’s campaign made them a symbol of climate change and a great fund raiser. The WWF has a new campaign claiming they are disappearing, a victim of man’s use of fossil fuel and the disappearance of their icy homes.
The photo was used as part of an anti-climate change fundraising campaign aimed at students participating in Finland’s annual “taksvarkki” or “day’s work” program, where middle schoolers work for a day to collect money for worthy causes.
As FEE reported in their fact check
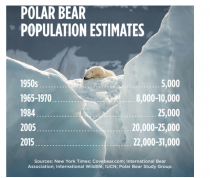
New estimates from the International Union for Conservation of Nature show a mid-point estimate of 26,500 (range: 22,000 to 31,000) in 2015. In The State of the Polar Report 2018, zoologist Susan J. Crockford says updates to IUCN data put the new global mid-point estimate at more than 30,000.
Even accepting the lower figure, the estimate is the highest since the polar bear became internationally protected in 1973.
The whole arctic and antarctic and Greenland attention has been a lucrative job for university environmental groups. The media has run with the scary tales and their fact checks are merely relying on the reports bought and paid for and written by indoctrinated so-called journalists ad media groups. Many honest fact checks are cancelled and blocked.
The thickness of the arctic ice and how much it shrinks in the warmer season depends on the multidecadal warm and cold ocean cycles in both oceans. When the oceans are warm, the currents carry under the floating ice and thin it from beneath. Arctic temperatures vary with the ice cover.
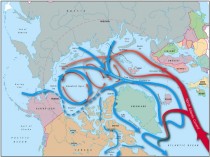
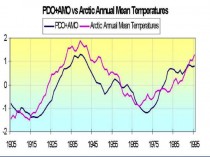
See how they both vary with the ATlantic basin which is the greatest contributor as the Pacific has only the Bering Strait as a channel for the warm water to enter.
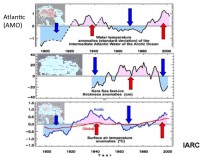
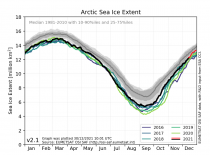
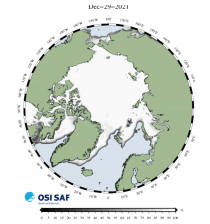
See how the ice cycle the last decade has been slowly recovering from the warmest ocean phases.
2021 like 2020 has been a dark period and the holiday is still not the same. When politics gets involved, it never is.
We can look back to past happier memories in more normal times. One holiday favorite was the old movie from 1946, It’s a Wonderful Life, a story of the ups and downs in a man and families life.
It’s a Wonderful Life and story
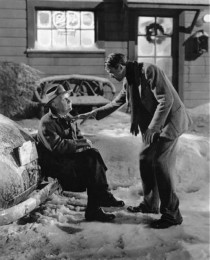
Like many of you, one of the films I like to watch seasonally is Its a Wonderful Life, from Frank Capra who produced many classic movies. The snow scenes look like upstate New York or New England in winter.

It may surprise you that the Bedford Falls set, according to Life.com: “It covered four acres of the RKO ranch [in Encino, Calif.] and included 75 stores and buildings, a tree-lined center parkway with 20 fully grown oak trees, a factory district and residential areas. Main Street was 300 yards long, or three full-length city blocks.”
The snow was fake snow. Frank Capra - who trained as an engineer - and special effects supervisor Russell Shearman engineered a new type of artificial snow for the film. At the time, painted cornflakes were the most common form of fake snow, but they posed a bit of an audio problem for Capra. So he and Shearman opted to mix foamite (the stuff you find in fire extinguishers) with sugar and water to create a less noisy option.
Here were the fans that blew the snow over the set.
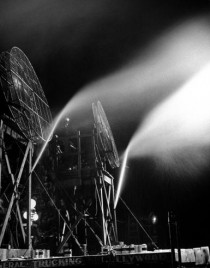
The film was done in the the summer I was born and filming at times occurred during a heat wave, which forced them to shut down for days. Though they were romping in what looked like snow, they were perspiring.

Though not popular in its day, the movie became a holiday favorite on TV and ranked number one on its list of the most inspirational American films of all time.
One more note: when I was watching It’s a Wonderful Life and saw someone playing the rent collector for Potter (Lionel Barrymore) who looked very familiar.
It was Charles Lane - here was a photo of him.

Charles Lane was an amazing man who appeared in 250 movies for over 80 years and lived to 102 years of age!!!! He is very much the actor extraordinaire. See the incredible list here.
He looked familiar. It occurred to me, he was the spitting image of John Podesta, Clinton and Obama advisor.

By Robert Bryce
Forbes Energy
About 115 people were burned alive after a fuel tanker caught fire in Sierra Leone.
The defining inequality in the world today is the staggering disparity between the energy rich and the energy poor. That disparity came into gruesome focus yet again last week in Sierra Leone.
On November 5, while several thousand policymakers, researchers, and climate activists at the COP 26 meeting in Glasgow were trying to forge agreements on how to slash consumption of hydrocarbons, about 115 people were burned alive while trying to collect gasoline from a damaged fuel tanker truck near Sierra Leone’s capital city of Freetown.
According to the Washington Post, “People had crowded around the crash to collect leaking fuel when the tanker blew up, witnesses said. Anything spilled was viewed as wasteful in a community where many struggled to afford gas.” One witness described the scene, “dead bodies all around...There are people screaming, people burning alive.”
One witness said, “The firefighters came, but there was nothing they could do...The blaze was so much. There was nothing they could do to contain the inferno.”
Accidents like the one in Freetown are chillingly common. Since 2019, more than 400 people have died in accidents similar to the one in Freetown. The circumstances are almost always the same: a fuel tanker truck gets involved in an accident. Large crowds of desperate people assemble, excited about the prospect of free fuel. Then, due to an errant spark or a careless cigarette, the fuel is ignited and dozens of people are immolated.
These deaths - all of them - are deaths of extreme energy poverty. While energy elites insist we need to drastically reduce our use of coal, oil and natural gas, hundreds of millions of people are living in grinding energy poverty and they will do whatever they have to do to get the energy they need.
The disparities in global energy consumption are gobsmacking. Today, about 3.3 billion people are living in places where per-capita electricity use is less than what’s used by an average American kitchen refrigerator. All over the developing world, people die premature deaths due to indoor air pollution caused by the use of poor-quality cooking fuels.
The average African consumes about 15 times less energy than the average resident of North America. The situation in Sierra Leone, a small country on Africa’s west coast, is even more dire. Electricity use in Sierra Leone is so low that the World Bank doesn’t publish data for it. By my calculations, based on the country’s population of about 8 million, the average resident of the country uses less than 40 kilowatt-hours of electricity per year. That is not a misprint. For comparison, the average resident of the U.S. consumes about 13,000 kilowatt-hours of juice per year, or about 300 times as much.
I’ve been collecting stories about death-by-immolation among the energy destitute. Here are a few of them.
In January 2019, in Hidalgo, Mexico, about 85 people were burned alive while trying to collect gasoline from a pipeline that had been illegally tapped. The Associated Press report on the accident was somber and elegiac. “The lure of free fuel was irresistible for many: They came like moths to a flame, parking vehicles on a nearby road.”
The report continued, “This particular section of pipeline had come back into service after being offline for nearly four weeks when somebody punctured the line again....Hundreds showed up at the spigot, carrying plastic jugs and covering their faces with bandanas. A few threw rocks and swung sticks at soldiers who tried to shoo them away. Some fuel collectors brought their children along...What ignited the gasoline, no one seems to know. After the explosion, soldiers formed a perimeter around an area the size of a soccer field where townspeople were incinerated by the fireball, reduced to clumps of ash and bones.”
In May 2019, in Niger, 76 people died after an overturned tanker truck exploded as crowds tried to collect spilled fuel.
In July 2019, in Nigeria, a similar accident killed at least 45. As reported by the BBC: “People had gathered around the crashed tanker after the crash, with some attempting to salvage fuel.”
In August 2019, about 64 people were killed in a similar accident in Tanzania. Per a news report, “People were trying to recover fuel from the vehicle, which had overturned on a major road, when it exploded.”
In July of this year, in Kenya, at least 13 people were killed in yet another accident. “People had rushed to the scene with jerrycans to siphon off fuel from the overturned tanker before it exploded.”
About a month later, in Lebanon, which is in the midst of an ongoing energy crisis, at least 28 people died when a fuel tank exploded. According to Reuters, the Lebanese army “had seized a fuel storage tank hidden by black marketeers and was handing out gasoline to residents when the explosion occurred.”
On Wednesday, at the COP 26 confab in Glasgow, a draft agreement was being circulated that called for “just transitions to net-zero emissions.” But the rhetoric doesn’t match the reality. Amid the never-ending talk about net-zero and bans on hydrocarbons, it’s essential to remember those 400 dead, those mothers, fathers, brothers, and sisters in Sierra Leone, in Lebanon, Tanzania, Kenya, and elsewhere who were burned alive.
Those people didn’t die because of climate change. They died trying to get the fuel they need to live.
Robert Bryce is an author, journalist, filmmaker, and the host of the Power Hungry Podcast. He has been writing about energy, power, innovation, and politics for more than three decades. Bryce has authored six books in which he has covered Enron’s bankruptcy, corn ethanol, digital drilling rigs, renewables, batteries, nuclear energy, and the future of the electric grid. His latest book, A Question of Power: Electricity and the Wealth of Nations, was published in 2020. His articles have appeared in numerous publications including the Wall Street Journal, New York Times, New York Post, and Sydney Morning Herald. His feature-length documentary, Juice: How Electricity Explains the World, is available on iTunes, Amazon Prime, and myriad other streaming services. He lives in Austin, Texas, with his wife, Lorin, who is an art teacher, photographer, and master potter. Follow Bryce on Twitter: @pwrhungry.
Energy prices are rising rapidly as the administration is pushing a green agenda with a ban on pipelines and drilling. Energy prices have doubled the last year.

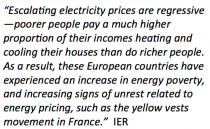
This has caused inflation to explode. Energy is the lifeblood for the economy. You can’t move to renewables by just blocking fossil fuel to appease the climate activists. The effects as we have seen in Europe and Australia, is soaring energy prices which increases the cost of manufacturing and transportation and the costs of all goods and services.
White House chief of staff Ron Klain endorsed former Obama administration economist Jason Furman’s claim that the country’s inflation, supply chain, and other economic problems only affect a small part of the U.S. population. Furman, the chairman of former President Barack Obama’s Council of Economic Advisers and an economics professor at Harvard University, tweeted Wednesday night that “most of the economic problems we’re facing .... are high class problems.”
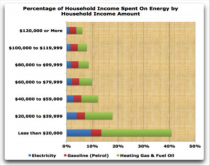
But after we had achieved energy independence and low energy prices, going down the path that the early adopters of the extreme green agenda followed, would lead to lower income families and retirees spending over 40% of their income on energy.
They are seriously suffering now as energy prices have doubled and the costs of all goods and services are skyrocketing. And the worst is yet to come if the congress succeeds with a program the start of decarbonization efforts. It is so misguided and so 2021. Energy Secretary Jennifer Granholm laughed at a question about boosting America’s domestic oil production, calling it “hilarious.” Bloomberg host Tom Keene noted America’s rising gas prices and asked the energy secretary, “What is the Granholm plan to increase oil production in America?” Granholm immediately began laughing. “That is hilarious,” she said. “Would that I had the magic wand on this. Secretary Granholm appeared in 2018 video singing about end of gasoline, fossil fuels. But it is not a laughing matter,
CBN News reported October 21, “Experts are forecasting that the cost for heating oil could rise more than 40%, natural gas could shoot up 30%, propane, 54% and electricity, 6%. If it’s a bad winter, prices could go even higher, with propane costs doubling.”
And our forecasts for December and the winter for the U.S. and Eurasia is for bitter cold periods, which means blackouts and brownouts and like Texas found last February, would lead to many deaths and pain.

Cornwall Alliance Board Member Dr. David Black, Director of 2nd Vote Advisers, an investment firm, and Founder of 2ndVote.com, which rates corporations on the morality of their charitable giving, said in response to the news:
The attack on fossil fuels will lead to increased costs for all consumer items, since products must be transported to brick-and-mortar stores or delivered via FedEx, Amazon, et al., and because petroleum extracts are used as an ingredient in so many commercial products. Sadly, the lowest on the economic ladder will be harmed the most.
Historically high home heating costs have resulted in the poor trying to use kerosene space heaters, home gas ovens, or other devices to heat their homes, often with the tragedy of house fires or carbon monoxide related deaths.
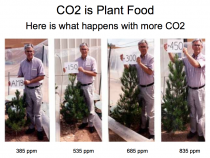
And all for naught. CO2 is a beneficial gas - the gas of life - ask your plants.
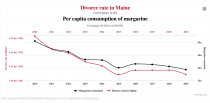
Any apparent correlation with the rising phase of the 60 year cycle is coincidental. Many such false correlations can be found in real life.
Chamber of Commerce Global Energy Institute Energy Accountability Report. “...elected official have pledged to ban the very technology that has enabled this boom-hydraulic fracturing (HF), or fracking. This raises an important question: what would happen to American jobs and the economy if hydraulic fracturing was banned? In this report, the Global Energy Institute has undertaken the modeling and analysis to answer that question. Our analysis shows that if such a ban were imposed in 2021, by 2025 it would eliminate 19 million jobs and reduce U.S. Gross Domestic Product (GDP) by $7.1 trillion. Job losses in major energy producing states would be immediate and severe; in Texas alone, more than three million jobs would be lost. Tax revenue at the local, state, and federal levels would decline by nearly a combined $1.9 trillion, as the ban cuts off a critical source of funding for schools, first responders, infrastructure, and other critical public services.
Energy prices would also skyrocket under a fracking ban. Natural gas prices would leap by 324 percent, causing household energy bills to more than quadruple. By 2025, motorists would pay twice as much at the pump for gasoline as oil prices spike to $130 per barrel. The report also details the impacts that a ban would have on seven states, including five that are major energy producers - Colorado, New Mexico, Ohio, Pennsylvania, and Texas. Not surprisingly, the results would devastate each of those energy states’ economies. But a fracking ban’s impacts would be felt well beyond energy producing regions, so the report also examines the impacts of a ban on the economies of Michigan and Wisconsin, which are large manufacturing states. There, too, the results are significant. For example, cost-of-living impacts to residential consumers in Wisconsin and Michigan would grow by approximately $4,700 and $5,100 respectively between 2021 and 2025.
Should the radical green agenda be approved, these numbers would more than likely double. Now if you factor in the risk if extreme cold outbreaks in the North America and Europe, which means blackouts and brownouts and as was previewed in Texas last February when sub zero cold and heavy snow invaded and the wind turbines froze in place throwing millions into the dark. 210 died. Deaths on the U.S. could be in the thousands this winter when energy sources are being blocked.

How did we get to the point when our government get to the point where energy independence and record low unemployment in a booming economy is rejected. This was predicted over half a century ago and repeated over the years - it is all about power (political not electrical) and control.
In his Farewell address to the nation Dwight Eisenhower in the speech remembered for comments on the military industrial complex also had a lot to say about politically driven science: “Partly because of the huge costs involved, a government contract becomes virtually a substitute for intellectual curiosity. For every old blackboard there are now hundreds of new electronic computers. The prospect of domination of the nation’s scholars by federal employment, project allocations, and the power of money is ever present - and is gravely to be regarded. Yet in holding scientific research and discovery in respect, as we should, we must also be alert to the equal and opposite danger that public policy could itself become the captive of a scientific-technological elite.”
Maurice Strong , UN Executive Director in 1970s saw CO2 as a tool to Proselytize for One World Government. “...Isn’t the only hope for the planet that the industrial civilization collapse...isn’t it our job to bring that about”
“In searching for a new enemy to unite us, we came up with the idea that pollution, the threat of global warming...would fit the bill...It does not matter if this common enemy is “a real one or...one invented for the purpose.” Club of Rome advisor to the UN “First Global Revolution” 1991
“We have got to ride the global warming issue. Even if the theory of global warming is wrong, we will be doing the right thing in terms of economic policy and environmental policy.” Timothy Wirth, U.S. Senator, president of the United Nation’s Foundation
Dixie Lee Ray, Washington State Governor wrote: “The objective, clearly enunciated by the leaders of UN, is to bring about a change in the present system of independent nations. The future is to be World Government with central planning by the United Nations. Fear of environmental crises- whether real or not - is expected to lead to - compliance.”
“No matter if the science of global warming is all phony ... climate change provides the greatest opportunity to bring about justice and equality in the world.” - Christine Stewart, former Canadian Minister of the Environment
UN Climate Chief Christine Figueres said “Our aim is not to save the world from ecological calamity but to change the global economic system (destroy capitalism).”
UN IPCC Lead Author Ottmar Edenhofer in November 2010. “One has to free oneself from the illusion that international climate policy is environmental policy.” Instead, climate change policy is about how “we redistribute de facto the world’s wealth.”
Rep. Alexandria Ocasio Cortez’s chief of staff recently admitted that the Green New Deal was not conceived as an effort to deal with climate change but instead a “how-do-you-change-the-entire economy thing”...nothing more than a thinly veiled socialist takeover of the U.S. economy. “ “The interesting thing about the Green New Deal is it wasn’t originally a climate thing at al,” Saikat Chakrabarti said in May.
“The whole aim of practical politics is to keep the populace alarmed (and hence clamorous to be led to safety) by menacing it with an endless series of hobgoblins, all of them imaginary” and “The urge to save humanity is almost always a false front for the urge to rule.” H.L. Mencken
Please help us spread the word. The markets love the idea of government money but history has shown this path has always led to misery and poverty except for the elitists and an economic freefall. Europe and Asia are fearing a cold winter with given the state of the energy systems - renewable energy has proven unreliable for base load with blackouts and brownouts. Remember 210 deaths in Texas occurred with the subzero cold and snow last February. Devastating freezes - worst in decades occurred in Brazil this past winter.
--------
Climate NEXUS fact checks the 2000 National Climate Assessment
And see the miserable model failures that are being used to impoverish hard working Americans to keep the warmists money coming in and the politicians in control.
For decades there has been intermittent attention paid to the claim that the Urban Heat Island creates a warming trend as formerly rural spots are paved over, trapping heat, which then boosts the warming that inevitably gets blamed on greenhouse gases. Including in the claims we discussed last week that the U.S. just had its hottest summer ever. A particular indicator that the UHI is behind claims of unprecedented heat is if nighttime lows are rising faster than daytime highs, incidentally decreasing rather than increasing the swing in temperature, which is very much what you’d expect if human structures including roads were trapping the sun’s heat during the day then releasing it at night.
A July news story out of San Diego noted this effect, saying “Last month was the hottest June ever recorded in North America, but climate scientists say the most dramatic temperature trend isn’t happening during the day; It’s happening at night. June saw three times as many nighttime records as any June on record, according to data from the National Oceanic and Atmospheric Administration.” And NOAA said, of August at least, that “Much of the above-average warmth can be attributed to warm overnight temperatures.” But what they didn’t point out is that’s evidence of data contamination not climate change.
Another indication that the Urban Heat Island is creating the illusion of unprecedented warming is that the US Climate Reference Network (USCRN), a network of U.S. stations specifically created to exclude measuring points vulnerable to UHI, shows no warming from 2005-2019. In which case we’re not seeing the fever peaking and killing the patient. A classic effort to debunk this finding not only used the adjusted NOAA/NASA data, but said “Even if the US experienced a flat temperature change for 14 years, this would not prove that global warming isn’t occurring. The US only covers a small portion of the planet, and a 14-year period is too short to reliably indicate long-term trends over short-term variability.” But that never stopped them from pointing to US heat records, when they happen, as proof of impending global destruction. And the dodge raises the ever-pertinent question: If this evidence does not persuade you that the theory is open to debate, what if anything might do so? The fact that Scandinavia seems to show no warming in July in the 21st century? Or that USCRN showed this February the coldest in the US in 30 years? But cold is just weather.
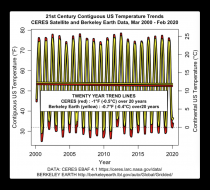
Or is it? Back in April Willis Eschenbach did some work on data from Berkeley Earth and CERES satellites and found that the contiguous U.S. showed a cooling trend from March 2000 through February 2020. And then he made a very relevant point about the scale of the change: “Now, before anyone starts yelling ‘But that’s just the contiguous US, not the globe!’, yes, I know that. I’m just saying that if you think the US temperature has gone up over the 21st century, you’re wrong. The US has cooled over that time. And this reveals a deep truth, which is that if it were not for accurate thermometers, hundreds and hundreds of US surface temperature station sites, and satellites, we’d never know if the US had warmed or cooled over the last two decades… the changes are far too small and too widespread for our human senses to register.”
This observation recalls a remark we quoted in our 2020 “Catastrophe Question” video from Swedish climatologist Lennart Bengtsson, who observed a few years ago that “The warming we have had over the last 100 years is so small that if we didn’t have meteorologists and climatologists to measure it we wouldn’t have noticed it at all.” And Judith Curry recently made a very pertinent observation on this score, quoting a story from Yahoo! News that “Parts of the US are getting dangerously hot. Yet Americans are moving the wrong way” then adding “Hmmm… somebody’s drawing the wrong conclusions?”
The general IPCC line is that temperatures have gone up 1.07C since pre-industrial times, and if they rise by more than another 0.43C, the Paris target, we’re all going to be in trouble. Not that we already are, as newspapers claim. That we will be. But frankly less than half a degree C, three-quarters of a degree F, is nothing. Nothing you could notice, nothing your crops could notice, nothing the planet could notice. And nothing we could measure. (Oddly the latest IPCC report claims a total of 1.07C from 1850-1900 to 2010-2019 on p. 38 of the Summary for Policymakers, after on p. 6 calling it the best estimate of “total human-caused global surface temperature increase from 1850-1900 to 2010-2019” so they don’t seem very clear on whether there has been any net natural warming at all since the Crimean War.)
Despite even the IPCC’s caution about extreme weather, NBC roars ahead: “Global warming is making heat waves and other extreme weather events both more likely and more severe, and climate scientists have said conditions this summer offer a glimpse of what could become more common in the future.” But there’s a big difference between becoming more common in the future and having become more common in the present. And as we have pointed out before, NBC’s main science reporter has an MA in Journalism and a BA in Criminology. Who these “climate scientists” are and what they said and why is not included in her stories as news with specific citations. It is just ominous background music.
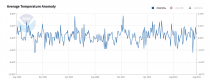
See the Climate Reference Network plot of Monthly Average US temperatures since inception in 2005 and the constructed data from the US climate divisions back to 1998’s super El Nino.
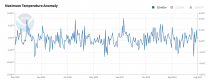
And the average monthly maximum temperatures for the US climate divisions.
---------
Addendum from Joseph D’Aleo
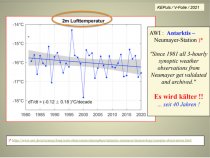
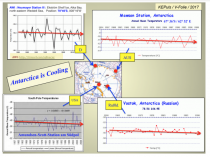
The warming as many have show in mostly in the elevated nighttime lows in urban areas ad airports which hold their heat. Record highs have not been increasing despite the best efforts of the zealot Tom Peterson who left NCDC to help lead the WMO team on trying to find evidence of increasing record heat. In Antarctica they found a station on the tip of the Antarctic Peninsular (an active volcanic region surface and deep sea) and subject to the foehn wind when the wind blows downslope. But the peninsular is not warming nor the ice diminishing. In fact the South pole had its coldest winter on record back to 1957 (see here). See images from Klaus-Eckhart Puls (prominent German met, who runs “EIKE” (European Info Center for Climate & Economics) - HT Hans
Climate Change Committee misled Parliament about the cost of Net Zero
Date: 26/09/21Press Release, Global Warming Policy Forum
Claims of low cost were based on “grossly misleading” assumptions
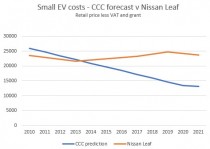
* Highly optimistic assumptions about EV costs have been called into question by the actual development of EV costs since the CCC advised Parliament
* Committee on Climate Change spreadsheets only revealed after 2 year freedom of information campaign
* Costs could be 60,000 per household higher than the CCC estimates that MPs used when they were considering Net Zero legislation
London, 26 September - The Sunday Telegraph reports today that Parliament was misled into supporting Net Zero plans to decarbonise the economy.
The Climate Change Committee (CCC) told MPs that British households and businesses would face only a modest cost for reaching Net Zero emissions in 2050, but analysis of their financial models by the Global Warming Policy Forum (GWPF) shows that key assumptions were not credible even at the time the report was published.
The revelations come after the CCC spent two years and tens of thousands of pounds resisting attempts to have the Net Zero model spreadsheets released under Freedom of Information legislation. The Information Tribunal finally forced their disclosure in August this year.
The first results of the GWPF’s analysis focus on the Transport sector costings. The work reveals that the CCC’s claims that decarbonisation could be achieved at no net cost was based on wildly optimistic and sometimes bizarre assumptions.
According to GWPF Deputy Director Andrew Montford:
When they published their report in 2019, the CCC said that small electric car prices would have fallen to around 13,000 pounds by 2021. However, the CCC’s figures for 2019 EV prices were wildly wrong at the time they published their report, so its’ unsuprising tht the current cost of a small electric car is double, or even triple their estimate.”
If instead of the CCC’s optimistic assumptions, we project a realistic decline in EV costs, this adds a staggering 1.8 trillion pounds to the cost of Net Zero, or 60,000 pounds ($82,000) per household, and altogether wipes out the claimed net benefit of decarbonising the transport sector.
Dr Benny Peiser, GWPF director said:
“Lord Deben, chairman of the Climate Change Committee, told Parliament the Net Zero report was ‘the most seriously presented, costed effort’ - but it is now clear that the costings were incomplete, biased, and grossly misleading.
Parliament was, in essence, misled and Net Zero was badly mis-sold. The public is now facing the price for that deception.”
In a striking new development, the Sunday Telegraph is also reporting that they were initially given misleading information by the CCC, in an attempt to cover up the error and prevent publication. Only repeated requests for clarification revealed the truth.
Dr Peiser said that the CCC’s attempts to whitewash the matter meant that this supposedly independent advisor to government could no longer be seen as a credible source:
The CCC spent years trying to hide their absurd assumptions, and even after the Information Tribunal compelled them to release their spreadsheets, they tried to throw the Sunday Telegraph off the scent. I don’t think Parliament or the public can ever trust them again.”
Craig Mackinlay MP, chairman of the parliamentary Net Zero Scrutiny Group, told the Sunday Telegraph that the findings were “scandalous” and that Parliament had been “misled”.
The GWPF’s analysis of the CCC’s costings is ongoing, and further announcements are expected in the coming weeks.
Detailed findings
Cost of electric vehicles
The CCC’s model assumes that EV costs will fall by 36-59% between 2010 and 2050, depending on category. The price of small EVs is assumed to fall from 26,000 to 11,000 pounds. Actual 2021 small EV prices (see graph below) are typically around double the figures used by the CCC in the Net Zero Report.
It must have been obvious to the CCC that their assumed trajectory was wrong at the time the Net Zero report was published. The CCC’s 2019 figure was 14,666, around half the level seen in the marketplace at that time [1].
This can be illustrated by the history of the Nissan Leaf, the archetypal small EV.
The extremely optimistic assumptions made by the CCC about Electric Vehicles are crucially important to their overall cost estimates. Simply changing the shape of the curve to a straight line decline between 2019 and 2050, for all categories of EV, adds 0.7 trillion to the cost of Net Zero.
With batteries now representing only around 25% of the consumer cost of an EV, future cost declines - if any - are likely to be incremental rather than revolutionary. Indeed, there is a significant upward cost pressures on EV prices due to increasing costs for energy and critical minerals.
Reducing the rate of decline to 3% per decade more than doubles the cost of Net Zero, amounting to a bill of 60,000 pounds per household. Holding EV prices steady would increase the bill by 2.1 trillion, or 75,000 pounds (over $200,000) per household.
[1] All costs are in 2018 pounds, ex-VAT and before deduction of any grants.
----------
this is UK, The GND of AOC/Sanders and Kerry has a goal or following the UK. They may be able to afford this - but can you.
Joseph DAleo, CCM
Link
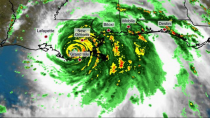
Ida came ashore in Louisiana as a strong CAT4 hurricane.
Enlarged
It produced major flooding and wind damage and widespread lengthy power outages in Louisiana where at least 6 died. Ida then turned northeast and then east. After coming ashore and moved north it triggered 3 tornadoes in Alabama and 1 in Virginia. On the way out to sea, the storm spun up 8 more tornadoes in PA and NJ to MD late Wednesday as many hurricane landfalls often do. Beulah in 1967 produced 115 tornadoes over a large area, ranging from the Texas coastal communities to South Central and Southeast Texas.
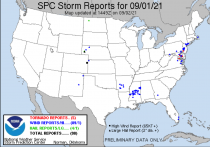
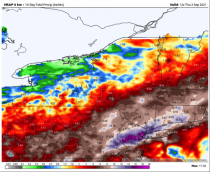
The storm brought torrential rains to the northeast centered on areas from southeastern Pennsylvania across northern New Jersey, the New York City Metro areas into southern Connecticut. Coming just days after record rains from Henri, 7 to 10 inches fell in a short period, producing catastrophic urban flooding.
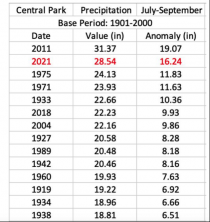
7.13 inches fell in Central Park (including 3.1 inches within one hour which shattered the record set only last week, when 1.94 inches of rain fell in one hour during Tropical Storm Henri). The National Weather Service issued a flash flood emergency in New York City for the first time ever and at least 9 fatalities have been recorded in the northeast. Most of these fatalities resulted from people caught in illegal basement apartments that flooded. More fatalities may have occurred as Ida exited than where and when it came ashore.
This moved 2021 into second place behind only 2011 (Irene) for July to September rainfall with a total of 28.54 inches...with 4 weeks to go.
Enlarged
More fatalities may have occurred as Ida exited than where and when it came ashore. Coming after a record wet July in places and a wet August with the help of Henri, the soil moisture contributed to the rainfall.
Enlarged
CAMILLE 1969
In August 1969, Camille, a CAT5 storm came ashore a little further east In MS and had a one-two punch. Camille was the second of three Category 5 hurricanes to make landfall during the 20th Century, which it did near the mouth of the Mississippi on the night of August 19th, resulting in catastrophic damage. Camille made landfall with a pressure of 900 mb, estimated sustained winds of 200 mph, and a peak storm surge of 24 feet.
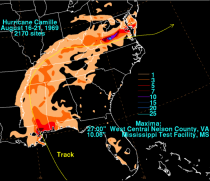
Enlarged
Camille was the strongest landfalling tropical cyclone recorded worldwide, and one of only four tropical cyclones worldwide ever to achieve wind speeds of 190 mph. The hurricane flattened nearly everything along the coast of the Mississippi, and caused additional flooding and deaths inland before exiting in Virginia. In total, Camille killed 259 people and caused $1.42 billion (1969 USD) in damages.
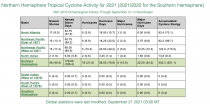
Is 2021 going to be a record year for hurricanes? No, in fact, despite an active Atlantic in 2020 for storms and Ida this season, for the hemisphere, we are for the second year is a row, well below the normal.
The ACE (Accumulated Cyclone Energy) Index is a metric used to assess seasonal and regional trends. Though we are running above normal for the number of named storms in the Atlantic, the east Pacific is near normal and the western Pacific, usually the busiest tropical season region is running half the normal pace. 2020 was similar with a record number of Atlantic storms but the average ACE per storms was reportedly the lowest on record again with a quiet Pacific.
Enlarged
The long-term linear trend in the number and intensity of global hurricane activity has remained flat or even declined.
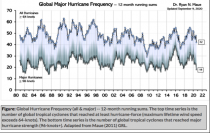
The late, great Dr. Bill Gray from Colorado State taught us hurricane activity does vary year-to-year and over longer periods as short-term ocean cycles like El Nino/La Nina and multi-decadal cycles in the Pacific (PDO) and Atlantic (AMO) ocean temperature regimes which favored changes in activity levels and some basins (West Pacific, East/Central Pacific or Atlantic) over others.
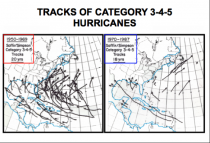
Credible data show this trend pattern is true despite much better open ocean detection than before the 1960s when many short-lived storms at sea would have been missed as there were no satellites, no aircraft reconnaissance, no radar, no buoys and no automated weather stations back then. See NOAA June Study here.
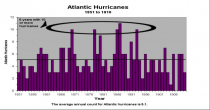
Landfall counts are more reliable. This data actually shows that the number of U.S. landfalling hurricanes and major hurricanes has been on the decline since the late 1800s. This past decade was the quietest one for landfalling hurricanes (behind the 1970s) and major hurricanes (behind only the 1860s).
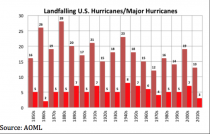
However, the impacts on the United States has varied considerably with time, with very active seasons giving way to long lulls during which the public forgets the lessons from past storms and the risks of settling in vulnerable areas. The regions targeted vary too.
Great Colonial hurricanes in the northeast with storm surges up to 20 feet occurred in 1635 and 1675. A Katrina like storm made landfall in Louisiana in 1722 with major flooding and damage in Louisiana. The Great Chesapeake storm in 1769 like Isabel in 2003 brought major flooding to North Carolina and Virginia.
In the Caribbean, the Great Hurricane of 1780 killed an estimated 27,500 people while ravaging the islands of the eastern Caribbean with winds estimated to top 200 mph. It was one of three hurricanes that year with death tolls greater than 1000.
The period from the 1850s to 1910 was very active in the Gulf area.
1886 had least 10 hurricanes, 7 making landfall (3 in Texas). 4 of the 1886 hurricanes were major hurricanes.
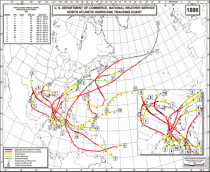
Dr. Neil Frank, longest serving Hurricane Center Director adds:
“Without question the most reliable indicator of a trend in hurricane activity in the Atlantic is to focus on land falling major hurricanes (3-5) in the mainline U.S. I doubt if a major hurricane could have hit the U.S. in the 1800s without being noticed, while a minor hurricane in a remote area could have been undetected so it is important to concentrate on major hurricanes. It is important to emphasize that the rainfall in a tropical system is not related to the intensity but depends on the forward speed of motion. In the case of Harvey, the weakening hurricane stalled over southeast Texas for three days.
Finally, as you know the most active hurricane season in the U.S. was 1886 when 7 hurricanes hit the Gulf coast. One of the major hurricanes in Texas destroyed Indianola on the south shore of Matagorda Bay. At one time there were around 20,000 people in the city before a prior major hurricane in 1875 did major damage. The only thing in Indianola today is a cemetery with numerous headstones with dates 1875 or 1886.”
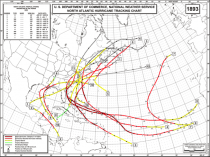
1893 had at least 10 hurricanes. Of those, 5 became major hurricanes. Two of the hurricanes caused over two thousand (2000) deaths in the United States; at the time, the season was the deadliest in U.S. history.
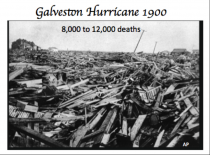
The Galveston Hurricane in 1900 killed at least 8,000 people with some estimates as high as 12,000, making it the deadliest natural disaster in U.S. history.Just 7 years later, the Galveston Hurricane in 1900 killed at least 8,000 people with some estimates as high as 12,000, making it the deadliest natural disaster in U.S. history. Most of these deaths occurred after a storm surge inundated the coastline with 8 to 12 feet of water. Every building and dwelling suffered some degree of damage and 3,636 homes were demolished.
The disaster ended the Golden Era of Galveston, as the hurricane alarmed potential investors, who turned to Houston instead. In response to the storm, three engineers designed and oversaw plans to raise the Gulf of Mexico shoreline of Galveston Island by 17 feet and erect a 10 mile seawall.
Though the Gulf and Caribbean waters are always warm enough to trigger storms every year, the areas further north do see quieter periods. After decades of no impact storms, there were 8 major devastating storms on the east coast from 1938 to 1960 then a 28-year lull until Hugo in 1989 began another active era of increased activity. We will soon as the earth goes into the next cool period driven by the sun and sun’s impacts on the ocean temperature regimes, see another relative quiet period further north.
Already the tropical atmosphere is showing no warming.
_thumb.png)
Enlarged
And the most skillful statistical model that with high accuracy explained the temperature changes (short term and long) since 1979 using solar and ocean factors, suggested in 2016 a cooling that would show up about now.
_thumb.png)
And more evidence about the arctic, fires, hurricanes and tornadoes.
 \
\
Enlarged
_thumb.png)
_thumb.png)
_thumb.png)
By Kevin Mooney
September 23, 2021
Members of the Biden administration from the president on down who peddled unsubstantiated allegations about Russian collusion with Donald Trump have some explaining to do.
That’s because Mother Russia is now benefitting from President Biden’s anti-energy policies in general, and from his hostility toward U.S. oil and gas, in particular.
Suddenly, Russia is the number two oil importer to the U.S. behind only Canada. The U.S. Energy Information Administration reports that U.S. imports of oil and refined petroleum products from Russia increased by 23% in May to 844,000 barrels a day from the prior month.
There is no natural process of osmosis at work here. America is more reliant on Russian oil than it was just a few months ago under Trump because of deliberate public decisions made under Biden that put America last. In January, Biden canceled the Keystone XL pipeline, which would have pumped vital oil resources from Canada into the U.S. He then proceeded to withdraw the sanctions the Trump administration put in place enabling Russia’s Nord Stream 2 pipeline to transfer natural gas to Germany without navigating its way through Ukraine.
Recall that it was just a few years ago that Biden favored the creation of a select committee to investigate allegations of collusion between Russia and Trump campaign officials.
The Institute for Energy Research, a Washington D.C.-based nonprofit that favors free market energy policies, carefully unpackages the geopolitical fallout from Biden’s decision to oppose pipeline construction in the U.S. while removing obstacles for Russian pipelines.
“Instead of benefiting Russia, Keystone XL would have benefited the United States and our closest ally, IER explains in a press release. “Keystone XL would have not only supplied Gulf refineries with 830,000 barrels per day (730,000 Canada, 100,000 North Dakota Bakken) but also would have lifted prices paid to Canadian producers, encouraging new investments (and further pipelines) to tap Canada’s second-largest in the world proven reserves.”
The Biden administration waived sanctions on the corporation standing behind Russia’s Nord Stream 2 pipeline, and by extension the company CEO , who is a close ally of Russian President Vladimir Putin. Once again, recall it was Biden, and others now serving in his administration, who suggested that Trump would be favorably disposed toward Russia. But it was under Trump that America became energy independent for the first time in decades. As a further insult, the Biden administration has called on the Organization of the Oil Producing Countries (OPEC) to accelerate its oil production in response to rising energy prices.
Biden, for whatever reason, has a more congenial view of Russian energy initiatives than he does toward the infrastructure that makes it possible for energy supplies to flow across North America. Unfortunately, Biden’s America Last pipeline policies are just one small part of a larger picture.
The infrastructure bill and the reconciliation package now moving through Congress will devastate the American energy sector along with U.S. households that benefit the most from robust domestic development of oil and gas resources. The American Energy Alliance (AEA), a nonprofit consumer advocacy group, asks why federal taxpayers are being asked to foot the bill for electric vehicle subsidies to the tune of $7.5 billion instead of having the electric vehicle owners pay for electric car charging facilities themselves.
While the details about the reconciliation package remain vague, news reports anticipate the bill will include a tax on methane emissions, a border carbon tax and other anti-energy mandates.
The proposed tax on methane emissions will raise the cost of natural gas and consequently everything that natural gas is used for such as home heating while the border carbon tax will increase the costs of all goods coming into the U.S., according to an analysis from the American Energy Alliance.
The carbon border tax would impact everyday items like food, clothing, and construction materials used in cars and electronics. While the tax would be absorbed by all consumers, they would most directly impact individuals on fixed incomes.
But it’s not just Russia that’s scoring geopolitical points under Biden. The president’s pledge to mandate a carbon-free generation sector by 2035 means the U.S. will be forced to rely on inefficient, unreliable solar and wind technology. That’s a problem because China now dominates the market for lithium supplies used to manufacture batteries that can power so called renewable energy.
Bonner Cohen, a senior fellow with the National Center for Public Policy Research, delves into detail about Biden’s legislative agenda and his assault on American energy.
“The two pieces of legislation that would guide the U.S. into a green energy future come at a time when President Biden is asking the Organization of the Oil Producing Countries (OPEC) and its allies, including Russia, to boost oil production to counter rising gas prices at the pump,” Cohen said in an interview. “He notably did not turn to domestic producers to pump more oil. He is continuing his administration’s war on U.S. oil and gas producers, claiming their emissions pose a threat to the climate. But somehow OPEC’s emissions are just fine. His plea to OPEC is an acknowledgement that windmills and solar panels—no matter how generous the subsidies—cannot supply the nation with the energy it needs.
The Nord Stream 2 pipeline that brings Russian natural gas to Germany and beyond meets with Biden’s approval, but the Keystone XL pipeline that transports Canadian oil to U.S. refiners is killed. His policies destroy American jobs, reduce the disposable incomes of consumers, and enrich OPEC, China, and Silicon Valley and Wall Street investors in green energy.”
By Joe D’Aleo
The administration is working to push a budget that includes the Green New Deal which will have huge negative effects on our lives and will destroy out economy possibly beyond repair.
Here is a two part series I produced for the local cable system that fact checks the claims made about the theory of unprecedented global warming and extremes of weather. We show the model failures and examples of the Law of Unintended Consequences that applied in every country that has gone down the green path (the modern day yellow brick road to Oz).
Part 1: Link
The failures in Afghanistan are being linked to pressures on the people in the region from climate change. Also extremes of drought in the west and north central US and Canada and parts of Russia and South America, flooding rains in China, Europe and the southern US and record cold in Brazil are all claimed by some to be man’s fault.
Just over 40 years ago, the idea an ice age was developing thanks to the human volcano. See Leonard Nino talk about the last cold cycle 1950 to 1979 when the worry by many scientists was we may be heading into another ice age and cold is always worse than warm.
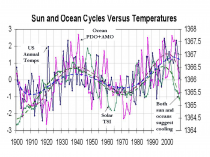
Then as the next warm cycle began, they jumped on the warm bandwagon. See the cycle tracks with cycles of the PDO and AMO ocean 60 year cycles and a 60 year trend in TSI (solar). The temperatures track with these factors 100% of the time. CO2 changes with temperatures 40% of the time.
Journalist H.L. Mencken observed:
and“The whole aim of practical politics is to keep the populace alarmed (and hence clamorous to be led to safety) by menacing it with an endless series of hobgoblins, all of them imaginary.”
“The urge to save humanity is almost always a false front for the urge to rule.”
--------------
United Nations and Google Blame Global Warming for African Dictatorships’ Failures!
Dr. Patrick Moore (Greenpeace Co-Founder), author of “Fake Invisible Catastrophes and Threats of Doom” Paperback Comments on the CBS story:
This CBS article reads, “Rural Afghanistan has been rocked by climate change. The past three decades have brought floods and drought that have destroyed crops and left people hungry. And the Taliban likely without knowing climate change was the cause - has taken advantage of that pain.”
Here is the objective data on Afghan crop production, in kilograms per hectare:
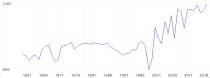
Hmmm, I wonder who is telling the truth here. Is it failing crops or political incompetency?
See the real story thanks to James Taylor.
United Nations and Google Blame Global Warming for African Dictatorships’ Failures
By James Taylor - August 20, 20210
The United Nations has just published, and Google News is heavily promoting, an online publication titled, “Five things you need to know about the climate emergency in West and Central Africa.” The publication highlights countries with some of the most repressive governments in the world and then invents alleged global warming impacts to explain those countries’ failures. Yet, the truth is entirely different. Here are the five assertions by the United Nations, with the five things you really need to know about how the U.N. is falsely blaming global warming for African dictators’ failures:
“1. The Sahel, Land of Extremes” - The U.N. publication claims, “In the Sahel, temperatures are increasing 1.5 times faster than in the rest of the world, and the number of floods almost doubled between 2015 and 2020. These effects exacerbate a context where 29 million people rely on life-saving assistance this year.”
In 2013, the U.N. published an article, “The Sahel: One region, many crises.” The article claimed, “Even in normal years, millions are in a permanent state of food insecurity. Over the past five decades, persistent droughts have contributed to famine episodes. There is now a need to break the cycle of recurrent food crises in the region, many humanitarian actors say.”
Great news, the cycle has been broken and more rainfall is greening the region. As the Guardian reported just three years later, “Thankfully the region has become wetter again, and now new research indicates that the return of the rains is most likely a beneficial side-effect of global warming.”
So, what does the United Nations claim now that global warming has brought long-desired rains to the Sahel? The U.N. now claims, “the number of floods almost doubled between 2015 and 2020.” Well, yeah, if the region was bone-dry before, people couldn’t even grow food, they prayed for rain, and now global warming brings those welcome rains, it stands to reason that a small negative side-effect of the return of rain will be more of the infrequent floods that occur. Only climate alarmists that are desperately seeking to create climate crises would report the welcome arrival of much-needed rains as a climate crisis.
“2. Women Pay a Heavy Price” - The U.N. publication claims, “Climate hazards especially affect women and girls, who often bear a disproportionate burden to provide for their families. These hazards act as a ‘threat multiplier,’ increasing the levels of intimate partner violence, sexual violence and child marriage.”
The U.N. publication never claims how or why global warming causes more wife-beatings, abuse, and the cultural institution of parents arranging marriages for their pre-adult children. The U.N. publication just makes the conclusory statement as if it is a self-evident fact.
The only justification we can think of is the often-asserted claim that global warming is harming crop production, which drives people into poverty, which then stresses people out and forces them to beat their wives. The crop data throughout Africa, however, tell a different story. If anything, global warming is reducing the pressures that allegedly drive people to beat their wives and force their children into premature marriage.
Crop production throughout Africa is enjoying substantial long-term gains as the Earth modestly warms. Here are a few examples, provided by the information website The Global Economy, presenting United Nations Food and Agriculture Organization data reporting cereal (rice, wheat, corn) yields on the left axis in kilograms per hectare for Chad, Nigeria, Mali, Burkina Faso, Egypt(in the link here).
And the list goes on and on and on....
Clearly, if economic factors influence African wife-beatings and child marriages, and global warming impacts economic factors, then global warming is reducing wife-beatings and child marriages, not making them more prevalent.
“3. Climate Negatively Effects Food Production” - The U.N. publication claims, “Climate hazards have led to the degradation of 80 per cent of the Sahel’s farmlands and drastically reduced food sources. Food insecurity continues to increase, reaching record peaks every year; 14 million people are struggling with crisis or emergency levels of food insecurity. People living in major hotspots of compounded crises, such as the Central Sahel and the Lake Chad basin, pay a heavy price. This year, 5.2 million people in the Central Sahel and 5.1 million in the Lake Chad basin face hunger.”
That is a nifty narrative, but the objective facts tell a different story and don’t lie. Chad, Nigeria, Mali, Ethiopia, Burkina Faso are all Sahelian nations. The crop data objectively measured and presented above tells a completely different story than what the U.N. publication asserts.
We can also show the U.N. publication’s dishonesty by looking at NASA satellite images showing how vegetation and greenery are increasing and decreasing around the globe. The NASA image below shows that in the Sahel region at the southern edge of the Sahara desert, vegetation and greenery have been increasing in more areas and to a greater degree than in the small regions of the Sahel where vegetation is retreating. Increasing greenery reflects better crop conditions.
“4. Herders and Farmers Fight Over Resources” - The U.N. publication claims, “Farmer-herder violence in West and Central Africa has increased over the past 10 years, with concentrations in northern Burkina Faso, central Mali, and Nigeria. Extreme stress, property and communal loss, changes in land use, and a scarcity of food and water contribute to community conflict over resources and lead to an increasing number of incidents. In Mali, the cycles of farmer-herder violence and reprisals have become increasingly lethal since 2015 and resulted in nearly 700 fatalities in 2020.”
Much like its section on women, the U.N. report references cultural violence and then states, without supporting evidence, that global warming is to blame and making it worse.
The whole notion of global warming causing herders to beat, rob, and kill each other is based on the assertion that global warming is stifling the vegetation growth and crop production that supports animal herding. Yet, as shown above, the objective data don’t lie. Sahelian and African vegetation and crop production are substantially improving, not declining, as the Earth modestly warms.
“5. Heavy Rains Hinder Humanitarian Access” - The U.N. publication claims, “A record 54.3 million people need humanitarian assistance across West and Central Africa, but extreme weather patterns are affecting the capacity of humanitarian personnel to quickly reach the most vulnerable people. In the Democratic Republic of the Congo, only 1.3 per cent of roads are paved, and the remaining road system is prone to floods during the rainy season. This leads to landslides and roads being inaccessible, delaying humanitarian assistance for days.”
The U.N. presents a heartbreaking tale of flooding and resulting humanitarian crises in Congo, but the objective data destroy the false assertion that global warming is to blame. A study of rainfall data in central Africa, presented last year in the peer-reviewed journal Atmospheric and Climate Sciences, shows no trend-change in precipitation during the past 100 years in the Democratic Republic of Congo. How can global warming be making flooding in Congo worse when there is no change in the amount of rainfall?
Shilling for Dictators - In summary, the objective data show that the United Nations is more concerned with making excuses for the failures of African dictators than presenting accurate information about global warming. As shown in the World Population Review ranking of Freest Countries, the nations featured in the U.N. publication are among the least free in the world. Only 1.3 percent of roads in Congo are paved because the country is run by repressive dictators, not because of global warming. Food insecurity continues to increase in the Sahel, despite a greening of the region and increasing crop production, because the region is governed by repressive dictators.
Global warming is the convenient excuse presented by dictators and big-government apologists throughout the world. The fact is that global warming is creating more beneficial conditions in Africa and throughout the world, but global warming is the convenient scapegoat on which to hang fictitious crisis and real crises that are created by government, not climate.
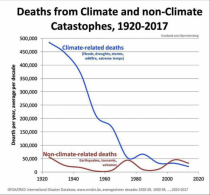
A study just published in the prominent health journal, The Lancet, reports deaths associated with extreme temperatures are declining. The report also demonstrates cold temperatures contribute to far more deaths each year than warmer temperatures.
In reporting on a pre-release version of the story in early July, the mainstream media misrepresented the study’s findings. The headline of Bloomberg News’ story discussing the study, “Climate Change Linked to 5 Million Deaths a Year, New Study Shows,” was typical misleading way the mainstream media covered the report before it was published. Rather than showing climate change was causing 5 million excess deaths, the research actually shows the recent modest warming has resulted in a decline in deaths associated with “non-optimal temperatures since 2000.
Since The Lancet officially published the study, titled “Global, regional, and national burden of mortality associated with non-optimal ambient temperatures from 2000 to 2019: a three-stage modeling study,” and people could examine the data themselves, there has largely been media silence.
The Lancet study, arguably the largest ever to examine excess mortality associated with temperature, was co-authored by 68 scientists representing universities and research institutes in 33 countries spanning all regions of the world.
According to the authors, there has been a small, possibly statistically insignificant, 0.21 percent increase in heat related deaths since 2000. Over the same time period deaths tied to cold temperatures declined by 0.51 percent. Because cold related deaths outnumber heat related deaths 10 to one, since 2000, the number of deaths associated with temperatures declined significantly, by tens of thousands.
As the figure below demonstrates, the study found cold related deaths greatly outnumber heat related deaths in every region of the world.
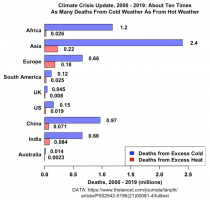
Figure 1. Global heat and cold related deaths graphed by region, from 2000-2019. Graph created by Willis Eschenbach from Lancet study data. Enlarged
The Lancet confirms what research previously published in The Lancet, the Southern Medical Journal, and other outlets, has consistently shown: Cold is the biggest temperature related killer, not heat. One is left wondering when the mainstream media will accurately report this fact.
The science is clear that cold temperatures pose a far greater risk to human health than hot temperatures, and deaths associated with temperatures are declining as the earth modestly warms. Climate alarmists may not want to hear it, but that’s what science shows and they should, in their own oft-shouted phrase, “Follow the Science!”
H. Sterling Burnett, Ph.D. is managing editor of Environment & Climate News and a research fellow for environment and energy policy at The Heartland Institute. Burnett worked at the National Center for Policy Analysis for 18 years, most recently as a senior fellow in charge of NCPA’s environmental policy program. He has held various positions in professional and public policy organizations, including serving as a member of the Environment and Natural Resources Task Force in the Texas Comptroller-s e-Texas commission.
Joseph D’Aleo here
Introduction
Virtually every month and year we see reports that proclaim the global data among the warmest in the entire record back to 1895 or earlier. But the efforts to assess changes to the climate are very young and beset with many issues.
The first truly global effort to measure atmospheric temperatures began with the help of satellite infrared sensing in 1979.
The first U.S. station based data set and monthly analysis was launched in the late 1980s and for the global in 1992. These datasets are products of simulation models and data assimilation software, not solely real data.
One of the key issues is Spatial Bias - the density of observation stations varied greatly on the global scale. Dr. Mototaka Nakamura in his book “Confessions of a climate scientist: the global warming hypothesis is an unproven hypothesis” writes that over the last 100 years “only 5 percent of the Earth’s area is able show the mean surface temperature with any certain degree of confidence. “A far more serious issue with calculating ‘the global mean surface temperature trend’ is the acute spatial bias in the observation stations. There is nothing they can do about this either. No matter what they do with the simulation models and data assimilation programs, this spatial bias before 1980 cannot be dealt with in any meaningful way.”
On top of this spatial bias:
* Missing monthly data from existing stations for 20-90% of the stations globally requiring model infilling, sometimes using data from stations hundreds of miles away
* Station siting not to specifications (US GAO found 42% U.S. stations needed to remedy siting) with serious warm biases
* Airport sensor systems were designed for aviation and not climate allowing temperature errors up to 1.9F
* Adjustments to early record occur with every new update, each cooling early data in the record, causing more apparent warming.Dr. Nakamura blasts the ongoing data adjustments: “Furthermore, more recently, experts have added new adjustments which have the helpful effect of making the Earth seem to continue warming”. He deems this “data falsification”.
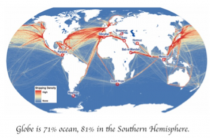
* Oceans which cover 71% of the globe (81% of the Southern Hemisphere) had data limited to shipping lanes, mainly in the northern hemisphere until 50km nighttime satellite ocean skin temperatures measurement became available after 1984 and the ARGO 4000 buoy global network after 2000.
Attempting to compile a ‘global mean temperature’ from ever changing, fragmentary, disorganized, error-ridden, geographically unbalanced data with multi-decadal evidence of manipulation does not reach the level of the IQA quality science required for the best possible policy decision making. We went from recognizing the serious observation limitations into the late 20th century to making claims we can state with confidence how we rank each month for the US and globe to tenths of a degree back into the 1800s.
Dr. Nakamura commented at NTZ: “So how can we be sure about the globe’s temperatures, and thus it’s trends before 1980? You can’t. The real data just aren’t there.Therefore, the global surface mean temperature change data no longer have any scientific value and are nothing except a propaganda tool to the public.”
The most prudent step to take for our nation would focus on satellite data and CRN and USRCRN, if funded, for land and ARGO buoy data for the oceans and assess the changes over the next few decades before taking radical steps to cancel our country’s hard fought and finally achieved energy independence
Temperature Measurement Timeline Highlights
We hear every month and year claims about record setting warmth back into the 1800s. But see below how recently we attempted to reconstruct the past - scraping together segments of data and using models and adjustments to create the big picture. This was especially difficult over the oceans which cover 71% of the earth’s surface.
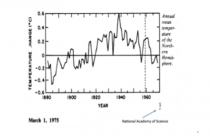
1975 - National Academy of Science makes first attempt at determining global temperatures and trend, which they limited to the Northern Hemisphere land areas (U.S. and Europe). This was because they recognized reliable date on a larger scale and over the ocean was just not available or trustworthy. The data they were able to access showed a dramatic warming from the 1800s to around 1940 then a reversal ending to the late 1970s roughly eliminating the nearly 60 years of warming. The CIA warned that the consensus of scientists was we might be heading towards a dangerous new ice age.
1978 - New York Times reported there was too little temperature data from the Southern Hemisphere to draw any reliable conclusions. The report they references was prepared by German, Japanese and American specialists, and appeared in the December 15 issue of Nature, the British journal. It stated that “Data from the Southern Hemisphere, particularly south of latitude 30 south, are so meager that reliable conclusions are not possible,” the report says. “Ships travel on well-established routes so that vast areas of ocean, are simply not traversed by ships at all, and even those that do, may not return weather data on route.”
1979 - Global satellite temperature measurement of the global atmosphere begins at UAH and RSS.
1981 - NASA’s James Hansen et al reported that “Problems in obtaining a global temperature history are due to the uneven station distribution, with the Southern Hemisphere and ocean areas poorly represented” (Science, 28 August 1981, Volume 213, Number 4511(link))
1989 - At that time, in response to the need for an accurate, unbiased, modern historical climate record for the United States, personnel at the Global Change Research Program of the U.S. Department of Energy and at NCEI defined a network of 1219 stations in the contiguous United States whose observation would comprise a key baseline dataset for monitoring U.S. climate. Since then, the USHCN (U.S. Historical Climatology Network) dataset has been revised several times (e.g., Karl et al., 1990; Easterling et al., 1996; Menne et al. 2009). The three dataset releases described in Quinlan et al. 1987, Karl et al., 1990 and Easterling et al., 1996 are now referred to as the USHCN version 1 datasets.
The documented changes that were addressed include changes the time of observation (Karl et al. 1986), station moves, and instrument changes (Karl and Williams, 1987; Quayle et al., 1991). Apparent urbanization effects were also addressed in version 1 with a urban bias correction (Karl et al. 1988)
Tom Karl wrote with Kukla and Gavin in a 1986 paper on Urban Warming: “MeteoSecular trends of surface air temperature computed predominantly from [urban] station data are likely to have a serious warm bias...The average difference between trends [urban siting vs. rural] amounts to an annual warming rate of 0.34C/decade (3.4C/century)… The reason why the warming rate is considerably higher [may be] that the rate may have increased after the 1950s, commensurate with the large recent growth in and around airports. Our results and those of others show that the urban growth inhomogeneity is serious and must be taken into account when assessing the reliability of temperature records.”
Here was an early 1989 plot of USHCNv1.
Enlarged
1989 - The NY Times reported the US Data “failed to show warming trend predicted by Hansen in 1980.”
1992 - NOAA’s first global monthly assessment began (GHCNm - Vose). Subsequent releases include version 2 in 1997(Peterson and Vose, 1997), version 3 in 2011 (Lawrimore et al. 2011) and, most recently, version 4 (Menne et al. 2018). For the moment, GHCNm v4 consists of mean monthly temperature data only.
1992 - The National Weather Service (NWS) Automated Surface Observing System (ASOS), which serves as the primary data source for more than 900 airports nationwide and is utilized for climate data archiving was deployed in the early 1990’s. Note the criteria specified a Root-mean-square-error (RMSE) of 0.8F and max error of 1.9F. ASOS was designed to supply key information for aviation such as ceiling visibility, wind, indications of thunder and icing. They were NOT designed for assessing climate.
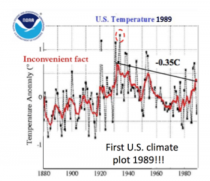
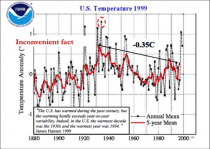
1999 - The USHCN temperature still trailed 1934 as it had a decade earlier - James Hansen noted “The U.S. has warmed during the past century, but the warming hardly exceeds year-to-year variability. Indeed, in the U.S. the warmest decade was the 1930s and the warmest year 1934.” When asked why the discrepancy, Hansen said the US was only 2% of the world and both could be right.
Here was the 1999 plot.
2000 - A network of nearly 4000 diving buoys (ARGO) were deployed world wide to provide the first reliable real-time, high resolution monitoring of ocean temperatures and heat content.
2004 - National Climate Reference Network was launched with guidance from John Christy of UAH who had a pilot network in Alabama where he was State Climatologist to provide uncontaminated temperatures in the lower 48 states. The 114 stations met the specifications that kept them away from local heat sources.
2005 - Pielke and Davey (2005) found a majority of stations, including climate stations in eastern Colorado, did not meet requirements for proper siting. They extensively documented poor siting and land-use change issues in numerous peer-reviewed papers, many summarized in the landmark paper “Unresolved issues with the assessment of multi-decadal global land surface temperature trends” (2007).
2007 - A new version of the U.S. climate network, USHCNv2 had adjustments including Karl’s adjustment for urban warming’. David Easterling, Chief Scientific Services Division for NOAA’s Climate Center expressed concern in a letter to James Hansen at NASA “One fly in the ointment, we have a new adjustment scheme for USHCNv2 that appears to adjust out some, if not all of the local trend that includes land use change and urban warming”.
2008 - In a volunteer survey project, Anthony Watts and his more than 650 volunteers at http://www.surfacestations.org found that over 900 of the first 1,067 stations surveyed in the 1,221 station U.S. climate network did not come close to the specifications as employed in Climate Reference Network (CRN) criteria. Only about 3% met the ideal specification for siting. They found stations located next to the exhaust fans of air conditioning units, surrounded by asphalt parking lots and roads, on blistering-hot rooftops, and near sidewalks and buildings that absorb and radiate heat. They found 68 stations located at wastewater treatment plants, where the process of waste digestion causes temperatures to be higher than in surrounding areas. In fact, they found that 90% of the stations fail to meet the National Weather Service’s own siting requirements that stations must be 30 m (about 100 feet) or more away from an artificial heating or reflecting source.
2009 - NASA’s Dr. Edward R. Long in a 2009 analysis looked at the new version of the US data. Both raw and adjusted data from the NCDC (now NCEI) was examined for a selected Contiguous U.S. set of rural and urban stations, 48 each or one per State. The raw data provides 0.13 and 0.79 C/century temperature increase for the rural and urban environments, consistent with urban factors. The adjusted data provides 0.64 and 0.77 C/century respectively.
Comparison of the adjusted data for the rural set to that of the raw data shows a systematic treatment that causes the rural adjusted set’s temperature rate of increase to be 5-fold more than that of the raw data. This suggests the consequence of the NCDC’s protocol for adjusting the data is to cause historical data to take on the time-line characteristics of urban data. The consequence intended or not, is to report a false rate of temperature increase for the Contiguous U. S., consistent with modeling utilizing the Greenhouse theory.
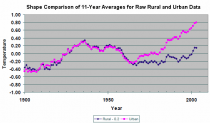
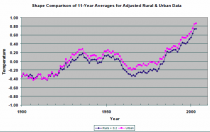
2010 - A 2009 review of temperature issues was published by a large group of climate scientists entitled Surface Temperature Records: A Policy Driven Deception .
2010 - A landmark study Analysis of the impacts of station exposure on the U.S. Historical Climatology Network temperatures and temperature trends followed, authored by Souleymane Fall, Anthony Watts, John Nielsen-Gammon, Evan Jones, Dev Niyogi, John R. Christy, Roger A. Pielke Sr represented years of work in studying the quality of the temperature measurement system of the United States.
2010 - In a review sparked by this finding, the GAO found “42% of the active USHCN stations in 2010 clearly did not meet NOAA’s minimum siting standards. Whatsmore, just 24 of the 1,218 stations (about 2 percent) have complete data from the time they were established.”
2011 - A paper ”A Critical Look at Surface Temperature Records” was published in Elsevier’s “Evidence-Based Climate Science”.
2013 - NOAA responded to papers on siting and GAO admonition by removing and/or replacing the worst stations. Also in monthly press releases no satellite measurements are ever mentioned, although NOAA claimed that was the future of observations.
2013 - Richard Muller releases The Berkeley Earth Surface Temperatures (BEST) set of data products, originally a gridded reconstruction of land surface air temperature records spanning 1701-present, and including an 1850-present merged land-ocean data set that combines the land analysis with an interpolated version of HadSST3. Homogenization is heavily used and seasonal biases prior to Stevenson Screens in the early record are acknowledged.
2015 - A pause in warming that started around 1997 was finally acknowledged in the journal Nature by IPCC Lead Author Kevin Trenberth and attributed to cyclical influences of natural factors like El Nino, ocean cycles on global climate. The AMS Annual Meeting in 2015 had 3 panels to address ‘the pause’.
2016 - The study of Tom Karl et al. 2015 purporting to show no ‘hiatus’ in global warming in the 2000s (Federal scientists say there never was any global warming “pause"). John Bates who spent the last 14 years of his career at NOAA’s National Climatic Data Center as a Principal Scientist commented “in every aspect of the preparation and release of the datasets leading into Karl 15, we find Tom Karl’s thumb on the scale pushing for, and often insisting on, decisions that maximize warming and minimize documentation. The study drew criticism from other climate scientists, who disagreed with Karl’s conclusion about the ‘hiatus.’
2017 - A new U.S. climate data set nClimDiv with climate division model reconstructions and statewide averages was gradually deployed and replaced USHCNv2. The result was NOAA gave 40 out of 48 states ‘new’ warming. The Drd964x decadal CONUS warming rate from 1895 to 2012 was 0.088F/decade. The new nClimDiv rate from 1895 to 2014 is 0.135F/decade, almost double. Though it makes the job of analysts and data access more flexible it was at the expense of accuracy as demanded by the IQA.
2017 - Landmark studies were published which proved conclusively that the steadily rising Atmospheric CO2 Concentrations had no statistically significant impact on any of the 14 temperature time series (at the surface and in the atmosphere) and showed the so called greenhouse induced Tropical Hot Spot caused by rising atmospheric CO2 levels, simply does not exist in the real world.
2019 - Climate Scientist Dr. Mototaka Nakamura in his book “Confessions of a climate scientist: the global warming hypothesis is an unproven hypothesis” writes that over the last 100 years “only 5 percent of the Earth’s area is able show the mean surface temperature with any certain degree of confidence. “A far more serious issue with calculating ‘the global mean surface temperature trend is the acute spatial bias in the observation stations. There is nothing they can do about this either. No matter what they do with the simulation models and data assimilation programs, this spatial bias before 1980 cannot be dealt with in any meaningful way.” “So how can we be sure about the globe’s temperatures, and thus it’s trends before 1980? You can’t. The real data just aren’t there. Therefore, the global surface mean temperature change data no longer have any scientific value and are nothing except a propaganda tool to the public.”
2020 - The U.S. Regional Climate Reference Network (USRCRN) pilot program (2011) had goals to maintain the same level of climate science quality measurements as the national-scale U.S. Climate Reference Network (USCRN), but its stations would be spaced more closely and focus solely on temperature and precipitation. After a pilot project in the Southwest, USRCRN stations were to be deployed at a 130 km spatial resolution across the United States to provide for the detection of regional climate change signals. If NOAA had advanced this, America would for the first time ever have a data set that could be relied on for policy making after a few decades. Even then, the new data will not replace the old data with all its issues and uncertainties, which are not appropriate for policy decisions. It appears this program will not be advanced under this administration.
2020 - Taishi Sugiyama of Japan’s The Canon Institute for Global Studies working paper on our climate system: The Earth Climate System as Coupled Nonlinear Oscillators under Quasi-Periodical Forcing from the Space (this includes ENSO and solar). We could not agree more. See peer reviewed comments on these natural factors here.
Thanks to CliimateChangeDispatch.com
That the latest World Weather Attribution (WWA) post, Rapid attribution analysis of the extraordinary heatwave on the Pacific Coast of the US and Canada June 2021, has twenty-one contributors from prestigious research groups around the world gave it even more piquancy. What a treat! I had not been so flummoxed since reading Alan Sokal’s scholarly hoax over two decades ago: “Transgressing the Boundaries: Towards a Transformative Hermeneutics of Quantum Gravity.”
The WWA post, alas, is neither hoax nor parody, but the real deal: a collaboration - in record time, no less - “to assess to what extent human-induced climate change made this heatwave hotter and more likely.” Whether ‘human-induced climate change"- whatever that is - was present at all was not on the menu.
So it’s down the rabbit hole of questionable-cause logical fallacies in search of an answer: post hoc ergo propter hoc: ‘after this, therefore because of this’; “since event Y followed event X, event Y must have been caused by event X”; or if you prefer, cum hoc ergo propter hoc: ‘with this, therefore because of this’. A rooster crowing before sunrise does not mean it caused the sun to rise. A lot of cocks crowing before a big conference, however, could cause an increase in the flow of money into the Green Climate Fund. Cock-a-doodle-do.
Whatever the case, we clearly need a New Law of Climate Change: Climate alarmism (CA) increases exponentially as time, T, to the next United Nations Conference of the Parties (COP) or atmospheric Armageddon (AA) declines to zero; where CA is measured by the frequency of MSM and social media amplification occurring in a specific period of observation, P.
As for the “extraordinary heatwave” last month, when competition with COVID threatens to steal your thunder it pays to be as quick as greased lightning to trumpet panic and hyperbole. The paint was barely dry on June 2021, when WWA concluded that while:
An event such as the Pacific Northwest 2021 heatwave is still rare or extremely rare in today’s climate, yet would be virtually impossible without human-caused climate change. As warming continues, it will become a lot less rare. You might wonder how WWA could distinguish “human-caused climate change” from the weather over such a short period, and determine “how much less severe” the heatwave “would have been in a [computer-generated] world without human-caused climate change.”
Well, it used published peer-reviewed methods to analyze maximum temperatures in the region most affected by the heat (45-52N, 119-123W). Yet “the Earth is large and extreme weather occurs somewhere almost every day.” So which EWEs merit an attribution study? WWA prioritizes those that “have a large impact or provoke strong discussion,” so that its “answers will be useful for a large audience.”
For WWA the heatwave was a “strong warning” of worse to come:
Our results provide a strong warning: our rapidly warming climate is bringing us into uncharted territory that has significant consequences for health, well-being, and livelihoods. Adaptation and mitigation are urgently needed to prepare societies for a very different future. Adaptation measures need to be much more ambitious and take account of the rising risk of heatwaves around the world, including surprises such as this unexpected extreme… In addition, greenhouse gas mitigation goals should take into account the increasing risks associated with unprecedented climate conditions if warming would be allowed to continue. (media release, 7 July 2021)
It included two qualifications:
It is important to highlight that, because the temperature records of June 2021 were very far outside all historical observations, determining the likelihood of this event in today’s climate is highly uncertain.
Based on this first rapid analysis, we cannot say whether this was a so-called “freak” event (with a return time on the order of 1 in 1000 years or more) that largely occurred by chance, or whether our changing climate altered conditions conducive to heatwaves in the Pacific Northwest, which would imply that “bad luck” played a smaller role and this type of event would be more frequent in our current climate.
Yet WWA still concluded that:
In either case, the future will be characterized by more frequent, more severe, and longer heatwaves, highlighting the importance of significantly reducing our greenhouse gas emissions to reduce the amount of additional warming. This kind of science might be alright as an academic game with complex computer models. During the past decade, however, so-called “rapid attribution analysis” has moved outside its core business into climate politics. Researchers have become activists. Gaming uncertainty is the only game in town and the profession knows how to play it. Its media releases are a key driver of the UN’s multi-trillion dollar “ambition” to monetize “climate change” and greenmail the developed world. Did WWA assess all the factors, including natural variability? Not according to the Cliff Mass Weather Blog:
Society needs accurate information in order to make crucial environmental decisions. Unfortunately, there has been a substantial amount of miscommunication and unscientific hand-waving about the recent Northwest heatwave. This blog post uses rigorous science to set the record straight… It describes the origins of a meteorological black swan event and how the atmosphere is capable of attaining extreme, unusual conditions without any aid from our species.
It ultimately comes down to the modeling. Is it meaningful or meaningless? WWA’s “validation criteria” assessed the similarity between the modeled and observed seasonal cycle and other factors. The outcomes were described as “good”, “reasonable” or “bad”. All the “validation results” appear in Table 3 of the WWA analysis. Of the 36 models used, the results from nine were deemed “bad” (25%), 13 were “reasonable” (36%), and the remaining 14 were “good” (39%).
In a 2009 paper by Reno Knutti, et al., Challenges in combining projections from multiple climate models, the five authors stressed that there is little agreement on metrics to separate “good” and “bad” models, and there is concern that model development, evaluation and posterior weighting or ranking are all using the same datasets. In what other field would it be legitimate to select only the models merely considered “good”, or to average them in some way, then claim the process produces an acceptable approximation to the truth and reality? Imagine how the public would react to a COVID vaccine with an efficacy of only 39 percent.
How did we get to this point? It all began with ACE, the Attribution of Climate-related Events initiative. ACE’s inaugural meeting was held in Boulder, Colorado, on January 26, 2009, at the National Center for Atmospheric Research (NCAR). ACE released a four-paragraph statement. Its mission would be “to provide authoritative assessments of the causes of anomalous climate conditions and EWEA”, presumably for the Intergovernmental Panel on Climate Change (IPCC). ACE’s “conceptual framework for attribution activities” would be: “elevated in priority and visibility, leading to substantial increases in resources (funds, people and computers).” Everyone had to sing from the same song-sheet: A consistent use of terminology and close collaborative international teamwork will be required to maintain an authoritative voice when explaining complex multi-factorial events such as the recent Australian bushfires”.
Three years later, Dr Peter Stott, now the Hadley Centre’s head of climate monitoring and attribution, again stressed the importance of reining in mavericks and having a unified “authoritative voice”; this time in a conference paper. “Unusual or extreme weather and climate-related events are of great public concern and interest,” he noted, “yet there are often conflicting messages from scientists about whether such events can be linked to climate change”
All too often the public receives contradictory messages from reputable experts. If the public hears that a particular weather event is consistent with climate change they may conclude that it is further proof of the immediate consequences of human-induced global warming. On the other hand, if the public hears that it is not possible to attribute an individual event, they may conclude that the uncertainties are such that nothing can be said authoritatively about the effects of climate change as actually experienced.”
Do not confuse them with chatter about uncertainties. Imagine the furor if too many suspect that nothing “can be said authoritatively about climate change”.
Yes, change is what the planet’s climate and weather do and have always done; but we can’t tell them it’s impossible to make predictions, given all the complexity.
As for seeing EWEs as having anything other than a human cause, WWA, ACE, and Net Zero advocates prefer to look the other way. They are determined to ensure no “conflicting messages” emerge about “climate change”.
This influential 2020 paper (ten authors) - A protocol for probabilistic extreme event attribution analyses - actually includes tips on how to “successfully communicate an attribution statement”.
The eighth and final step in the extreme event attribution analysis is the communication of the attribution statement. All communication operations require communication professionals… Communication here concerns writing a scientific report, a more popular summary, targeted communication to policymakers, and a press release. We found that the first one is always essential; which of the other three are produced depends on the target audiences. For all results it is crucial that during this chain the information is translated correctly into the different stages. This sounds obvious, but in practice it can be hard to achieve.
For struggling communicators, the authors offer some helpful suggestions:
A 1-page summary in non-scientific language may be prepared for local disaster managers, policymakers, and journalists with the impacts, the attribution statement, and the vulnerability and exposure analysis, preferably with the outlook to the future if available. The local team members and other stakeholders in the analysis can be invited to be points of contact for anyone seeking further clarification of contextual information, or they may be brought closer into the project team to collaborate and communicate key attribution findings.
The press release:
should contain understandable common language. Furthermore, we found that after inserting quotes from the scientists that performed the analysis, people gain more confidence in the results. This may include accessible graphics, such as the representation [at right] of the change in intensity and probability of very mild months in the high Arctic as observed in November-December 2016, (van Oldenborgh et al., 2016a).
Social media:
It “can be used to amplify the spread of attribution findings and contribute to public discourse on the extreme event being studied. Social media can help to reach younger audiences (Hermida et al., 2012; Shearer and Grieco, 2019; Ye et al., 2017).
Social media monitoring and analytics can also be used to assess awareness and the spread of attribution findings” (Kam et al., 2019.
As for the text, WWA noted some intriguing “research into the efficacy of different ways to communicate results and uncertainties to a large audience.”
For instance, van der Bles et al. (2018) found that a numerical uncertainty range hardly decreases trust in a statement, whereas a language qualification does decrease it significantly. We also found that communicating only a lower bound, because it is mathematically better defined in many cases, is not advisable. In the first place a phrase like “at least” was found to be dropped in the majority of popular accounts. Secondly, quoting only the lower bound de-emphasizes the most likely result and therefore communicates too conservative an estimate(Lewandowsky et al., 2015).
What goes around comes around. Here we have a paper by cognitive psychologist, Professor Stephan Lewandowsky, et al., Seepage: Climate change denial and its effect on the scientific community
Vested interests and political agents have long opposed political or regulatory action in response to climate change by appealing to scientific uncertainty. Here we examine the effect of such contrarian talking points on the scientific community itself. We show that although scientists are trained in dealing with uncertainty, there are several psychological reasons why scientists may nevertheless be susceptible to uncertainty-based argumentation, even when scientists recognize those arguments as false and are actively rebutting them.
If real uncertainty - the alleged driver of Lewandowsky’s “seepage” and “ambiguity aversion” - has “arguably contributed to a widespread tendency to understate the severity of the climate problem”, and indeed to question its alleged severity, is it not a better outcome to pervasive confirmation bias and a multi-trillion dollar heist?
Nature is tricky too, and indifferent to our attempts to understand and control it. While the extreme summer heatwave was affecting the Pacific Northwest of North America last month, “global warming” apparently took a winter vacation in continental Antarctica.
Antarctica New Zealand, (ANZ), the government agency responsible for that country’s activities in Antarctica, issued this media statement on 16 June 2021:
This winter Antarctica is freezing, no surprises there - but it’s colder than usual. As midwinter approaches on Monday, Antarctica is two degrees away from recording its coldest temperature ever! According to ANZ’s Chief Scientific Advisor, Professor John Cottle: This week the temperature at (Dome Fuji Station) that[s (2400km) away from Scott Base plunged to -81.7C (the record is -83.0C), These temperatures are being caused by positive SAM (Southern Annular Mode) and a strong polar vortex.
It’s good news for this year’s sea ice, and will mean lots of sea ice growth. Sea ice is frozen ocean water that floats on top of the sea. Dome Fuji Station is 3,810 meters above sea level and located on the second-highest summit of the East Antarctic ice sheet, at 77.30S 37.30′E. Antarctica’s coldest recorded temperature at ground level is -89.6C at Vostok station on 21 July 1983, but the Dome Fuji reading last month is close.
One swallow does not a summer make, of course, nor do a few unusually cold—or hot - days say much, if anything, about “climate change”.
Antarctica’s hottest day? Not so fast. Ironically, a few days ago, on July 1, 2021, the World Meteorological Organization (WMO) recognized a new record high temperature for the Antarctic “continent” of 18.3 Celsius on 6 February 2020 at the Esperanza station (Argentina). (See the latest online issue of the Bulletin of the American Meteorological Society.)
The Antarctic Peninsula (the northwest tip near to South America) is among the fastest-warming regions of the planet, almost 3C over the last 50 years. This new temperature record is therefore consistent with the climate change we are observing.
Yet temperatures at the “northwest tip near South America” tell us next to nothing about the Antarctic continent itself, but that’s another story.
WMO’s expert committee stressed the need for increased caution on the part of both scientists and the media in releasing early announcements of this type of information. This is due to the fact that many media and social media outlets often tend to sensationalize and mischaracterize potential records before they have been thoroughly investigated and properly validated.
If only.
See 2021 a Wild Year Weatherwise and just Half Done! which recaps the Northwest Heat Wave and February Polar Vortex into the deep south.
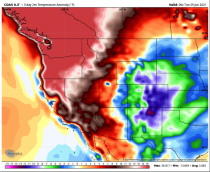
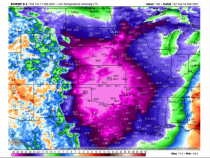
----------
The Golden State is entering yet another severe dry season and the state government is responding by draining all the reservoirs and dumping all that precious fresh water straight into the ocean.
Shocking new reports indicate that over the past several weeks, the California State Water Board has routed at least 90 percent of Delta inflow right into the sea, leaving farmers with no water to grow their crops.
“It’s equal to a year’s supply of water for 1 million people,” tweeted Central Valley farmer Kristi Diener, along with the hashtag “#ManMadeDrought.”
While California’s reservoirs are designed to hold up to five years’ worth of fresh water for the state’s water needs - and had been filled to capacity back in June 2019 - the state’s water overseers are now flushing all that water down the toilet, essentially.
According to Diener, who is both a farmer and a water expert, fresh water is being unnecessarily dumped from California’s reservoirs at a time when it is most needed, which bodes ominous for the coming summer season.
“Are we having a dry year? Yes,” Diener says.
“That is normal for us. Should we be having water shortages in the start of our second dry year? No. Our reservoirs were designed to provide a steady five-year supply for all users, and were filled to the top in June 2019.”
A data chart from the California Data Exchange Center shows that back in 2019, all of the state’s reservoirs were well over capacity. Now, they are all being drained for some unknown reason.
“You’re looking at our largest reservoirs less than two years ago,” Diener says about the chart.
“They were absolutely teeming with water from 107% to 145% of average! Our reservoirs held enough water for everyone who relies on them for their water supply, for 7 years. We are barely into our second dry year. WHERE DID IT GO?”
There would be no water shortages in California if the government stopped draining all the fresh water into the ocean. According to the California Legislative Analyst’s Office, statewide water usage averages around 85 gallons per day per person. This is not very much, and yet urban and residential users are routinely ordered to conserve as much water as possible by letting their lawns turn brown and die, avoid taking showers, and washing their clothes more infrequently.
Meanwhile, the state government has opened up the dams to let all the fresh water in reserve flow right into the ocean. It is akin to turning on your faucet and letting it run all day, every day, except your faucet is the size of a canyon.
The hypocrisy is stunning, and yet too few Californians seem to be aware of what is taking place right underneath their noses. There is simply no reason for all this fearmongering about water shortages when the state government is wasting all the water that would otherwise be available in abundance.
“Before our magnificent reservoir projects were built, California never had a steady and reliable supply of water. Now water is being managed as if those reserves don’t exist, by emptying the collected water from storage to the sea, rather than saving it for our routinely dry years,” Diener says.
“Our water projects were designed to be managed for the long term providing a minimum five year supply, but California has now put us on track to have a man-made drought crisis every time we don’t have a wet season.”
As for Gov. Gavin Newsom’s $5.1 billion so-called “drought response” package, it does absolutely nothing to fix the problem. All it does is pay off water bills that were made too expensive by the state’s intentional water scarcity scheme.
To learn more about how the state government of California has weaponized the water supply to control the population, visit WaterWars.news.
Sources for this article include: CaliforniaGlobe.com and NaturalNews.com
When asked if it was true, Anthony Watts who runs WUWT from there - a man who knows says “Note:Unfortunately, yes. It’s all about this fish called the ”Delta Smelt”. Which they’ve only found four of since 2018 after thousands of surveys. Essentially, it is extinct even after dumping billions of gallons of water to “save it” year after year. Madness, total effing madness. Todd Fichette, Associate Editor, Western Farm Press - Farm Progress added Lake Oroville will likely dry up this summer. You’ll remember Oroville Dam from early 2017 when the lake overflowed after the main spillway failed. That forced the evacuation of 250,000 people in the Sacramento Valley as they feared Oroville Dam would fail. Oroville is an earthen dam. Oroville Dam also produces hydroelectricity for about 800,000 homes. That will cease later this summer when the lake falls too low to move water though the generating facility. It’s not just a water problem -the Western grid will suffer. That power’s going to have to be made up from somewhere. The drought out West is real. The Colorado River system is in peril. LA is pumping water as fast as it can from the Colorado River because California ceased deliveries to water users through the State Water Project. Lake Mead is said to be lower today than it’s been since shortly after they began filling the reservoir after World War II. The battle right now in California is to hold some water back in Shasta Lake (northern California) for cool-pool releases later this summer for salmon runs in the Sacramento River. That water may be too warm as that lake too is drying up.
California trails only 1976/77, 1924/25 and is close to 2014/15 for dryness since 1920. Note 2016/17 was 4th wettest.

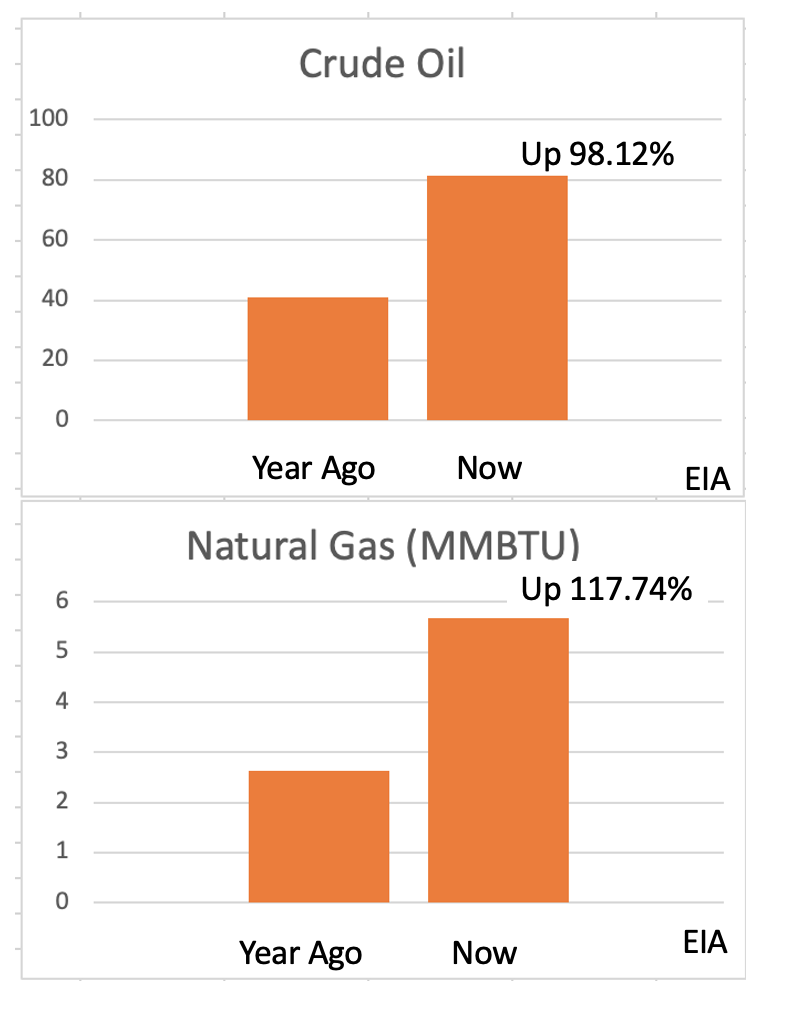
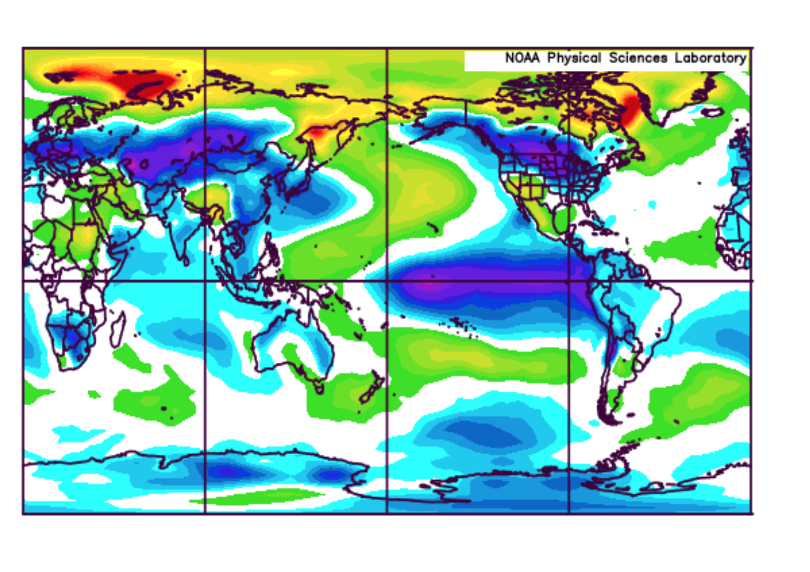
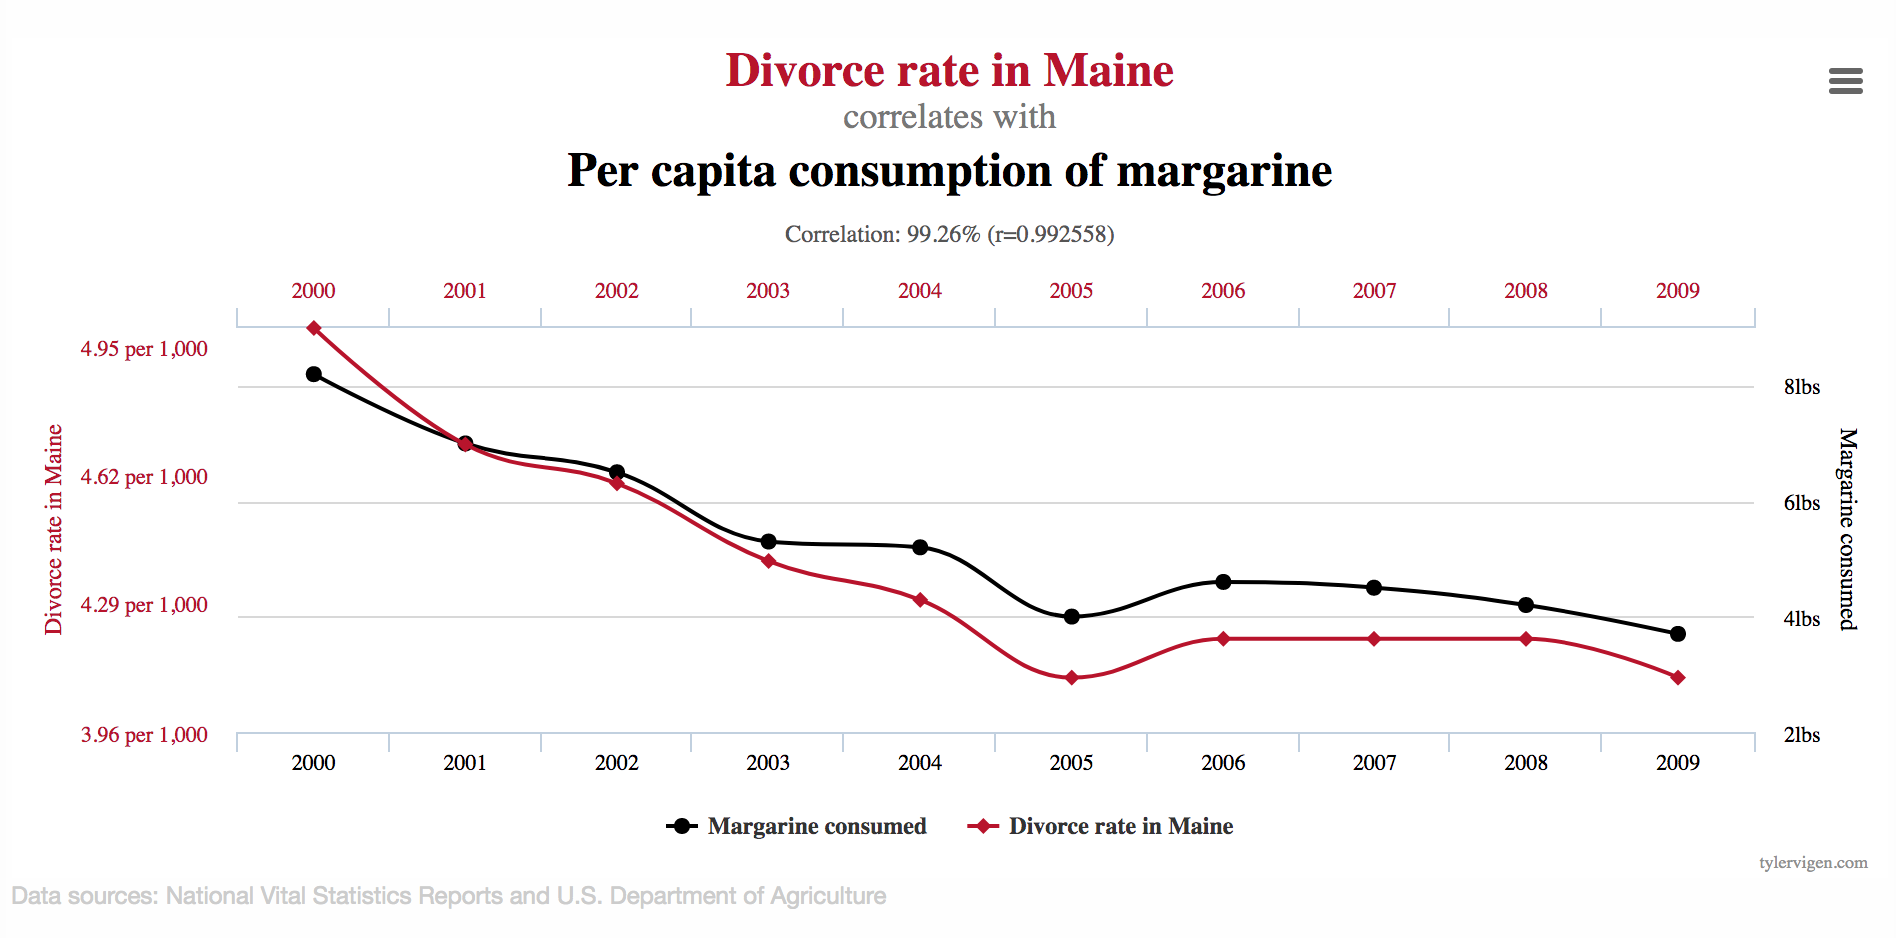
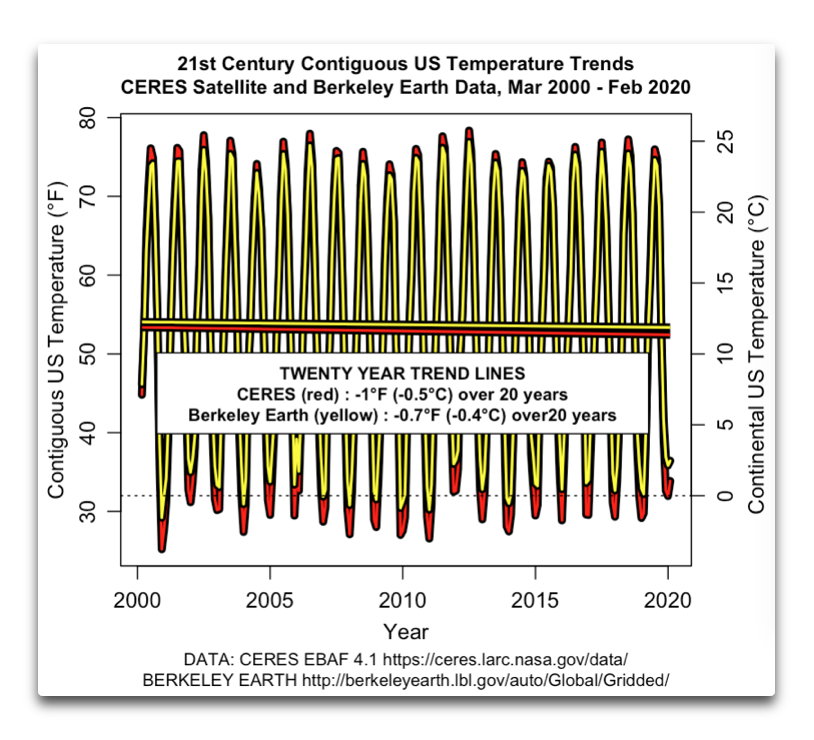
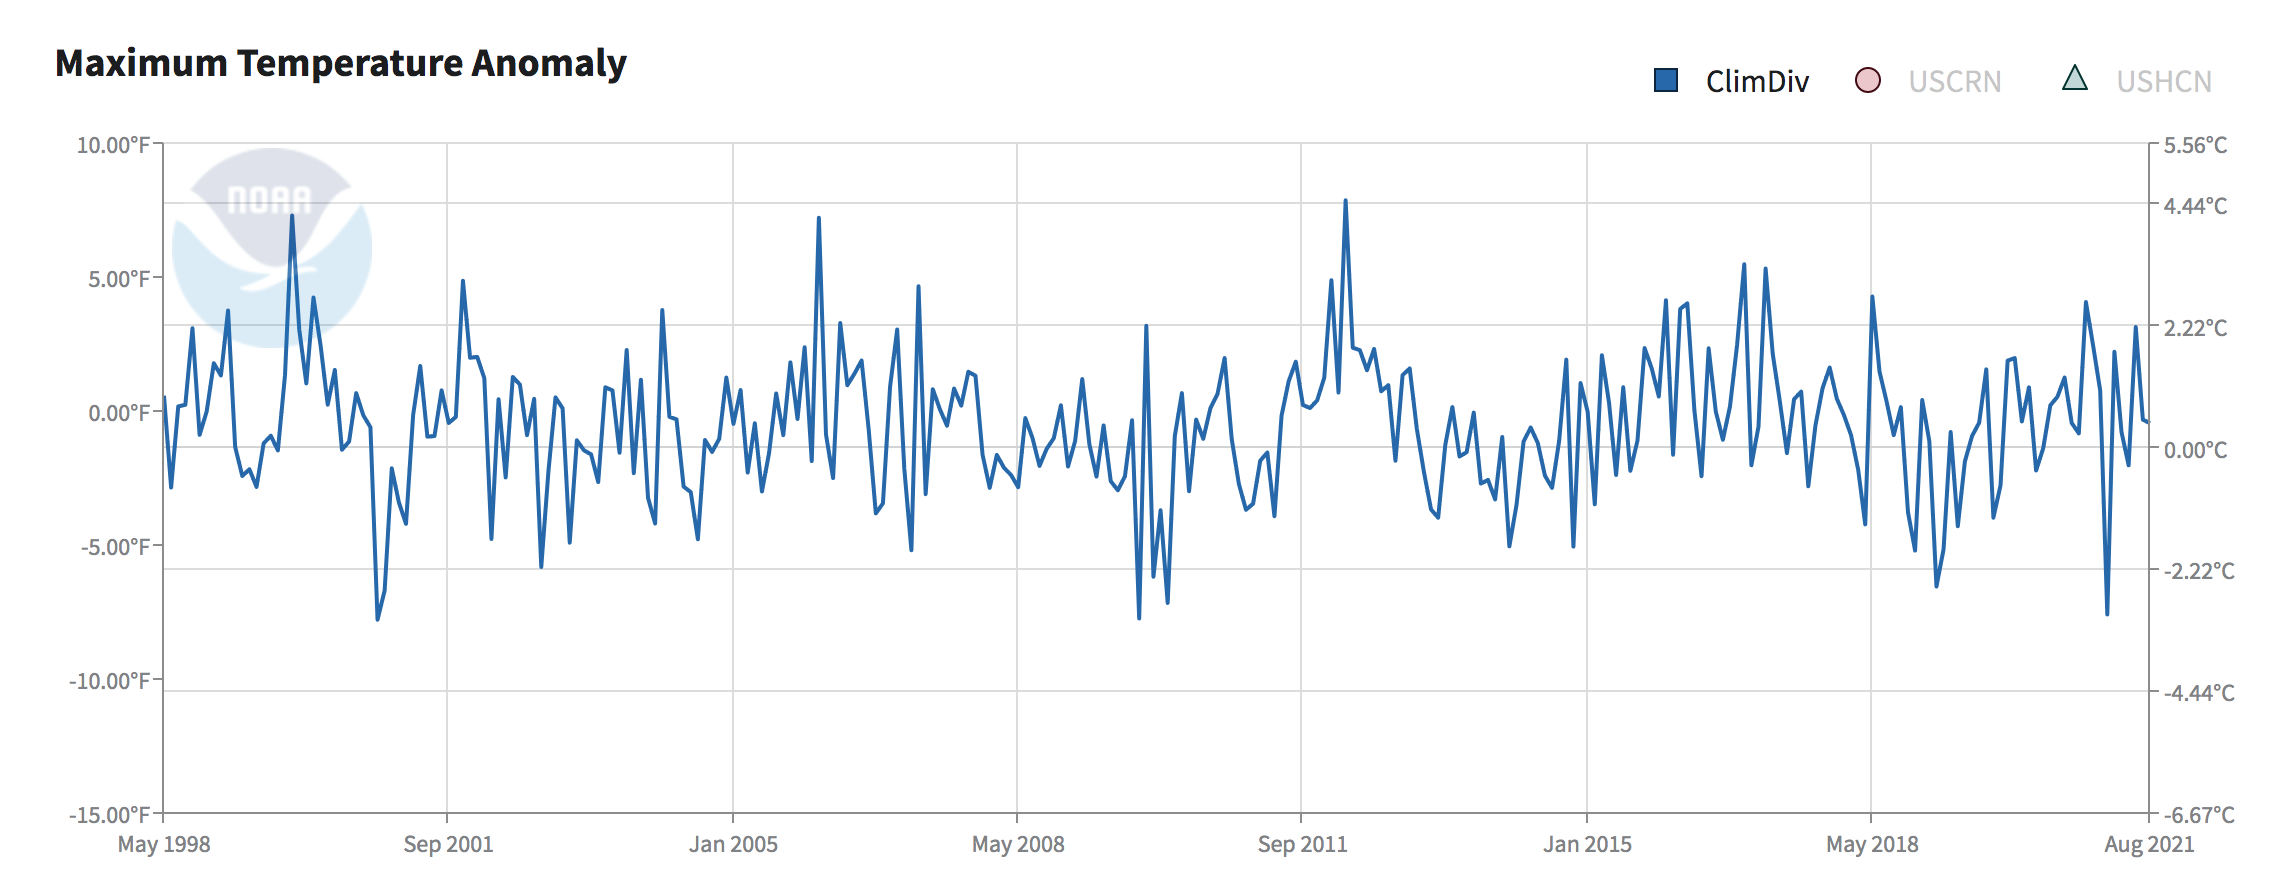
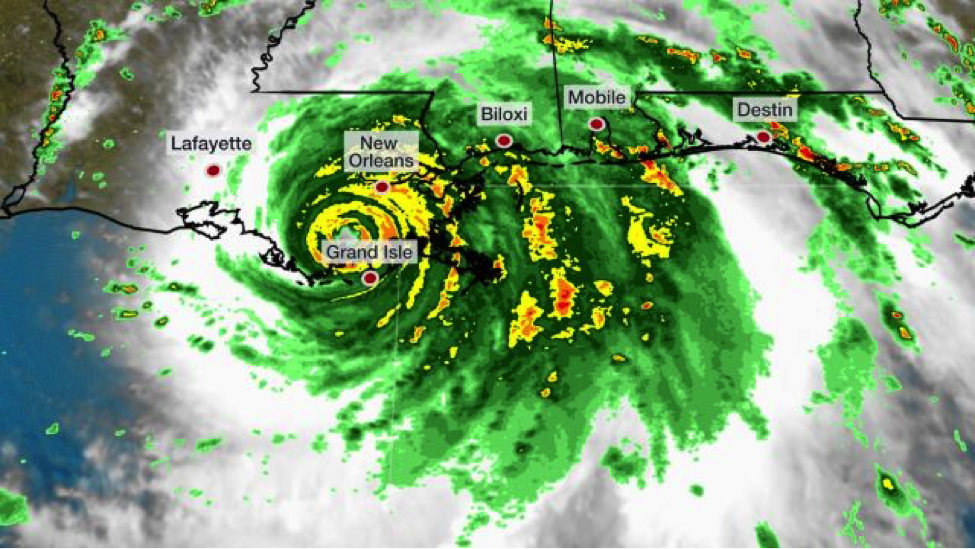
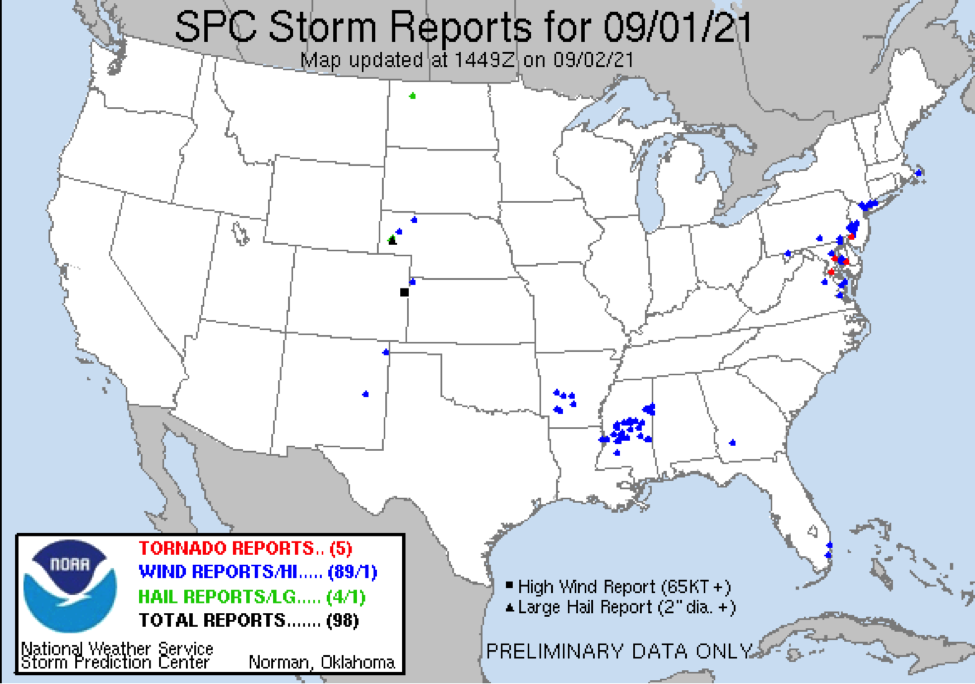
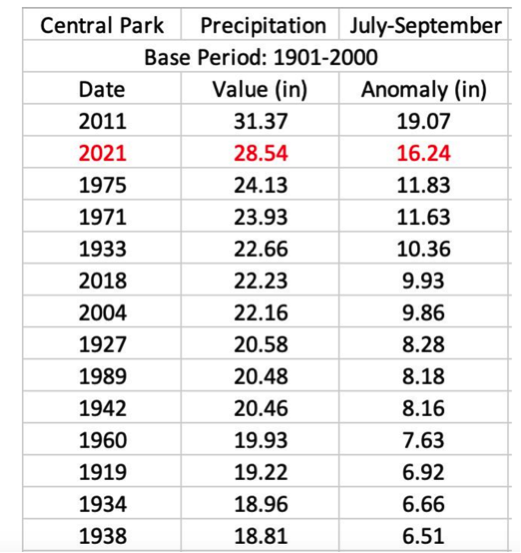
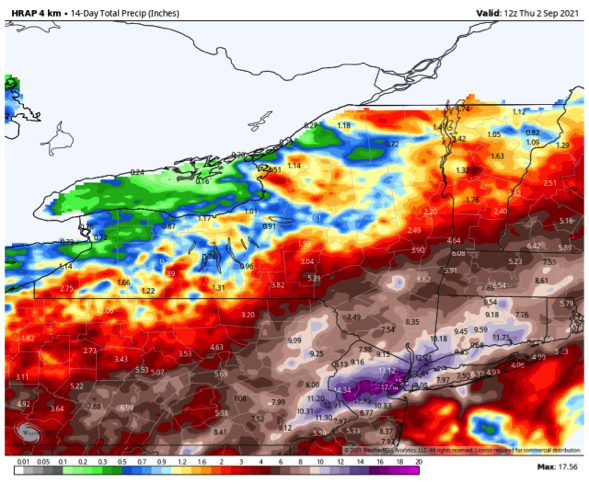
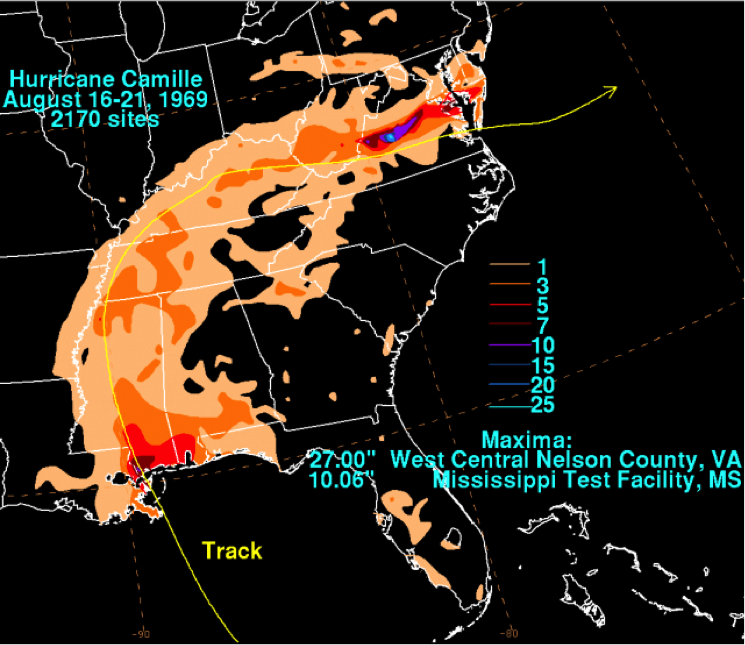
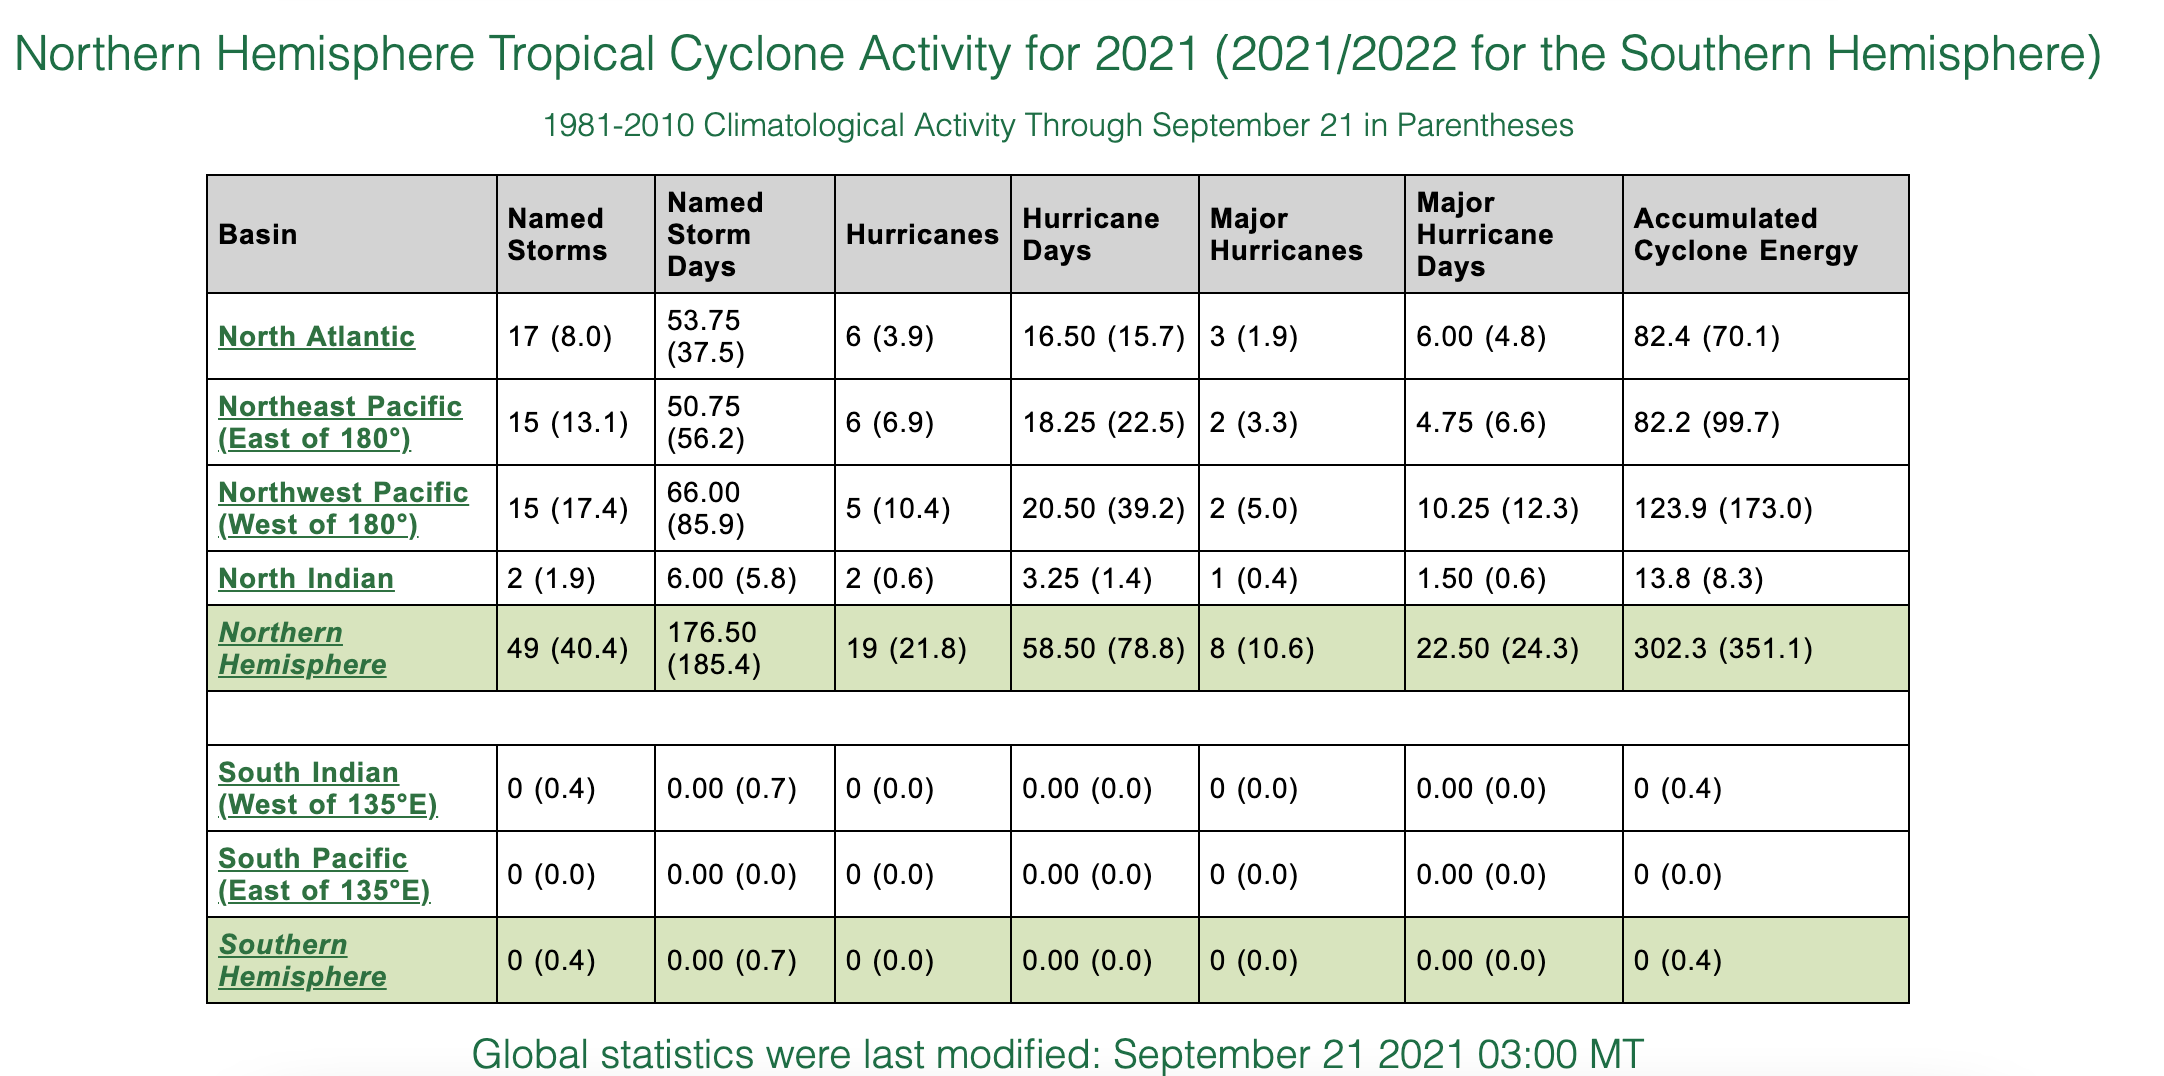
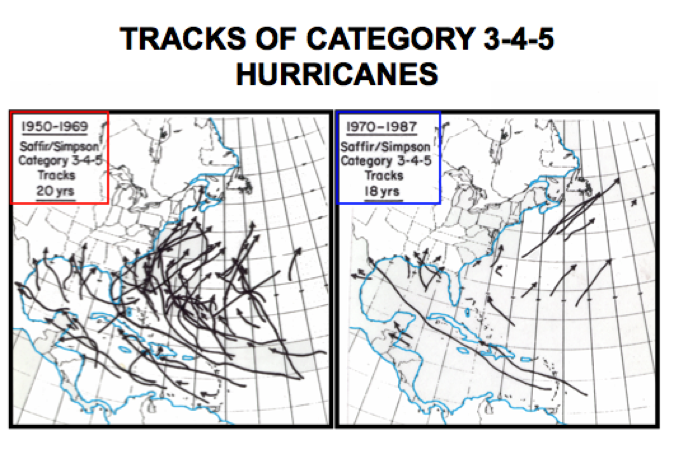
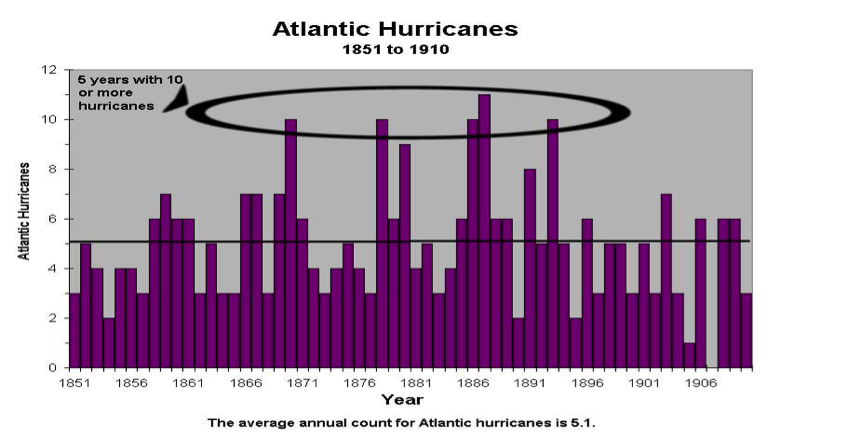
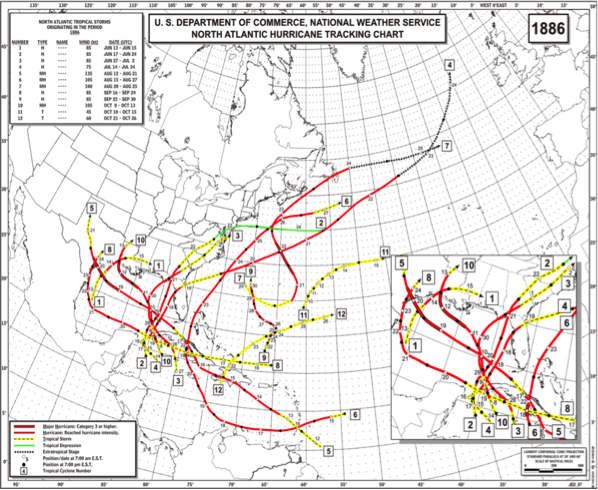
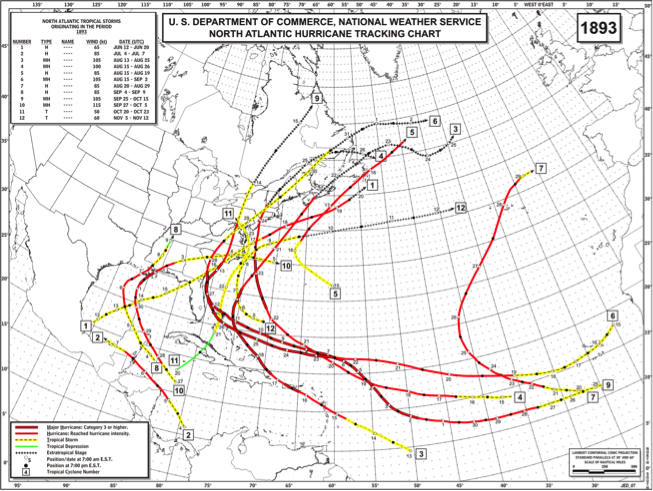
.png)
.png)
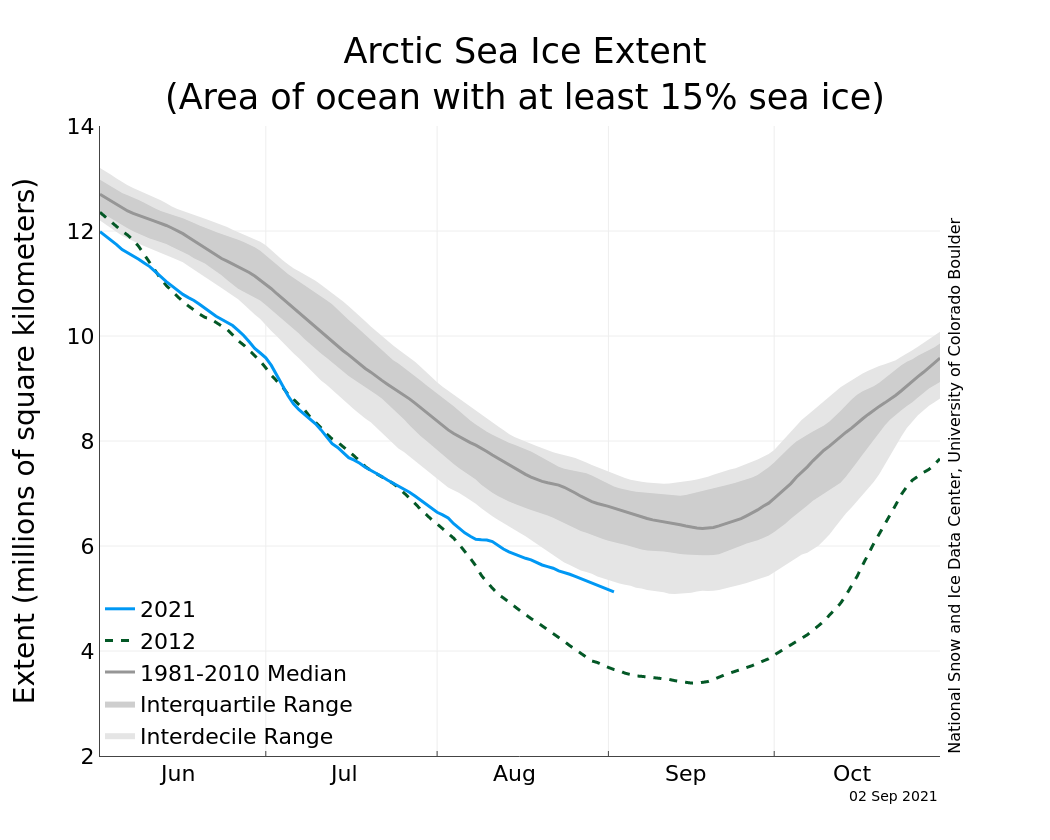
.png)
.png)
.png)
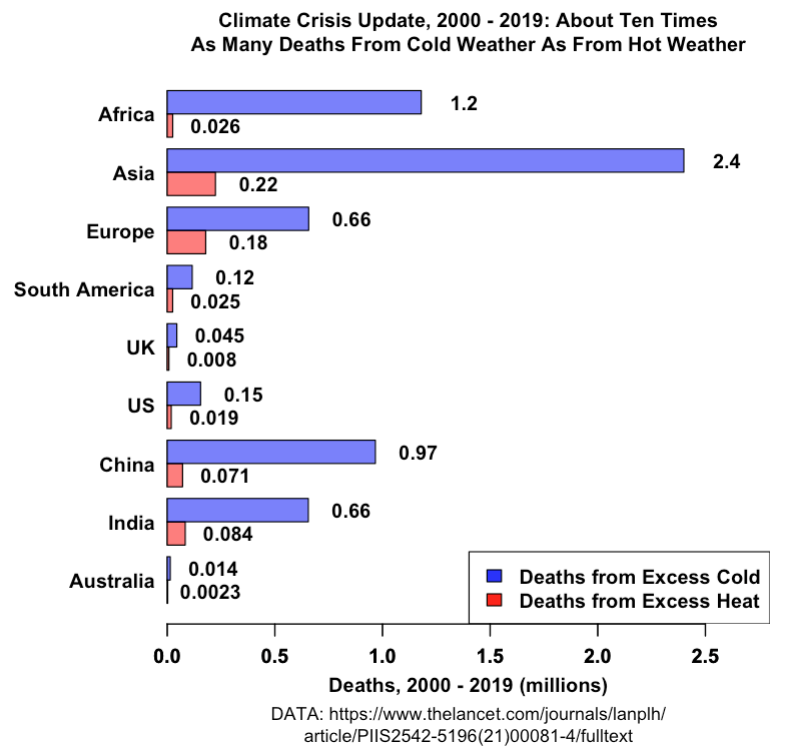
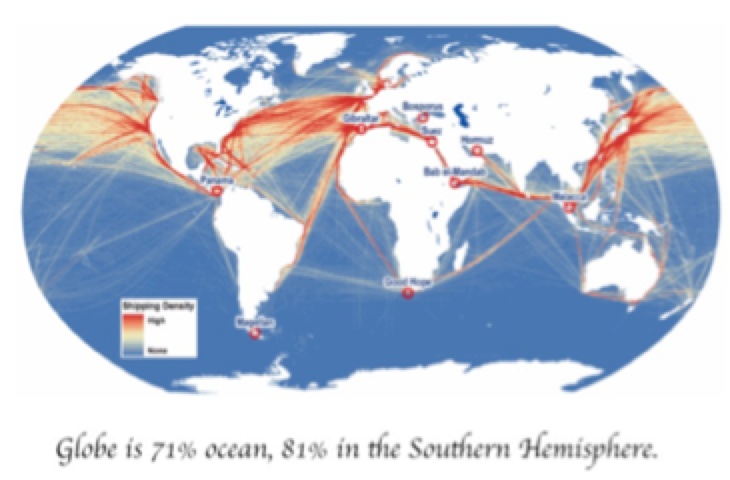
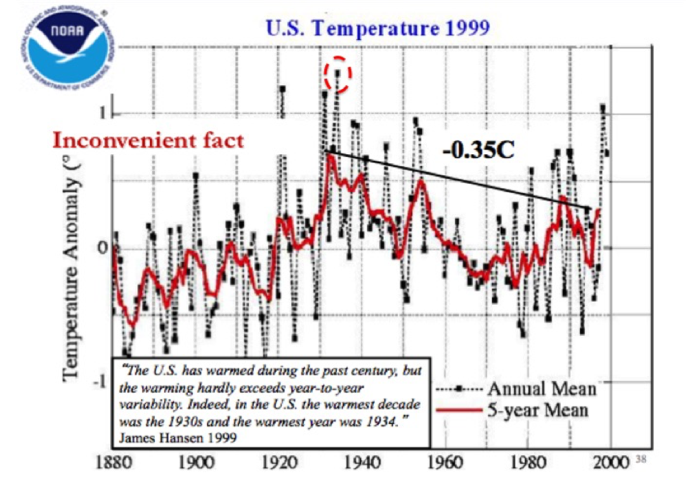
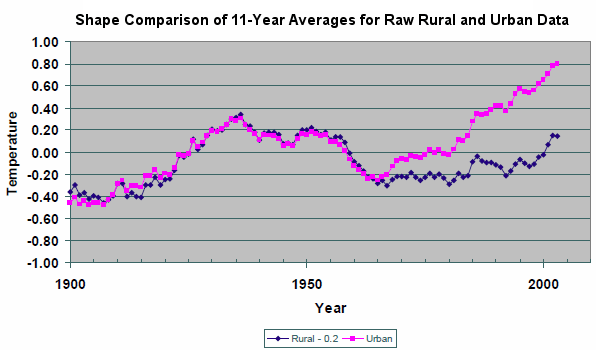
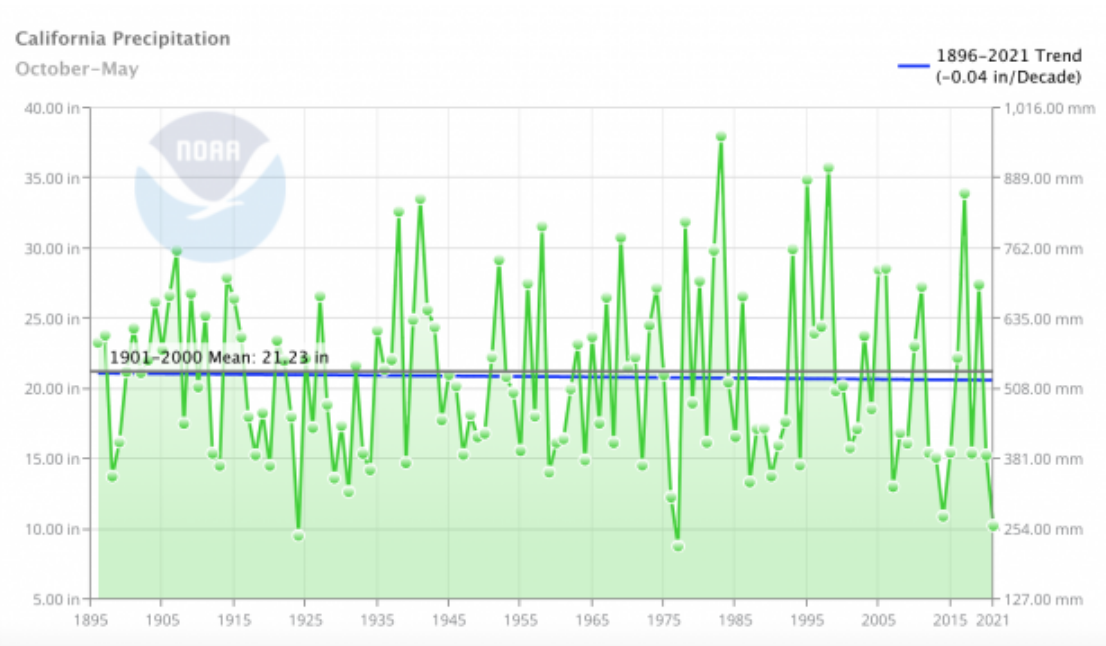
A highly qualified and experienced climate modeler with impeccable credentials has rejected the unscientific bases of the doom-mongering over a purported climate crisis. His work has not yet been picked up in this country, but that is about to change. Writing at the Australian site Quadrant, Tony Thomas introduces the English-speaking world to the truth-telling of Dr. Mototaka Nakamura (hat tip: Andrew Bolt, John McMahon).
There’s a top-level oceanographer and meteorologist who is prepared to cry “Nonsense!” on the “global warming crisis” evident to climate modelers but not in the real world. He’s as well or better qualified than the modelers he criticizes - the ones whose Year 2100 forebodings of 4deg C warming have set the world to spending $US1.5 trillion a year to combat CO2 emissions.
The iconoclast is Dr. Mototaka Nakamura. In June he put out a small book in Japanese on “the sorry state of climate science”. “It’s titled Confessions of a climate scientist: the global warming hypothesis is an unproven hypothesis”, and he is very much qualified to take a stand. From 1990 to 2014 he worked on cloud dynamics and forces mixing atmospheric and ocean flows on medium to planetary scales. His bases were MIT (for a Doctor of Science in meteorology), Georgia Institute of Technology, Goddard Space Flight Centre, Jet Propulsion Laboratory, Duke and Hawaii Universities and the Japan Agency for Marine-Earth Science and Technology. He’s published about 20 climate papers on fluid dynamics.
Today’s vast panoply of “global warming science” is like an upside down pyramid built on the work of a few score of serious climate modelers. They claim to have demonstrated human-derived CO2 emissions as the cause of recent global warming and project that warming forward. Every orthodox climate researcher takes such output from the modelers’ black boxes as a given.
Dr. Nakamura has just made his work available to the English-speaking world:
There was no English edition of his book in June and only a few bits were translated and circulated. But Dr. Nakamura last week offered via a free Kindle version his own version [sic] in English. It’s not a translation but a fresh essay leading back to his original conclusions. See an English translation and interview here.
And the critique he offers is comprehensive.
Data integrity
(AT just published the story of Canada’s Environment Agency discarding actual historical data and substituting its models of what the data should have been, for instance.)
Now Nakamura has found it again, further accusing the orthodox scientists of “data falsification” by adjusting previous temperature data to increase apparent warming “The global surface mean temperature-change data no longer have any scientific value and are nothing except a propaganda tool to the public,” he writes.
The climate models are useful tools for academic studies, he says. However, “the models just become useless pieces of junk or worse (worse in a sense that they can produce gravely misleading output) when they are used for climate forecasting.” The reason:
These models completely lack some critically important climate processes and feedbacks, and represent some other critically important climate processes and feedbacks in grossly distorted manners to the extent that makes these models totally useless for any meaningful climate prediction.
I myself used to use climate simulation models for scientific studies, not for predictions, and learned about their problems and limitations in the process.
Ignoring non-CO2 climate determinants
Climate forecasting is simply impossible, if only because future changes in solar energy output are unknowable. As to the impacts of human-caused CO2, they can’t be judged “with the knowledge and technology we currently possess.”
Other gross model simplifications include
* Ignorance about large and small-scale ocean dynamics
* A complete lack of meaningful representations of aerosol changes that generate clouds.
* Lack of understanding of drivers of ice-albedo (reflectivity) feedbacks: “Without a reasonably accurate representation, it is impossible to make any meaningful predictions of climate variations and changes in the middle and high latitudes and thus the entire planet.”
* Inability to deal with water vapor elements
* Arbitrary “tunings” (fudges) of key parameters that are not understood
Concerning CO2 changes he says,
I want to point out a simple fact that it is impossible to correctly predict even the sense or direction of a change of a system when the prediction tool lacks and/or grossly distorts important non-linear processes, feedbacks in particular, that are present in the actual system…
...The real or realistically-simulated climate system is far more complex than an absurdly simple system simulated by the toys that have been used for climate predictions to date, and will be insurmountably difficult for those naive climate researchers who have zero or very limited understanding of geophysical fluid dynamics. I understand geophysical fluid dynamics just a little, but enough to realize that the dynamics of the atmosphere and oceans are absolutely critical facets of the climate system if one hopes to ever make any meaningful prediction of climate variation.
Solar input, absurdly, is modeled as a “never changing quantity”. He says, “It has only been several decades since we acquired an ability to accurately monitor the incoming solar energy. In these several decades only, it has varied by one to two watts per square meter. Is it reasonable to assume that it will not vary any more than that in the next hundred years or longer for forecasting purposes? I would say, No.”
There is much, much more. Read the whole thing.