


The changes we have discussed are beginning to accelerate. We need to start pressing our politicians, media, educators to move away from the dangerous policies often driven by personal greed as much as ideology,
American Energy Alliance (4/28/21) release: “As the Biden Administration attempts to make good on all of its recent proclamations with respect to global warming and renewable energy, the American Energy Alliance today released the results of a nationwide survey conducted in February of 1,000 voters (3.1% margin of error). The topline results of the survey, conducted by MWR Strategies, are included here.
The results indicate that voters want and expect minimal federal involvement in the energy sector. This sentiment is driven partly by cost considerations, partly by lack of trust in the government’s competence or its intentions, and partly by a strong and durable belief in the efficacy of private sector action. Specific response sets include: Voters don’t want to pay to either address climate change or increase the use of renewable energy. There continues to be limited appetite to pay to address climate change.
When asked what they would be willing to pay each year to address climate change, the median response from voters was 20 dollars. That is very similar to answers we have received to this question over the last few years, which suggests that climate change - despite the rhetoric - has stalled as an issue for most Americans.”
As we show below, the average annual household cost for energy for the Biden/Kerry/AOC is 600 times that level per year and we lose not only energy independence but reliability. This does not include the cost of retrofitting (replacing your cars with electric vehicles, doing away with gas stoves, propane or oil furnaces that get us through the winter). And it feeds soaring for every commodity - food, goods and services. As prices skyrocket (a hidden tax on everyone), wages may edge up but jobs will fall by the wayside. It is a path that leads to energy poverty for those who can least afford it, mainly the low and middle income families and retirees on fixed income. We are already seeing inflation explode.
And all because they have invented an enemy that is actually nature’s greatest benefactor.
Gasoline prices have risen about 35 cents a gallon on average over the last month, according to the AAA motor club, and it is believed could reach $4 a gallon in some states by summer, when many were hoping they could travel again. I just got my first ever $500 ($518) heating oil bill and we keep our thermostat at 66F and have a well insulated home (R5 siding!).
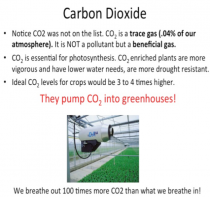
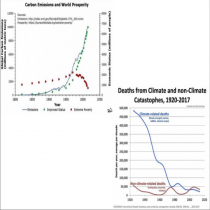
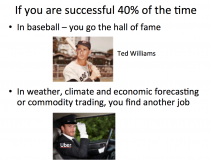
Our government, most every company and the media are talking carbon reduction, even capture. Do we really have a carbon problem?
Ignored Reality about Air Pollution
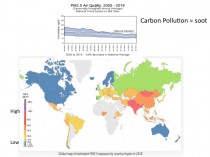
In the post war boom, we had problems with air pollution from factories, coal plants, cars/trucks, inefficient home heating systems and incinerators in apartments. We had air quality issues with pollutants like soot, SO2, ozone, hydrocarbons, NOx, and lead. We set standards that had to be met by industry and automakers. We have the cleanest air in my lifetime and in the world today.
Carbon pollution is not C02 but small particulates (PM2.5). See how US levels have seen it diminish 43% well below the goals we set. The U.S., Scandinavia and Australia have the lowest levels in the world - compare with China, Mongolia and India!
CO2 is a valuable plant fertilizer. We pump CO2 into greenhouses.

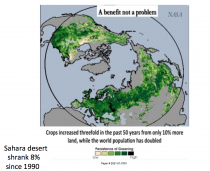
It has caused global greening - the Sahara has shrunk 8% since 1990.
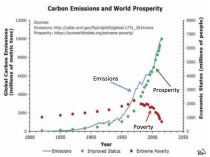
Global prosperity has improved with increased CO2 while poverty declined.
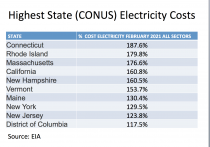
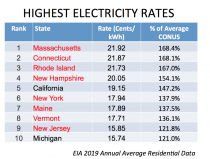
Green carbon taxes or reduction cause electricity prices to rise.
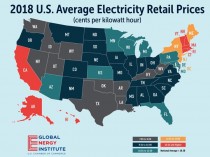
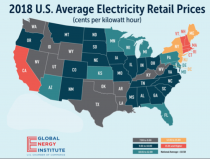
See the RGGI northeast states join crazy green California. The chart shows the average cost of electricity as a percent of the 48 state average.
Under green friendly Biden/Kerry it will get worse. Chamber of Commerce Global Energy Institute’s Energy Accountability Series 2020 projects:
Energy prices would skyrocket under a fracking ban and would be catastrophic for our economy. If such a ban were imposed in 2021, by 2025 it would eliminate 19 million jobs and reduce U.S. Gross Domestic Product (GDP) by $7.1 trillion. Natural gas prices would leap by 324 percent, causing household energy bills to more than quadruple. By 2025, motorists would pay twice as much at the pump ($5/gallon).
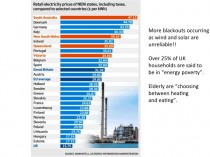
This will lead to soaring energy prices and life-threatening blackouts.
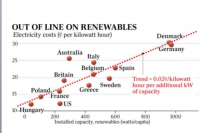
The green countries worldwide have electricity prices three times our levels. We are at the very bottom of the list. But for how long?
If I were to apply the Chamber’s projections to my modest family home and lifestyle, we would pay much more for energy ($13,000 per year!).
Some believe the Obama/Chu goal of $8/gallon gas price could be revived and may even be targeted at $10 which would increase household energy costs another $3000/year. That would not include the cost of forced abandonment of gas-powered vehicles for electric autos, fuel oil or natural gas heating and cooling for electric.
That would be about what many families bring home yearly ($20,000). Not to worry...big government would come to the rescue by subsidizing lower or no income families and adding more to the exploding tax burden for everyone else.

Soaring energy prices would like wherever this green energy frenzy is forced, will lead to life-threatening blackouts (remember Texas in February!). Retirees and lower income families paid the highest % of income (over 40%) for energy now with energy costs low in 2020. They would suffer the worst as other parts of the world learned.

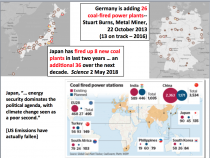
Millions perhaps tens of millions of people working hard to keep you warm in winter and cool in summer will be out of a job. These people helped make the US energy independent for the first time ever. The talk of green jobs is nonsense as Europe found out here. New York Post (4/9/21) reports: “Last week, the Biden administration announced ‘a bold set of actions’ that it said will ‘catalyze’’ the installation of 30,000 megawatts of new offshore wind capacity by 2030.
A White House fact sheet claimed the offshore push will create ‘good-paying union jobs’ and ‘strengthen the domestic supply chain.’ One problem: It didn’t contain a single mention of electricity prices or ratepayers. The reason for the omission is obvious: President Biden’s offshore-wind scheme will be terrible for consumers. If those 30,000 megawatts of capacity get built - which, given the history of scuttled projects like Cape Wind, is far from a sure thing - that offshore juice will cost ratepayers billions of dollars more per year than if that same power were produced from onshore natural-gas plants or advanced nuclear reactors...the cost issue is the one that deserves immediate attention because any spike in electricity prices will have an outsized impact on low- and middle-income consumers. Those price hikes will be particularly painful in New York and New England, where consumers already pay some of America’s highest electricity prices...Thus, the electricity from 30,000 megawatts of offshore wind could cost consumers roughly $7.6 billion more per year than if it came from advanced nuclear reactors and about $11.1 billion more than if it were produced from gas-fired generators.”
By the way, perversely, when families can’t afford to pay for the energy (heating oil, gas or electricity) to heat their homes in winter, they revert to burning wood. This introduces the particulate matter and other ‘pollutants’ we have worked so hard to remove at the source.
Whatsmore we have shown that when we factor in natural cycles in the oceans, on the sun and volcanism, we can explain all the variability the last century (see) meaning CO2 has no effect. We also see no non-natural changes in extremes of weather.
Francis Menton, Manhattan Contrarian
As readers at this site are well aware, the field of climate “science” and alarmism is subject to an extraordinary degree of orthodoxy enforcement, where all information supporting the official narrative gets enthusiastically promoted, while all information disagreeing with the official narrative gets suppressed or attacked. For just one recent example of the latter, see the Wall Street Journal editorial in the current weekend edition reporting on a bogus Facebook “fact check” of the Journal’s recent review of Steven Koonin’s new book “Unsettled.”
In this context, an article just out on May 6 in the journal Science is truly remarkable. The article is titled “Does ocean acidification alter fish behavior? Fraud allegations create a sea of doubt.” It has the byline of Martin Enserink, Science’s international news editor. Science has a long history of publishing every sort of climate alarmism, and of being an unreceptive forum for anything expressing any sort of skepticism, let alone alleging fraud in claims of climate alarm. Something serious must be going on here.
But what if the warming doesn’t happen, or turns out to be far less than the fear-mongers have projected? That’s where “ocean acidification” comes in. “Ocean acidification” is the one allegedly harmful effect of rising atmospheric CO2 that does not stem initially from warming temperatures. Instead, the idea is that increasing CO2 in the atmosphere will somewhat increase the level of CO2 dissolved in the oceans, which in turn will lower the pH of the oceans. How much? Some projections suggest at the extreme end that average ocean pH may go down from a current 8.1 or so, all the way to maybe about 7.75 by 2100. If you know anything about this subject, or maybe took high school chemistry, you will know that pH of 7 is neutral, lower than 7 is acidic, and above 7 is basic. Thus a pH of 8.1 is not acidic at all, but rather (a little) basic; and a pH of 7.75 is somewhat less basic. The fact that anyone would try to apply the scary term of “ocean acidification” to this small projected shift toward neutrality already shows you that somebody is trying to manipulate the ignorant.
See what happens next New Scientific Scandal.
------------
Ever Deeper And Deeper Into “Climate” Fantasy
April 24, 2021/ Francis Menton
It never ceases to amaze me how the very mention of the word “climate” causes people to lose all touch with their rational faculties. And of course I’m not talking here just about the ordinary man on the street, but also, indeed especially, about our elected leaders and government functionaries.
The latest example is President Biden’s pledge, issued at his “World Climate Summit” on April 22, to reduce U.S. greenhouse gas (GHG) emissions by 50 - 52% from the levels of 2005, and to do so by 2030.
In my last post a couple of days ago, I remarked that “Biden himself has absolutely no idea how this might be accomplished. And indeed it will not be accomplished.” Those things are certainly true, but also fail to do full justice to the extent to which our President and his handlers have now left the real world and gone off into total fantasy.
---------
Biden And Kerry Get Humiliated On Earth Day, But Are Too Dumb To Realize It
April 22, 2021/ Francis Menton
Once again, it’s Earth Day. The first such day was 51 years ago, April 22, 1970.
Since that first one, Earth Day has served as an annual opportunity for sanctimonious socialist-minded apocalypticists to issue prophesies of imminent environmental doom. Here from the Competitive Enterprise Institute is a great list of some 50 or so such predictions uttered since the late 1960s, all of which have since been proven wrong. Interestingly, the ones from the time of the first Earth Day mostly concerned overpopulation, famine, and global cooling. Today, those things seem ever so quaint.
Somewhere along the line, the prophesy of a coming ice age faded away, and global warming surged forth as the much more fashionable doomsday prediction. Today, fealty to the global warming apocalypse orthodoxy is a prerequisite for admission to polite society. Our President goes around repeating the mantra that climate change is an “existential threat,” even as he signs Executive Orders and re-directs half the energies of the vast federal government to fight it.
And what better opportunity than the annual return of Earth Day for our great leaders to demonstrate their deep climate change sincerity? Thus last week we had President Biden’s personal climate emissary to the world, John Kerry, traveling to Shanghai to triumphantly welcome China on board with the official plan to “save the planet” through ending the use of fossil fuels; and today, Biden himself has followed up with his Earth Day Climate Summit, a virtual event said to be attended by leaders of some 40 or so nations, including the likes of China, India and Russia. Surely, things have now completely changed course since the evil Trump has been banished, and the world will shortly be saved by the re-invigoration of the glorious Paris Climate Agreement.
JUST IN
See the history by Paul Homewood here
Marc Morano’s ’Green Fraud‘ blockbuster book is also a must read.

AOC’s chief of staff Saikat Chakrabarti revealed that the Green New Deal was not about climate change. The Washington Post reported Chakrabarti’s unexpected disclosure in 2019. “The interesting thing about the Green New Deal,” he said, “is it wasn’t originally a climate thing at all.” He added, “Do you guys think of it as a climate thing? Because we really think of it as a how-do-you-change-the-entire economy thing. “Former Ocasio-Cortez campaign aide Waleed Shahid admitted that Ocasio-Cortez’s GND was a “proposal to redistribute wealth and power from the people on top to the people on the bottom.”
---------
This echoed IPCC official Ottmar Edenhofer who in November 2010 admitted “one has to free oneself from the illusion that international climate policy is environmental policy.” Instead, climate change policy is about how “we redistribute de facto the world’s wealth.” UN Climate Chief Christiana Figueres said “Our aim is not to save the world from ecological calamity but to change the global economic system (destroy capitalism).”
The evidence about the fraud is mounting but don’t expect coverage in the media. A must see A CLIMATE AND ENERGY PRIMER FOR POLITICIANS AND MEDIA by contributing author Allan MacRae Allan is a highly respected energy leader in Canada who has worked with true climate experts and has helped make Alberta the shining star of Canadian energy over the decades. There too the politicians and media and the public have been programmed by false claims and green energy frauds and are willing to toss the low cost clean fossil fuel energy legacy out and replace it with unreliable and expensive green energy.
Greens expect population to adapt its consumption to the available supply and simply come to accept rationing and power interruptions, of the sort that are unfortunately still common in underdeveloped countries. They insist that is the necessary price for averting the phoney climate apocalypse.
See also Stephen Moores’ Follow the Climate Change Money here. This is something Eisenhower warned about in his Farewell address:
“The prospect of domination of the nation’s scholars by Federal employment, project allocations, and the power of money is ever present - and is gravely to be regarded.”
----------
COLLEGE OF ENGINEERING, CARNEGIE MELLON UNIVERSITY
For decades, climate change researchers and activists have used dramatic forecasts to attempt to influence public perception of the problem and as a call to action on climate change. These forecasts have frequently been for events that might be called “apocalyptic,” because they predict cataclysmic events resulting from climate change.
In a new paper published in the International Journal of Global Warming, Carnegie Mellon University’s David Rode and Paul Fischbeck argue that making such forecasts can be counterproductive. “Truly apocalyptic forecasts can only ever be observed in their failure--that is the world did not end as predicted,” says Rode, adjunct research faculty with the Carnegie Mellon Electricity Industry Center, “and observing a string of repeated apocalyptic forecast failures can undermine the public’s trust in the underlying science.”
Rode and Fischbeck, professor of Social & Decision Sciences and Engineering & Public Policy, collected 79 predictions of climate-caused apocalypse going back to the first Earth Day in 1970. With the passage of time, many of these forecasts have since expired; the dates have come and gone uneventfully. In fact, 48 (61%) of the predictions have already expired as of the end of 2020.
Fischbeck noted, “from a forecasting perspective, the ‘problem’ is not only that all of the expired forecasts were wrong, but also that so many of them never admitted to any uncertainty about the date. About 43% of the forecasts in our dataset made no mention of uncertainty.”
In some cases, the forecasters were both explicit and certain. For example, Stanford University biologist Paul Ehrlich and British environmental activist Prince Charles are serial failed forecasters, repeatedly expressing high degrees of certainty about apocalyptic climate events.
Rode commented “Ehrlich has made predictions of environmental collapse going back to 1970 that he has described as having ‘near certainty’. Prince Charles has similarly warned repeatedly of ‘irretrievable ecosystem collapse’ if actions were not taken, and when expired, repeated the prediction with a new definitive end date. Their predictions have repeatedly been apocalyptic and highly certain...and so far, they’ve also been wrong.”
The researchers noted that the average time horizon before a climate apocalypse for the 11 predictions made prior to 2000 was 22 years, while for the 68 predictions made after 2000, the average time horizon was 21 years. Despite the passage of time, little has changed--across a half a century of forecasts; the apocalypse is always about 20 years out.
Fischbeck continued, “It’s like the boy who repeatedly cried wolf. If I observe many successive forecast failures, I may be unwilling to take future forecasts seriously.
That’s a problem for climate science, say Rode and Fischbeck.
“The underlying science of climate change has many solid results,” says Fischbeck, “the problem is often the leap in connecting the prediction of climate events to the prediction of the consequences of those events.” Human efforts at adaptation and mitigation, together with the complexity of socio-physical systems, means that the prediction of sea level rise, for example, may not necessarily lead to apocalyptic flooding.
“By linking the climate event and the potential consequence for dramatic effect,” noted Rode, a failure to observe the consequence may unfairly call into question the legitimacy of the science behind the climate event.”
With the new Biden administration making climate change policy a top priority, trust in scientific predictions about climate change is more crucial than ever, however scientists will have to be wary in qualifying their predictions. In measuring the proliferation the forecasts through search results, the authors found that forecasts that did not mention uncertainty in their apocalyptic date tended to be more visible (i.e., have more search results available). Making sensational predictions of the doom of humanity, while scientifically dubious, has still proven tempting for those wishing to grab headlines.
The trouble with this is that scientists, due to their training, tend to make more cautious statements and more often include references to uncertainty. Rode and Fischbeck found that while 81% of the forecasts made by scientists referenced uncertainty, less than half of the forecasts made by non-scientists did.
“This is not surprising,” said Rode, “but it is troubling when you consider that forecasts that reference uncertainty are less visible on the web. This results in the most visible voices often being the least qualified.”
Rode and Fischbeck argue that scientists must take extraordinary caution in communicating events of great consequence. When it comes to climate change, the authors advise “thinking small.” That is, focusing on making predictions that are less grandiose and shorter in term. “If you want people to believe big predictions, you first need to convince them that you can make little predictions,” says Rode.
Fischbeck added, “We need forecasts of a greater variety of climate variables, we need them made on a regular basis, and we need expert assessments of their uncertainties so people can better calibrate themselves to the accuracy of the forecaster.”
----------------
Note: Mark Perry on Carpe Diem here listed 18 major failures.
Here he worked with CEI to compile 50 predictions of catastrophes that failed here.
“Most of the people who are going to die in the greatest cataclysm in the history of man have already been born,” wrote Paul Ehrlich in a 1969 essay titled “Eco-Catastrophe! “By...[1975] some experts feel that food shortages will have escalated the present level of world hunger and starvation into famines of unbelievable proportions. Other experts, more optimistic, think the ultimate food-population collision will not occur until the decade of the 1980s.”
Erlich sketched out his most alarmist scenario for the 1970 Earth Day issue of The Progressive, assuring readers that between 1980 and 1989, some 4 billion people, including 65 million Americans, would perish in the “Great Die-Off.”
“It is already too late to avoid mass starvation,” declared Denis Hayes, the chief organizer for Earth Day, in the Spring 1970 issue of The Living Wilderness.
Leonard Nimoy talked about the coming ice age in 1979 here.
Tony Heller exposes the fraudsters here:
Note the story below in the USA TODAY by Jason Hayes is worth a read. See also this excellent summary by Chris Martz.
Common-sense has already lost to political considerations - and people across Texas and the Great Plains are paying the price.
Jason Hayes Opinion contributor
It’s not just a cold front. Over a decade of misguided green energy policies are wreaking havoc in Texas and the lower Midwest right now - despite non-stop claims to the contrary.
The immediate cause for the power outages in Texas this week was extreme cold and insufficient winterization of the state’s energy systems. But there’s still no escaping the fact that, for years, Texas regulators have favored the construction of heavily subsidized renewable energy sources over more reliable electricity generation. These policies have pushed the state away from nuclear and coal and now millions in Texas and the Great Plains states are learning just how badly exposed they are when extreme weather hits.
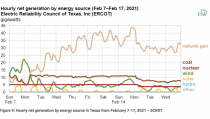
Renewable’s defenders retort that Texas’ wind resource is “reliably unreliable.” Translation: It can’t be counted on when it’s needed most. The state has spent tens of billions of dollars on wind turbines that don’t work when millions of people desperately need electricity. As the cold weather has gotten worse, half the state’s wind generation has sat frozen and immobile. Where wind provided 42% of the state’s electricity on Feb. 7, it fell to 8% on Feb.11.
The Texas power outage was inevitable
Unsurprisingly, the failure of wind has sparked a competing narrative that fossil fuel plants were the real cause of power outages. This claim can be quickly dispelled with a look at data from ERCOT, the state’s electricity regulator. Even though the extreme cold had frozen cooling systems on coal plants and natural gas pipelines, the state’s coal plants still upped their output by 47% in response to increasing demand. Natural gas plants across the state increased their output by an amazing 450%. Fossil fuels have done yeoman’s work to make up for wind’s reliable unreliability.
Sadly, even these herculean efforts weren’t enough. The loss of wind has been compounded by the loss of some natural gas and coal generation, and one nuclear reactor, which experienced a cold-related safety issue and shut down. Things are improving, but rolling power outages are still impacting millions. Had the state invested more heavily in nuclear plants instead of pushing wind power, Texans would have ample, reliable, safe, emission-free electricity powering their lives through the cold. Instead, over 20 have died.
This sad outcome was inevitable. Renewable energy sources have taken off in popularity largely because of state mandates and federal subsidies. As they’ve become more popular, reliable energy like nuclear power and coal have felt the squeeze.
Last year, wind overtook coal as Texas’ second largest source of electricity generation. The most recent federal data indicates that, in October last year, natural gas provided 52% of the Lonestar state’s electricity, while wind generated about 22%, coal kicked in 17%, and nuclear added 8%. The rise of wind means unreliable energy is increasingly relied on for the energy grid.
Texas rolled by winter storms:A dispatch from my frozen living room
This won’t be the last power crisis
The Texas energy crisis isn’t a one-off, either. The same thing happened in 2019 when Michigan endured the Polar Vortex. Extreme cold paired with limited natural gas supplies and non-existent renewable energy. Residents all received text messages warning them to reduce their thermostats to 65F or less to stave off a system wide failure.
California’s rolling blackouts last summer are another example. Dwindling solar generation in late afternoon, shuttered nuclear plants, and insufficient supply from gas plants could not compete with rising energy demands due to extreme heat.
And then there’s Joe Biden’s $2 trillion promise to wean America off reliable energy. If Biden’s aggressive climate plan is enacted, it will push tens of thousands of wind turbines and millions of solar panels in an expensive effort to achieve net zero emissions from the nation’s electricity sector by 2050. But doing this will only further spread the problems that Texans are currently experiencing.
America can’t go down this foolish road. Common-sense has already lost to political considerations - and people across Texas and the Great Plains are paying the price. They aren’t the first victims, and they certainly won’t be the last, if politicians continue to push unreliable renewable energy instead of the reliable sources families need to stay warm and live their lives. A green future shouldn’t be this dark.
Jason Hayes is the director of environmental policy at the Mackinac Center for Public Policy.
Also see A CLIMATE AND ENERGY PRIMER FOR POLITICIANS AND MEDIA by contributing author Allan MacRae Allan is a highly respected energy leader in Canada who has worked with true climate experts and has helped make Alberta the shining star of Canadian energy over the decades. There too the politicians and media and the public have been programmed by false claims and green energy frauds and are willing to toss the low cost clean fossil fuel energy legacy out and replace it with unreliable and expensive green energy. Greens expect population to adapt its consumption to the available supply and simply come to accept rationing and power interruptions, of the sort that are unfortunately still common in underdeveloped countries. They insist that is the necessary price for averting the phoney climate apocalypse.
---------
Biden was the sheriff managing the failed $800B Obama stimulus which led to 77 bankruptcies including Solyndra. The same will happen on a larger scale with the $3T plan today. People will die in our extreme climate areas.
With years of experience in Europe about big wind failures and long term issues, this story about What happens to all the old wind turbines?. Also note, solar panels contains toxic rare earth metals that can’t be disposed of at the local .. See this story
The blackouts, which have left as many as 4 million Texans trapped in the cold, show the numerous chilling consequences of putting too many eggs in the renewable basket.
By Jason Isaac, The Federalist
FEBRUARY 18, 2021
As Texans reel from ongoing blackouts at the worst possible time, during a nationwide cold snap that has sent temperatures plummeting to single digits, the news has left people in other states wondering: How could this happen in Texas, the nation’s energy powerhouse?
But policy experts have seen this moment coming for years. The only surprise is that the house of cards collapsed in the dead of winter, not the toasty Texas summers that usually shatter peak electricity demand records.
The blackouts, which have left as many as 4 million Texans trapped in the cold, show the numerous chilling consequences of putting too many eggs in the renewable basket.
Fossil Fuels Aren’t to Blame
There are misleading reports asserting the blackouts were caused by large numbers of natural gas and coal plants failing or freezing. Here’s what really happened: the vast majority of our fossil fuel power plants continued running smoothly, just as they do in far colder climates across the world. Power plant infrastructure is designed for cold weather and rarely freezes, unlike wind turbines that must be specially outfitted to handle extreme cold.
It appears that ERCOT, Texas’s grid operator, was caught off guard by how soon demand began to exceed supply. Failure to institute a managed rolling blackout before the grid frequency fell to dangerously low levels meant some plants had to shut off to protect their equipment. This is likely why so many power plants went offline, not because they had failed to maintain operations in the cold weather.
Yet these operational errors overshadow the decades of policy blunders that made these blackouts inevitable. Thanks to market-distorting policies that favor and subsidize wind and solar energy, Texas has added more than 20,000 megawatts (MW) of those intermittent resources since 2015 while barely adding any natural gas and retiring significant coal generation.
Increased Reliance on Unreliable Renewables
On the whole, Texas is losing reliable generation and counting solely on wind and solar to keep up with its growing electricity demand. I wrote last summer about how ERCOT was failing to account for the increasing likelihood that an event combining record demand with low wind and solar generation would lead to blackouts. The only surprise was that such a situation occurred during a rare winter freeze and not during the predictable Texas summer heat waves.
Yet ERCOT still should not have been surprised by this event, as its own long-term forecasts indicated it was possible, even in the winter. Although many wind turbines did freeze and total wind generation was at 2 percent of installed capacity Monday night, overall wind production at the time the blackouts began was roughly in line with ERCOT forecasts from the previous week.
We knew solar would not produce anything during the night, when demand was peaking. Intermittency is not a technical problem but a fundamental reality when trying to generate electricity from wind and solar. This is a known and predictable problem, but Texas regulators fooled themselves into thinking that the risk of such low wind and solar production at the time it was needed most was not significant.
Special Breaks Helped Cause the Blackouts
The primary policy blunder that made this crisis possible is the lavish suite of government incentives for wind and solar. They guarantee profits to big, often foreign corporations and lead to market distortions that prevent reliable generators from building the capacity we need to keep the lights on when wind and solar don’t show up.
Research by the Texas Public Policy Foundation’s Life: Powered project found that more than $80 billion of our tax dollars have been spent on wind and solar subsidies in the last decade, in federal subsidies alone. Texans are also charged an average of $1.5 billion a year in state subsidies for renewable energy.
All that cash hasn’t materially changed our energy landscape. Wind and solar still provide just 4 percent of our energy nationwide. The promise that subsidies would kickstart renewable energy technology remains unmet after more than 40 years.
Renewable advocates will be quick to point out that fossil fuels also receive subsidies from the federal government. That’s partially true, but solar companies receive 75 times more money and wind 17 times more per unit of electricity generated. Nevertheless, the best solution for Texans, and all Americans, would be to eliminate all energy subsidies and allow the free market to drive our energy choices.
As politically popular as wind and solar energy are, no amount of greenwashing can cover up their fundamental unreliability and impracticality for anything other than a supplemental energy source. Yet our government even in the oil country of Texas, home of Spindletop and the Permian Basin is designed to incentivize renewable energy projects.
Keep This from Happening Again
This week’s blackouts should be a wakeup call to politicians. Overconfidence in renewables led us uncomfortably close to total grid failure - and when the going gets tough, few things really matter to voters as much as access to electricity. Without it, scrambling for the barest necessities like food, water, and warmth becomes expensive, stressful, and all-consuming.
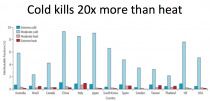
The consequences are potentially deadly. For all the talk of climate change, cold is far deadlier than heat, responsible for 20 times more deaths. Although the cold itself may not kill you - you might not literally freeze to death - it has devastating potential to exacerbate pre-existing conditions and make otherwise minor illnesses life-threatening.
It’s a reality far too many know firsthand, as a recent study found increasing natural gas utility prices led to an increase in wintertime deaths as they force families to choose between putting food on the table and paying the heat bill. In this health-conscious era of the COVID-19 crisis, this should be enough to pause any policy discussion that might inhibit electricity access.
Here’s What to Do
The Texas legislature, and other states hoping to avoid similar messes, should act decisively to protect our electric grid in a few specific ways. First, they should require all electric generation to be “dispatchable,” or readily available - meaning generators guarantee a certain amount of power will be available at all times. No more should we tolerate wind turbines pumping out a measly 2 percent of their capacity and leaving Texas families in the cold.
Second, they should end subsidies for both renewable and traditional energy sources. Research by the Texas Public Policy Foundation explains extensively the problems with energy subsidies, including distorting markets without improving technology or shifting our energy landscape in the slightest. Rather than wasting tax dollars trying (and failing) to pick winners and losers, lawmakers should allow the free market to work.
Finally, they should work to discourage the discriminatory practice of environmental, social, and governance (ESG) investing, which prioritizes political correctness over fiduciary duty and places workers’ and retirees’ futures at risk. Texas and several other states will file legislation soon to prohibit companies that boycott or divest from fossil fuels from doing business with the government. It’s a good start to ensure this energy discrimination campaign doesn’t infiltrate state pensions and investments.
Especially in the bitter cold of winter, a life without electricity is a miserable one. It’s unfortunate that years of poor policy choices - coupled with ERCOT’s mismanagement - made this crisis a reality for so many Texans.
Texans learned firsthand the consequences of unreliable renewable energy this week. If their voices are heard, it won’t happen again.
Jason Isaac is director of Life![]() owered, a national initiative of the Texas Public Policy Foundation to raise America’s energy IQ. He previously served four terms in the Texas House of Representatives.
owered, a national initiative of the Texas Public Policy Foundation to raise America’s energy IQ. He previously served four terms in the Texas House of Representatives.
----------
See also in the Asia Times this warning. The green’s arrogance and disdain for people is maddening:
“Climate activists such David McDermott Hughes have come up with a much cheaper and quicker solution: Abandon the traditional goal of providing a reliable energy supply to meet the demands of society. Instead, require the population to adapt its consumption to the available supply.
Under this prescription the US population should simply come to accept rationing and power interruptions, of the sort that are unfortunately still common in underdeveloped countries. That would be the necessary price for averting the climate apocalypse.”
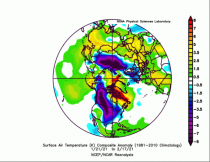
By Joseph D’Aleo, CCM
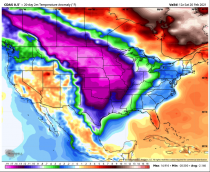
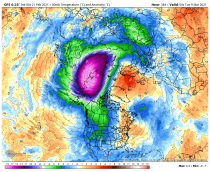
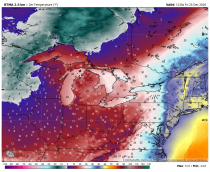
See the February temperature anomalies (as much as 36F below normal to 02/20). It reached down to Oklahoma and Texas with deadly results with ice and cold freeing wind turbines and snow covering solar panels.
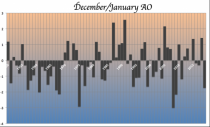
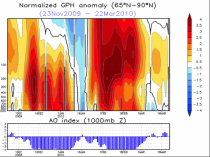
We had our stratospheric warming in January after a lower level preview in mid-December. See the result is the arctic oscillation going negative.See the result is the arctic oscillation going negative (line graph beneath the maps).
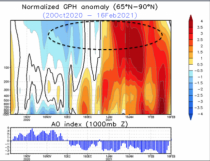
See the warming at 50mb.
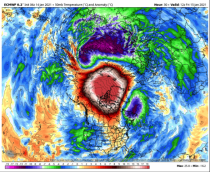
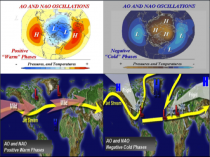
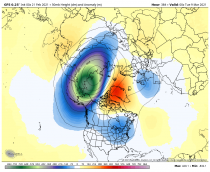
Warmings cause pressure to rise in the polar atmosphere that deliver cold air to mid latitudes (right) replacing the flat zonal flow with a cold arctic (left) which brings ocean modified air inland.
See the result the last month at the ground level.
See the cold plume into North America kept slightly west by the La Nina southeast ridge.
See how the AO was more negative that anytime since 2008-2010.
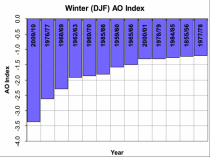
See the 2009/10 warming and persistent -AO.
2009/10 was most negative since 1976/77.
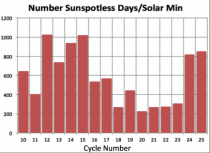
The warmings are more frequent near solar max and solar min.
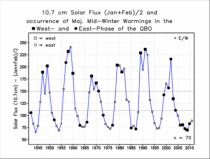
The solar grand max was in the last century after a quiet start. See the deeper Dalton minimum in the early 1800s and the long Maunder in 1600s.
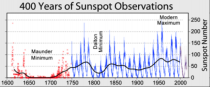
The cycles have been diminishing as it did early in the last two centuries.
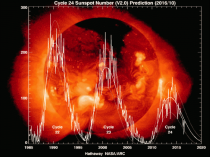
We have had longer minima with more sunspotless days.
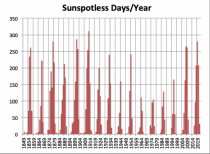
See how the min years the last two cycles have ranked among the highest. This min is not over yet and the number will climb more.
By the way the stratosphere has cooled but will warm again - another mid to late March flip? Happened in other years - late 1950s.
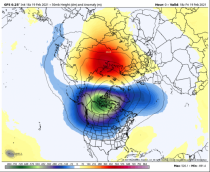
Warming in forecast high up in the Atlantic sector (affecting NAO?)
Here is an excellent example of what is really happening shortly after the election while the party distracts you with a unconstitutional impeachment show with the media’s complicit participation.
See here the American Action Forum estimates that, between 2020 and 2029, the energy and environmental components of the Democrat’s Green New Deal would cost $8.3 trillion to $12.3 trillion, or $52,000 to $72,000 per household. The total GND program, including the jobs and “social justice” policies, would cost $51.1 trillion to $92.9 trillion, or $316,010 to $419,010 per household.
Joseph D’Aleo, CCM
Just hours after an inauguration took place, executive orders are issued to stop the Keystone Pipeline and to rejoin the Paris Accord - which is just an attempt to extort money from countries like the US while allow other volunteer countries like China to set a goal to join to pay in a decade or more or never. The U.S. has the cleanest air in the world thanks to natural gas, while the green countries use coal to keep the lights on and have poorer air quality. The Paris Accord is just another leftist wealth transfer program.
We are told that major changes to our energy policies are necessary to move away from carbon based fossil fuels to wind and solar to save the planet from carbon pollution and resulting catastrophic climate changes. We are told that green energy will save us money because the sun and wind are free and that removing carbon dioxide from the air will save lives. Each of these claims are easily proven wrong with real world examples. The science is seriously flawed and the policies produce the exact opposite, costly even dangerous results. Already many in the oil sector are losing their jobs. Biden suggests they should consider learning how to code. Kerry suggests they build solar panels, hoping you forgot Solyndra and dozens of other renewable bankruptcies when Obama tried that. The media has hyped significant natural events and changes and blamed them on claims of record warming as advertised by the segment of activists in the once honest universities and professional societies, and in the no longer trustworthy climate groups at NOAA and NASA and too many in the public believe it is real.
But the linkage is not to be trusted. What is ignored is the lack of long term global temperature data to make any reasonable assessment. Data before the 1980s was primarily in the US and Europe and parts of Australia and very little data in the oceans which cover 71% of the globe.
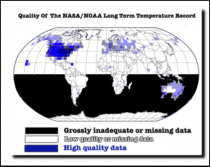
The first attempts to assess global trends recognized that data was an issue and the analysis was confined to northern hemisphere land areas (mostly U.S. and parts of Europe). It showed strong warming and then a corresponding cooling trend during the period from the 1880s to 1970s.
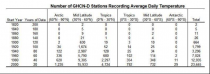
The number of stations increased in the 20th century though they increasingly were located in urban areas or nearby airports subject to local urban heat island contamination.
Enlarged
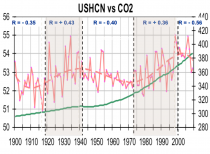
You see in the U.S. high density data set with the longest history of record, the temperatures changed in the same direction with CO2 only 40% of the time.
After 1980s satellites began sensing ocean surface temperatures when clouds permitted and later after 2000 a network of global buoys provided real time accurate ocean temperature. It was the first time we could claim true global coverage but other problems developed and models were incorporated and when you combine varied data with models, there is opportunity for mischief. We discussed the global data issues here and long ago here.
A rigorous peer reviewed analysis here failed to find that the steadily rising atmospheric CO2 Concentrations have had a statistically significant impact on any of the 13 critically important temperature time series analyzed.
The climate changes in multidecadal and longer cycles related to the sun and oceans and influenced by volcanism. As for claims that extremes of weather are increasing as the earth warms, they can be easily refuted with real world data and natural factors as we did here.
One of the biggest threats to our countries economy will be skyrocketing energy costs and through that further loss of jobs, with the economy already reeling from shutdowns and COVID and radical rioting related small business failures and now executive orders. In this country, the early previews of this is in the states with early green energy commitments and carbon reduction or hidden taxes. California is the best known example but the northeast (red on the table) with the Regional Greenhouse Gas Initiative show the highest electricity prices by far.

Globally our country’s average electricity prices have been the lowest with the heavily invested green countries up to 5 times higher. Renewable states are subject to brownouts and blackouts (California leads the states as blackouts are implemented during wildfire threats). Globally blackouts and brownouts are common as the wind and sun are not reliable. The high cost of electricity drives industry to countries like China and India where costs are low because they use coal, reliable and cheap.

You may recall that the economist Gabriel Calzada Associate Professor of Economics at the King Juan Carlos University in Spain in 2010 estimated every green job created cost Spain $774,000 in subsidies. But resulted in a loss of 2.2 real jobs. Only 1 in 10 green jobs was permanent. Industry left and Spain and unemployment rose to 27.5%. In Italy 3.4 real jobs were lost.
The energy costs are not limited to electricity as the elimination of fossil fuels would lead to a forced transition to electric cars further increasing the demand on electricity. Obama had gasoline prices up to $5 and predicted within 2 years everyone would be driving electric cars with his administration predicting $8/gasoline. Instead thank to fracking and then in 2020 COVID forced work at home, gas prices dropped instead to $2 or lower during President Trump’s term, when we finally achieved true energy independence. But that will soon disappear.

Many ‘green’ countries were forced to slow or even halt the move to green and build coal plants to provide energy when the sun doesn’t shine or wind blow.

When the power is out, people are subject to the danger from winter cold. The danger associated with a ‘heat kills’ misdirection is that cold weather kills 20 times as many people as hot weather, according to an international study analyzing over 74 million deaths in 384 locations across 13 countries. The findings were published in the Lancet. Many households are said to be in “energy poverty” (25% UK, 15% Germany). The elderly forced to “choose between heating and eating” as they sit in their home in their coats and sweaters.
Canada, United States and the UK Winter Mortality is very real.

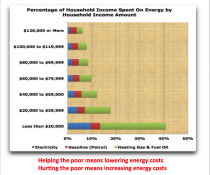
It is very clear the people who get hurt the most are those who can least afford it. Households with income of less than $20,000/year spend over 40% of their income on energy.
The Chamber of Commerce’s Global Energy Institute concludes “simply put, a ban on fracking in the United States would be catastrophic for our economy”.
“Our analysis shows that if such a ban were imposed in 2021, by 2025 it would eliminate 19 million jobs and reduce U.S. Gross Domestic Product (GDP) by $7.1 trillion. Job losses in major energy producing states would be immediate and severe; in Texas alone, more than three million jobs would be lost. Tax revenue at the local, state, and federal levels would decline by nearly a combined $1.9 trillion, as the ban cuts off a critical source of funding for schools, first responders, infrastructure, and other critical public services.
Energy prices would also skyrocket under a fracking ban. Natural gas prices would leap by 324 percent, causing household energy bills to more than quadruple. By 2025, motorists would pay twice as much at the pump ($5/gallon +).”
In the last few years, the average household thanks to lower taxes, record low unemployment, and cheap energy averaged increases of $4500/year/family. Now the cost due to the new policy driven increases for electricity, heating fuels and gasoline - families will see losses as high as $10,000/year by 2024. Working from home would limit this some for the immediate future but it is clear the forced move to green energy comes with a huge price. This is true even before we consider the huge cost of the materials to build turbines and solar farms. It has been even suggested by a Biden appointee we build the wind and solar plants in the country’s beautiful national parks.
I have influential friends and leaders in many countries in five continents, where the greens have run wild. They envied our country and hoped their countries would see our advantage and reconsider and instead adopt our approach. They are shocked our country did not recognize how good we had it. One friend posted on a fellow site: “… We stand at the abyss. A Biden regime will be the end of freedom. Europe and Canada have already fallen far down that “poverty road to Venezuela”. If America falls, there will be nowhere left to run to.”
SURFACE TEMPERATURE RECORDS: POLICY-DRIVEN DECEPTION?
This paper was a compilation of analyses relative to the data sets used for formulating and implementing unprecedented policy decisions seeking a radical transformation of our society and institutions. It was necessitated by the extraordinary revelations in the released CRU emails, including the admissions of Ian “Harry” Harris, the CRU programmer. He lamented about
“[The] hopeless state of their (CRU) database. No uniform data integrity, it’s just a catalogue of issues that continues to grow as they’re found” and “Aarrggghhh! There truly is no end in sight. This whole project is SUCH A MESS. No wonder I needed therapy!” CRU member, Phil Jones, candidly confessed in a BBC interview that “his surface temperature data are in such disarray they probably cannot be verified or replicated.”
This reflects on both NOAA and NASA in the United States. Phil Jones also admits that
“Almost all the data we have in the CRU archive is exactly the same as in the GHCN archive used by the NOAA National Climatic Data Center” and that NASA’s GISS uses the GHCN, applying its own adjustments, as it explains: “The current analysis uses surface air temperatures measurements from the following datasets: the unadjusted data of the Global Historical Climatology Network (Peterson and Vose, 1997 and 1998), United States Historical Climatology Network (USHCN) data, and SCAR (Scientific Committee on Antarctic Research) data from Antarctic stations.”
The paper is also a natural progression of the ongoing work of the authors, who have focused on actual data instead of models and theories. Anthony Watts put together a volunteer team to do the due diligence the government said it could not afford on the stations and found the vast majority (90%) to be sited poorly by the governments own standards. He has documented issues with the equipment and shelters and he and his Watts Up With That bloggers have documented many station issues created by post-processing of raw data.
Joe D’Aleo was inspired many years ago by association with the father of Climatology, Helmut Landsberg, to study the effects of urbanization and land use changes on microclimates. He has tracked research on data quality issues including station dropout, increasingly missing months and contamination by urbanization and land use changes. Joe has alerted NOAA and the EPA about poor integrity of the data bases.
Also as a contributing programmer/researcher, E.M. Smith has been working with the NOAA Global Historical Climate Network (GHCN) and NASA’s GIStemp program for processing the NOAA global data. Smith’s forensic background and skills allowed him to parse the data by country, latitude and elevation characteristics. Watts and Smith are intimately familiar with the poor metadata, which makes the critical analysis of the historical record and data
adjustments challenging or even impossible.
This paper inspired and motivated others toward a more in depth look into the data and methodology - a positive and welcome development long overdue. CRN was introduced but is now hard to find in useful forms. ARGO Buoys provided the important global ocean data coverage but the data set like other data sets like USHCN v1 that had an adjustment for UHI and new technological advances for getting at other data like UAH/RSS satellite derivations of lower tropospheric temperatures, measure from space of sea levels get ‘adjusted’ to better fit the modelling instead of motivating changes to the theory and GHG models which greatly overdo the natural cyclical warming.
One of the addendum studies related to the shocking differences for CPK temperatures from the different data sets like raw observations, USHCNv1 with UHI and USHCNv2 with homogenization replacing UHI and GHCN with no UHI.
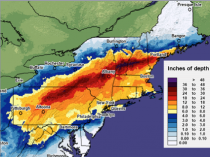
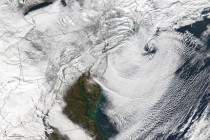
The December 18th storm had an amazing band of very heavy snow in the arctic air.
Observers in cities and towns in PA, NY and New England:
19 locations reported over 40 inches
126 locations reported over 30 inches
219 reported over 24 inches
456 reported over 12 inches.
Image of storm exiting - leaving a wild mix of cloud bands and snowcover behind.
NOAA has added the storm to the list as a CAT2 event (3.21 NESIS Score). It ranks 43rd.
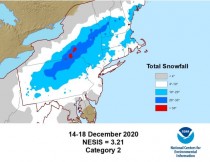
It seems they undercounted some of the the snow amounts in that band where local 40 inches amounts were reported from PA to NH.I believe it MAY have been a CAT 3, but the heaviest missed the urban corridor so I won’t object. It’s all gone already anyway thanks to a Christmas deluge and warmth ahead of a powerful trough. It is a frigid Christmas in the Midwest behind the storm. BTW, a similar thing happened in January 1978 and again in January 1996 when a warm driving rain wiped out deep snows. More fun followed.
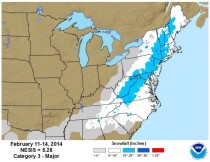
It is likely to make the NESIS list. Our former award winning intern Remy Mermelstein now at Cornell tells me NSSL’s Greg Carbin notes the 20,000 square mile 1 foot or more of snow is most like the Valentine’s Day storm of 2014 a class 3 NESIS event.
What is Nesis?
NWS describes it:
While the Fujita and Saffir-Simpson Scales characterize tornadoes and hurricanes respectively, there is no widely used scale to classify snowstorms. The Northeast Snowfall Impact Scale (NESIS) developed by Paul Kocin and Louis Uccellini of the National Weather Service (Kocin and Uccellini, 2004) characterizes and ranks high-impact Northeast snowstorms. These storms have large areas of 10 inch snowfall accumulations and greater. NESIS has five categories: Extreme, Crippling, Major, Significant, and Notable. The index differs from other meteorological indices in that it uses population information in addition to meteorological measurements. Thus NESIS gives an indication of a storm’s societal impacts. This scale was developed because of the impact Northeast snowstorms can have on the rest of the country in terms of transportation and economic impact.
NESIS scores are a function of the area affected by the snowstorm, the amount of snow, and the number of people living in the path of the storm. The diagram below illustrates how NESIS values are calculated within a geographical information system (GIS). The aerial distribution of snowfall and population information are combined in an equation that calculates a NESIS score which varies from around one for smaller storms to over ten for extreme storms. The raw score is then converted into one of the five NESIS categories. The largest NESIS values result from storms producing heavy snowfall over large areas that include major metropolitan centers. For details on how NESIS scores are calculated at the National Centers for Environmental Information, see Squires and Lawrimore (2006).
The Northeast Snowfall Impact Scale (NESIS)
Overview
While the Fujita and Saffir-Simpson Scales characterize tornadoes and hurricanes respectively, there is no widely used scale to classify snowstorms. The Northeast Snowfall Impact Scale (NESIS) developed by Paul Kocin and Louis Uccellini of the National Weather Service (Kocin and Uccellini, 2004) characterizes and ranks high-impact Northeast snowstorms. These storms have large areas of 10 inch snowfall accumulations and greater. NESIS has five categories: Extreme, Crippling, Major, Significant, and Notable. The index differs from other meteorological indices in that it uses population information in addition to meteorological measurements. Thus NESIS gives an indication of a storm’s societal impacts. This scale was developed because of the impact Northeast snowstorms can have on the rest of the country in terms of transportation and economic impact.
NESIS scores are a function of the area affected by the snowstorm, the amount of snow, and the number of people living in the path of the storm. The diagram below illustrates how NESIS values are calculated within a geographical information system (GIS). The aerial distribution of snowfall and population information are combined in an equation that calculates a NESIS score which varies from around one for smaller storms to over ten for extreme storms. The raw score is then converted into one of the five NESIS categories. The largest NESIS values result from storms producing heavy snowfall over large areas that include major metropolitan centers. For details on how NESIS scores are calculated at the National Centers for Environmental Information, see Squires and Lawrimore (2006).
Table 1: NESIS categories, their corresponding NESIS values, and a descriptive adjective:
CATEGORY NESIS VALUE DESCRIPTION
1 1-2.499 Notable
2 2.5-3.99 Significant
3 4-5.99 Major
4 6-9.99 Crippling
5 10.0+ Extreme
See the list of the storms and links to images of the snowfall here:
References:
Kocin, P. J. and L. W. Uccellini, 2004: A Snowfall Impact Scale Derived From Northeast Storm Snowfall Distributions. Amer. Meteor. Soc., 85, 177-194
Squires, M. F. and J. H. Lawrimore, 2006: Development of an Operational Snowfall Impact Scale. 22ndIIPS, Atlanta, GA.
December sees a pop climatologically speaking. It rises to a peak in February with a slow decline as spring approaches.
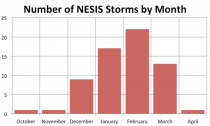
Breakdown of NESIS storms by Month
Number of NESIS storms by week of the year.
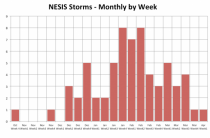
Weekly, the second week in December has had 3 such storms, Christmas week has had 5, mid January also has had 5, with 7 to 8 per week in late January to mid February. It drops off some through the first 3 weeks of March then chances are low into April.
Oceans play a role in the development of these storms. A warm Atlantic and also a warm pool in the Gulf of Alaska can combine and make big storms more likely.
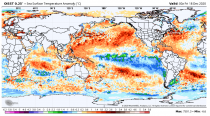
Sea surface temperature anomalies across the world as of Friday December 17. Image provided by WeatherBell.
Number of NESIS storms by year when SSTs are warmer than normal in the Gulf of Alaska.
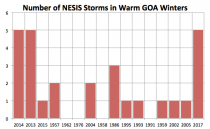
These conditions were common since 2007/08.
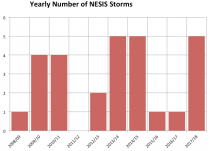
Number of NESIS storms by year over the past 12 years.
The last decade was a blockbuster with a total of 29 NESIS events, well ahead of event the snowy 1960s.
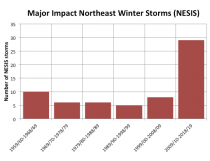
Number of NESIS storms by decade.
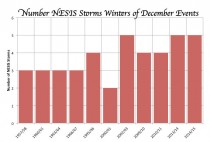
DECEMBER AN OMEN?
In the years of NESIS (1956 to 2020), that there were 11 years with a big December event, there were others that followed (1 to 4). You will recognize some of the years. 2000/01 had 2 official storms although March that year really had 2 events back to back for the northern half of New England (4 feet here in southern New Hampshire). Now with blocking (negative AO/NAO) and a stratospheric warming event the storm track will be suppressed with a few to several snow threats the next few weeks. As the strat warm proceeds, and especially if the Aleutian retrogresses west, the path to arctic outbreaks will develop too. Until then it is mainly Canadian polar. Weather forecasting is a little like playing chess.When we had impact events in December, in all years in the NESIS record back to 1956, we had 1 to 4 additional major impact events in the northeast.
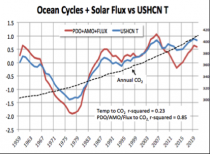
See how temperatures cycle with El Ninos and La Ninas and are currently heading down.
See how the ocean cycles and solar Flux correlate highly with US temperature (r squared of 0.85 versus just 0.23 for CO2).
BY MADHAV KHANDEKAR AND TOM HARRIS DEC 05, 2020 9:39 PM ET
PJMedia
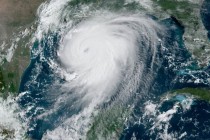
NOAA Satellite
Over the past week, media across the world have proclaimed 2020 a record year for hurricanes in the North Atlantic. The culprit? Man-made climate change, of course.
But this is a mistake, not only because the “records” are misleading but also because the causes of hurricanes are natural phenomena over which we have little or no influence.
The New Jersey-based business news channel CNBC provided several examples of the errors. On November 30, they reported: “Research shows that climate change is making hurricanes stronger and more destructive and increasing the likelihood of more frequent major hurricanes.”
The network quoted Penn State University meteorologist Michael Mann, who went even further, asserting that “The impacts of climate change are no longer subtle. We’re seeing them play out right now in the form of unprecedented wildfires out West and an unprecedented hurricane season back East.”
“Things will only get worse if we continue to burn fossil fuels and generate carbon pollution. This current hurricane season lays bare the reasons we must act on climate now,” he added.
Other media sources put the primary blame squarely on man-made global warming, which supposedly has made the Gulf of Mexico warmer and the air more humid thereby making tropical cyclones- called hurricanes in the North Atlantic - more frequent and more intense.
But this is misleading. Dr. Roy Spencer, a principal research scientist at the University of Alabama in Huntsville, explained that “major hurricanes don’t really care whether the Gulf [of Mexico] is above average or below average in temperature.”
Similarly, M. Mohapatra and V. Vijay Kumar of the India Meteorological Department state in their March 2017 research paper that “there is a decreasing trend in the tropical cyclone number over the North Indian Ocean in recent years, though there is an increasing trend in the sea surface temperature.”
So, if not primarily temperature, what does make one hurricane season worse than another?
America’s “hurricane guru,” the late Dr. Bill Gray, emeritus professor of atmospheric science at Colorado State University, showed that the seasonal hurricane frequency is determined by six factors:
* The rotational tendency, or vorticity, already present in the atmosphere
* Pressure gradients determined by latitude
* Wind shear, the changes in wind speed and direction that occur between layers in the atmosphere. High wind shear can tear storms apart before they form tropical cyclones. Low wind shear allows storms to grow into hurricanes if the other conditions are right.
* Ocean thermal energy
*The rate of change of temperature with altitude
* Relative humidity in the mid-troposphere
This year the sea surface temperature of the Atlantic Ocean has indeed been relatively high (contributing to Dr. Gray’s factors #4 and #6 above) since we are in a warm phase of the natural Atlantic Multidecadal Oscillation (AMO). But the AMO’s origin and the mechanisms directing it are as yet unknown.
Low wind shear (Dr. Gray’s factor #3 above) also played a significant role in this year’s active hurricane season. Wind shear is a natural phenomenon that varies across the globe and is determined by a host of meteorological factors, none of which are under human control. For example, this year’s La Nina event resulted in cool dry air in the Eastern Pacific Ocean with associated relatively high wind shear and so fewer tropical cyclones there. However, La Nina also resulted in low wind shear and trade winds in the Atlantic, thereby allowing more storms to build up into hurricanes.
Regardless, the supposed records being set are, in fact, suspect. Joe D’Aleo, co-chief meteorologist at Weatherbell.com said, “Not every meteorologist believes 2020 holds the record for most named storms. Due to advances in technology, forecasters are able to identify smaller subtropical storms that may have gone unnoticed in the past. Some of this year’s storms should not have been named or would not have been in previous years.”
Christopher Landsea, chief of the tropical analysis and forecast branch at the National Hurricane Center, was cited in the New York Times as saying,
“There has been a lot of hype about the record number of storms and, yes, it’s been a busy year. There have been horrific impacts. But is this really a record? The answer is no.”
D’Aleo points out that this conclusion is supported by the trend in annual North Atlantic Accumulated Cyclone Energy (ACE, a metric used to express the energy of tropical cyclones during a period of time). The following graph shows that 2020 was 13th in ACE levels since 1851.
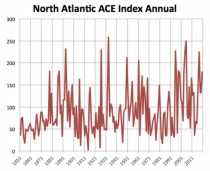
Commenting on the fact that the ACE trend in the Pacific is only 50% of normal in 2020, D’Aleo said, “For the northern hemisphere [it] was 80% of normal. So even with the hyper Atlantic season. GLOBALLY we were BELOW average.”
Next D’Aleo showed the following graph of landfalling (on the continental U.S.) hurricanes, and concluded that “the decadal trend for landfalling hurricanes and major hurricanes has been down.” The last decade was the second quietest decade for both landfalling hurricanes and major hurricanes.

The global warming/hurricane connection completely falls apart when one looks more closely at the observational data.
For example, it was during the 1945-77 global cooling period, when ocean temperatures worldwide were undoubtedly lower than today, that we witnessed stronger hurricanes than now. For example, Hurricane Camille, the second-most intense tropical cyclone to strike the U.S. on record, slammed into Mississippi as a category 5 (the strongest) hurricane on August 18, 1969, producing a storm surge of 7.3 meters.
The most powerful tropical cyclone on record worldwide was not recent either. Immediately following a cooling period, the 2,200 km-wide “Super Typhoon” Tip, the strongest ever, made landfall in southern Japan on October 19, 1979 (Irma was 680 km across; Harvey 400 km). And the deadliest tropical cyclone was in the Bay of Bengal November 12-13, 1970, when the earth’s mean temp was decreasing. Sadly, it killed an estimated quarter-million people in East Pakistan, which is now Bangladesh.
According to the World Meteorological Organization, the biggest storm surge worldwide was 13 meters at Bathurst Bay, Queensland, in 1899. Some contemporary accounts assert the surge was 14.6 meters, or almost the height of a 50-story building. During the warmer 20th and 21st centuries, no tropical cyclone was strong enough to generate a surge greater than 10 meters.
The fact that hurricanes and other tropical cyclones are not caused, or even significantly enhanced, by man does not give us an excuse to do nothing about them, however. Florida and Texas need to engage in “vertical evacuation” by building multi-story storm shelters that allow residents to take refuge above the storm surge, instead of today’s ineffective “horizontal evacuation,” forcing people to flee the waves on clogged highways. The U.S. should look to India’s storm shelter network for an example of success in this regard - no one need walk more than one kilometer anywhere on India’s coast to get to a shelter. If India can afford it, why not the U.S.?
It is time to develop improved early warning systems and more storm shelters. Concerning ourselves with carbon dioxide emission reduction is a wasteful distraction and will have no impact on future hurricane strength or frequency.
---------------------------
See the Alarmist claim rebuttal review of the hurricane season of 2020 here and similarity to the late 1800s here and all 13 Alarmist claims here.
This work was done and being updated pro-bono. Your help of course is much appreciated - safe and secure Paypal.
The beneficial gas CO2 is demonstrated by Dr Craig Idso from CO2 Science, an organization trusted by NOAA to be a center that displayed US station data prior to the development of NCDC/NCEI.
Junk models using fraudulent data have been used to try and convince the world CO2 is bad and we need to rid it by eliminating all fossil fuels which output CO2.
Dr. Patrick Moore, Ecologist and co-founder of Greenpeace shows this also.
See how ice core data exposes the big lie about man made unprecedented warming.
---------------------
The models used to estimate U.S. deaths from COVID19 had projections that ranged from over 2 million two months back to 100,000-240,000 and then down to 60,000. Most hoped they would come down further, but the numbers blew past the 60,000. A lot of uncertainty exists in the data still though as an unknown number of the deaths attributed to COVID19 may really have been due to other morbidities and also some point out health care institutions are financially better off with a COVID19 cause of death.
The media seemed perplexed about the large changes in the models and questioned their concept and value. Welcome to the world of modeling (see this comparison).
We in the weather business use models as a tool and they present special challenges. We have a plethora of models to choose from which run 2 to 4 times a day or even on a smaller scale hourly. Operational model forecasts go out to as far 16 days into the future. The models are subject to large errors especially in the latter periods when storms are coming inland from data sparse regions like the Pacific. We have a favorite phrase - garbage in, garbage out.
The climate model story is even worse. The climate models overstate the warming from greenhouse gases by a factor of two or more.
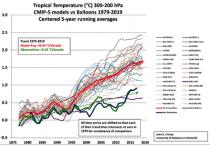
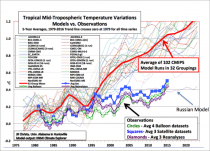
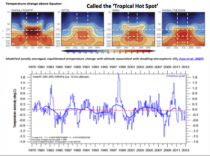
Climate model forecasts versus the satellite and balloon observations
The models projected the greatest warming in the tropical high atmosphere (called the Tropical Hot Spot) where air in the mean rises due to convergence of air from both hemispheres. But the models warming results mostly from the release of heat from condensation of water vapor (95% of the greenhouse effect). CO2 is a trace gas, just 0.04% of the atmosphere by volume.
See no warming trend in the upper atmosphere since 1979 where models predict it.
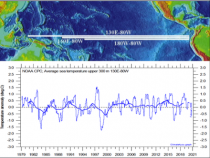
The lack of warming also holds for the tropical Pacific ocean down to 300 meters depth from 160E to 80W.
Climate scientist Stefan Rahmstorf in DER SPIEGEL actually admits quietly that the models are crap, running way too hot here.
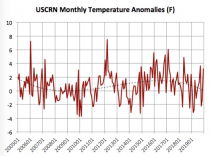
HOW THEY DEAL WITH LACK OF REAL DATA AT GROUND LEVEL
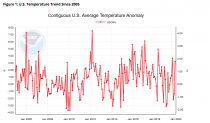
The lack of warming is documented by the National Oceanic and Atmospheric Administration’s U.S. Climate Reference Network, an extremely accurate network of temperature stations throughout the United States that requires no corrective adjustments. (It began reporting temperature data in 2005.) When climate activists claim specific impacts of global warming in the United States, those impacts could not have been caused by any recent warming because no significant recent U.S. warming has occurred.
On a global scale the climate cabal portray the output from their models as gospel, and the believers confuse the model projections with measured data. The data centers make unsubstantiated claims that a given month or year is the warmest back to the beginning of the record (1880 or even 1850) often by the tiniest of margins (0.05C for example).
But the data is just not there to make those claims.
71% of the earth is oceans, and data before the satellite data became available 40 years ago, ocean data was reliant on ships which travelled along specific routes mainly in the northern hemisphere near the land.
A large percentage of land surface was erratically covered with observing sites and the data too often spare and intermittent.
To create an apparent agreement with their sacred models, the data centers manipulated real data or even generated with their models data for 95% of the planet that had poor coverage before the satellite era.
MIT’s climate scientist Dr. Mototaka here exposed the phoney claims that most years are the warmest ever since the 1850s of 1880s.
“The supposed measuring of global average temperatures from 1890 has been based on thermometer readouts barely covering 5 per cent of the globe until the satellite era began 40-50 years ago. We do not know how global climate has changed in the past century, all we know is some limited regional climate changes, such as in Europe, North America and parts of Asia.”
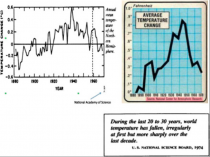
The world’s greatest scientists in the 1970s knew that and created the first view of global trends by using land temperatures where available in the Northern Hemisphere. It showed a 2F warming from 1880s to around 1940 and then a cooling that by around 1970s cut that by more than half. Further cooling until the late 19870s virtually eliminated the rest.
_thumb.jpg)
These early measurements were erased when models and global land (and ocean) data was ‘created’ in the following decades. The models cooled the early data and enhanced the warming to create an apparent steady warming during the eras when fossil fuel use increased. Our conclusion is that there is man made global warming but the men are in NOAA, NASA and Hadley.
_thumb.png)
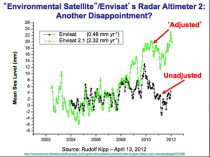
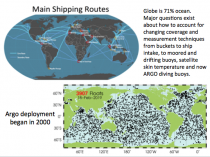
By the way, the ocean data coverage and accuracy did not really become reliable until the implementation of the ARGO buoys in 2000 designed to accurately measure temperatures and ocean heat content. Like the satellite used to measure sea level changes (which showed no changes - until artificial adjustments were made), the early results were disappointing - showing no warming. The ARGO data supported the inconvenient near two decade pause in the warming that started in the late 1990s.
_thumb.png)
Eventually in desperation ahead of the Paris Accord, they made this go away by adjusting the buoy data to match to inferior ship data.
_thumb.png)
The models are tuned to manipulated (fraudulent) data. In addition to what we have shown above, this can be seen when you examine all the extremes of weather that these models and the theories predict. See here how each of the claims have failed.
SUMMARY
COVID19 has shown how major the impact on the global population a pandemic can bring. A Green New Deal wasn’t developed in a lab, but is as bat shit crazy and would have a major impact on life as we know it. The effect on our economy would not be as sudden but just as serious. The government would not be sending you checks in the mail to help but driving up the cost of energy, and the cost of living and the choices you make (cars you drive, where you can live, how much you can make and keep). Because it is based on junk science, we need to dispatch it as quickly as we can the COVID19.
See much more on this issue in this presentation in front of New Hampshire Taxpayers.
(See this comparison of climate models to COVID19 models). And go to this must see video on the fraud behind COVID19.
By Joe Bastardi |March 17th, 2020|Climate|6 Comments
This is a classic example of what I am trying to show, that this “climate change” issue is more than meets the eye, It is about using any tactic possible to push an agenda that is regressive and seeks to LIMIT what man can do, rather than expand. This article tries to scare the daylights out of people who are already scared, with an implication not supported by any facts today, We are all anxious about the unknown with this virus, so here we go, the predictable use of climate to scare people even more. But the facts are clear on climate over the last 100 years, the results on mankind are EXACTLY OPPOSITE. Which is even more remarkable given the growth of human life
I guess if the Covid-19 completely fizzles out, which is also a possibility, then anything that happens in the weather globally over the next 20 years that is blamed for deaths, means perhaps it would outstrip it, But the facts reveal that man’s adaptation via freedom, competition, and capitalism, which is leading the way, is saying the EXACT OPPOSITE is happening!
And that journalist that are writing things like this choose to ignore the facts, or have not researched it enough to see another side, speaks volumes as to the amount of trust one should put into any agenda that involves narrow-minded one-sidedness
Instead of writing thousands of words I will use a few choice charts, What I want to know, is why the people that write this stuff do not have the intellectual curiosity or the journalistic integrity to do what journalists are supposed to do: Question and show both sides of the issue. It is because of the lack of those qualities, we are reading what we are reading
So here we go, In direct defiance of what is implied in the above article, Climate deaths are plummeting.
_thumb.png)
image.gif
Now why, if you knew this, would you write what you did? Why did you not look at least for the countering argument?
Now watch this. Personal GDP globally and Life expectancy globally:
_thumb.png)
This means MORE PEOPLE ARE LIVING LONGER AND PROSEPERING MORE! When did this hockey stick like skyrocket start? At the start of the fossil fuel era.
Now consider this, and do not think this is minimizing the COVID 19 threat, The median age of deaths is in the low 80s. But if this virus appeared in the pre fossil fuel era, it may have gone virtually unnoticed BECAUSE of LIFE EXPECTANCY IN PRE FOSSIL FUEL ERA was between 30 and 40.
From this article, the chart below:
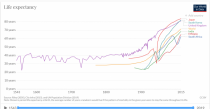
The ramping up to the current levels can be linked if not directly, then indirectly to the advancement of mankind in the fossil fuel era.
When one reads anything, including what I write, one needs to look at both sides, The fact is that the vast majority of articles written on this matter do not bring up countering points, and use the assumption that there is no counter, or someone is a science denier. Yet charts like this show that people saying that are denying facts that any 5th grader ( I use 5th grade since that population age group and around is getting the wits scared out of them with climate change) can see. What is being done today though in articles like the one that spawned this counter, is to make statements that run contrary to what has been going on, with no thinking beyond a set agenda? When you are narrow-minded, your field of vision is extremely limited and what is being revealed in a lot of things has to do with this subject is the narrow mindedness and intolerant views of people who should be doing the opposite, if they are indeed journalists.
In this case, not only do the facts about climate deaths and the advancement of mankind run contrary to what is being implied but the fact that IF NOT FOR THE INCREASE IN LIFE EXPECTANCY brought about with the help of the fossil fuel era, then this viruses impact, if the median age of death is in the low 80s, may not have even been noticed in the late 19th century since life expectancy was about half of what it is today.
As always, I ask the rational reader to consider the other side of the issue. And remind people, as per the previous piece I wrote, to be on guard against any event being blamed on “climate change” for “climate change” is actually a vehicle for another result. At the very least, consider the actual data presented here. And all you journalists that are using all the great tools we have today try to look at both sides of the issue, You might come to realize that where you stand today was built yesterday and the fossil fuel era and the freedoms we enjoy, is in a large part responsible for the foundation we have built to give you the chance. Don’t take that for granted, Question in all you do. Facts like what I have shown above, indicate that there is a reason to look at both sides of an issue. Be open-minded and tolerant, and don’t accuse those that bring up ideas you may not have seen, of being someone they are not (example Climate Denier). But writing scare articles using what is admittedly a scary virus, and then saying, “climate change” is something worse, without even showing people where we are today on the matter and the actual data, is not being open-minded nor tolerant of contrary ideas.
Author
Joe Bastardi is a pioneer in extreme weather and long-range forecasting. He is the author of “The Climate Chronicles: Inconvenient Revelations You Won’t Hear From Al Gore - and Others” which you can purchase at the CFACT bookstore.
NOAA and NASA can be counted on virtually every month or year end to religiously and confidently proclaim that the latest global average surface temperature (GAST) is among the warmest on record. Back in the 1970s when an assessment of a global temperature was first attempted, the scientists recognized that even land-only surface temperature data was a significant challenge given that most of the reliable data was limited to populated areas of the U.S, Europe and eastern China with just spotty often intermittent data from vast land areas elsewhere.
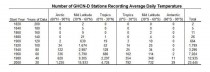
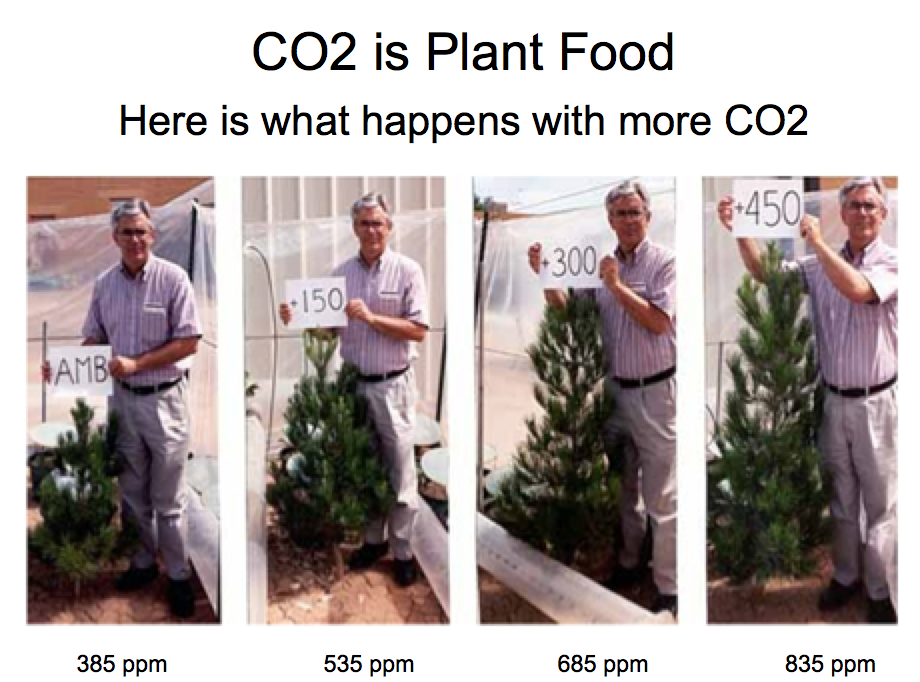
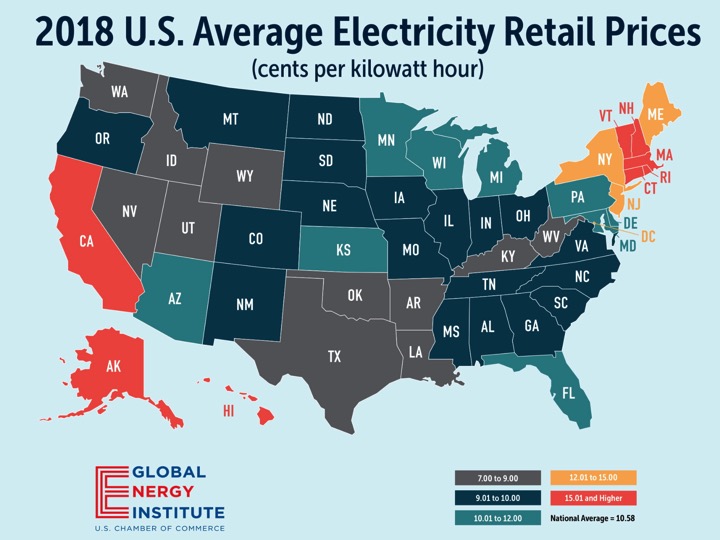
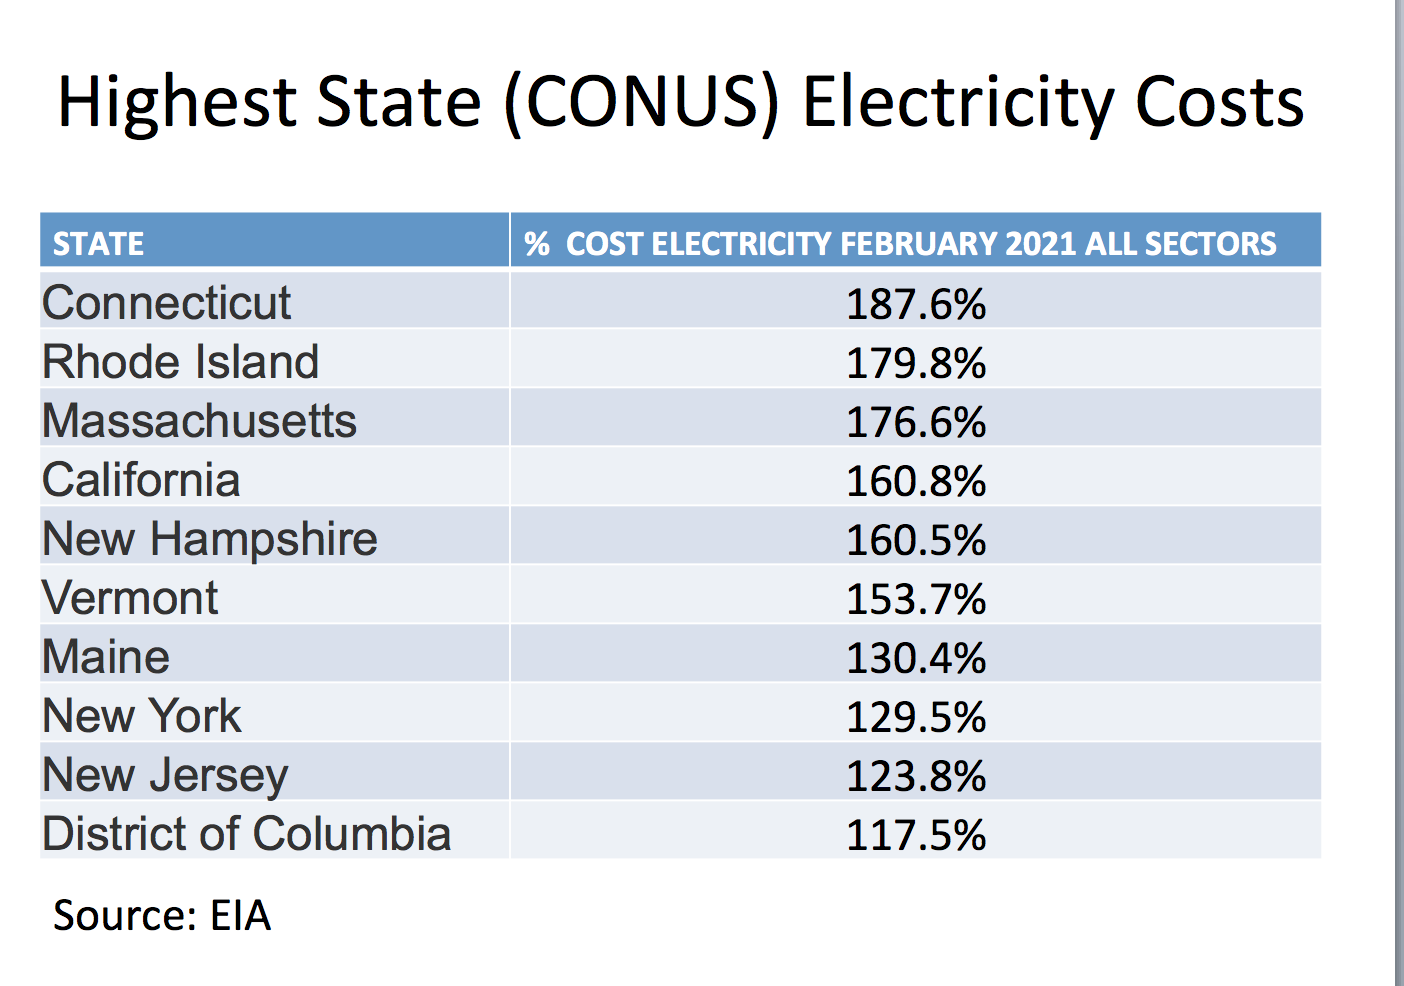
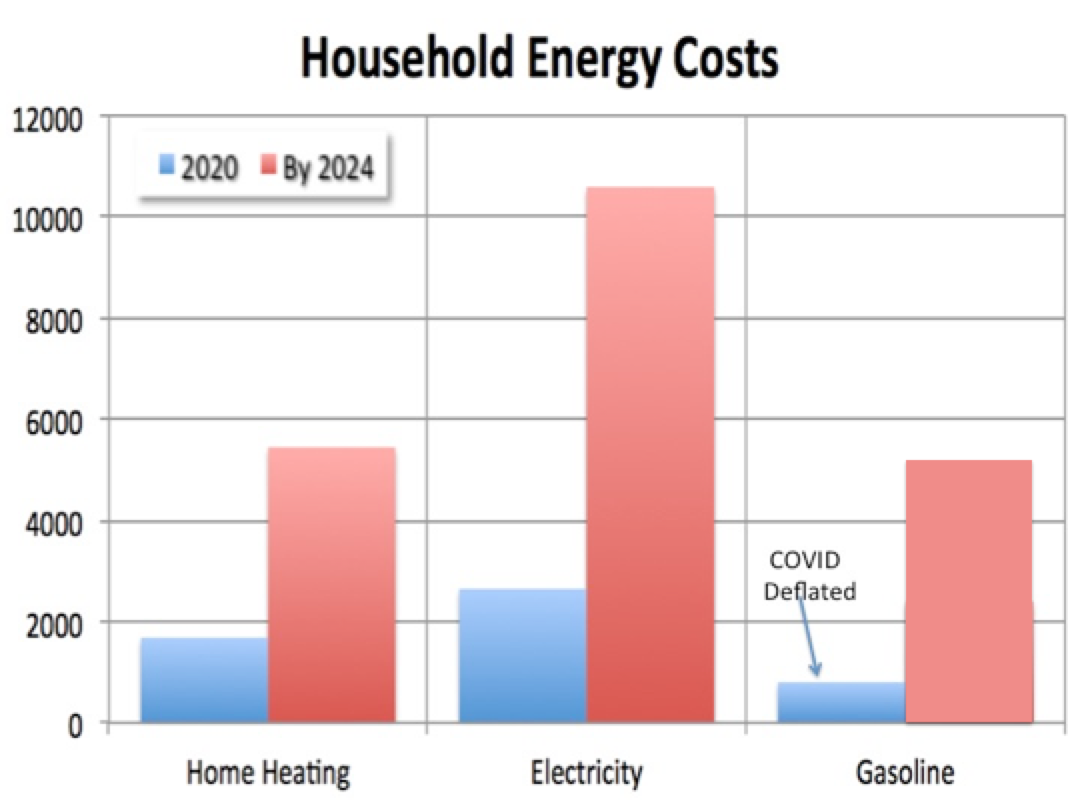
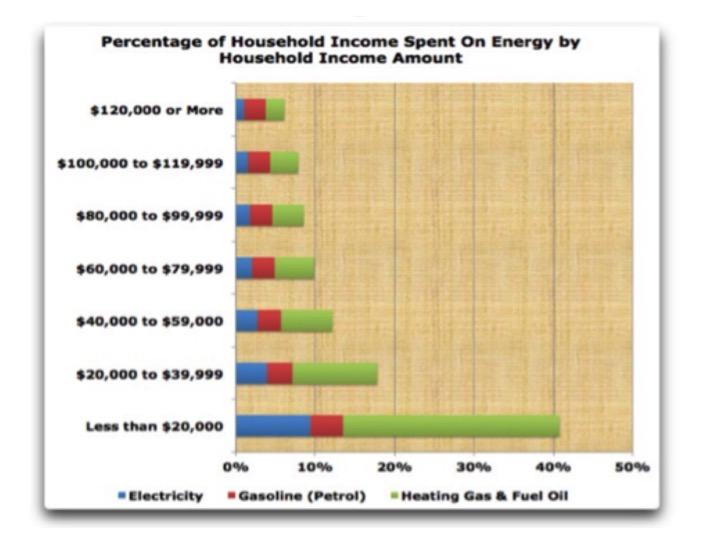
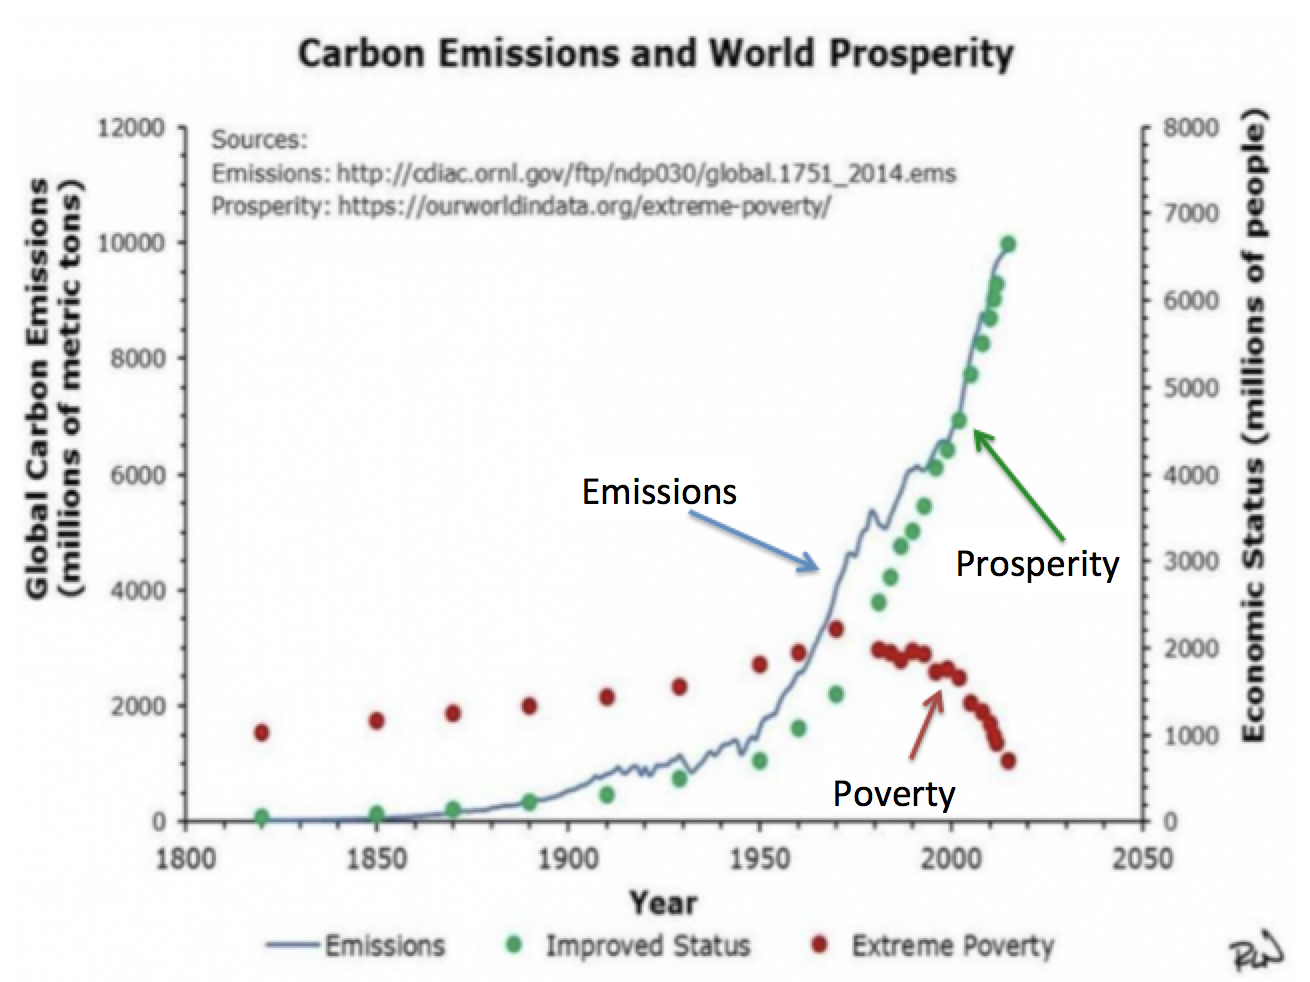
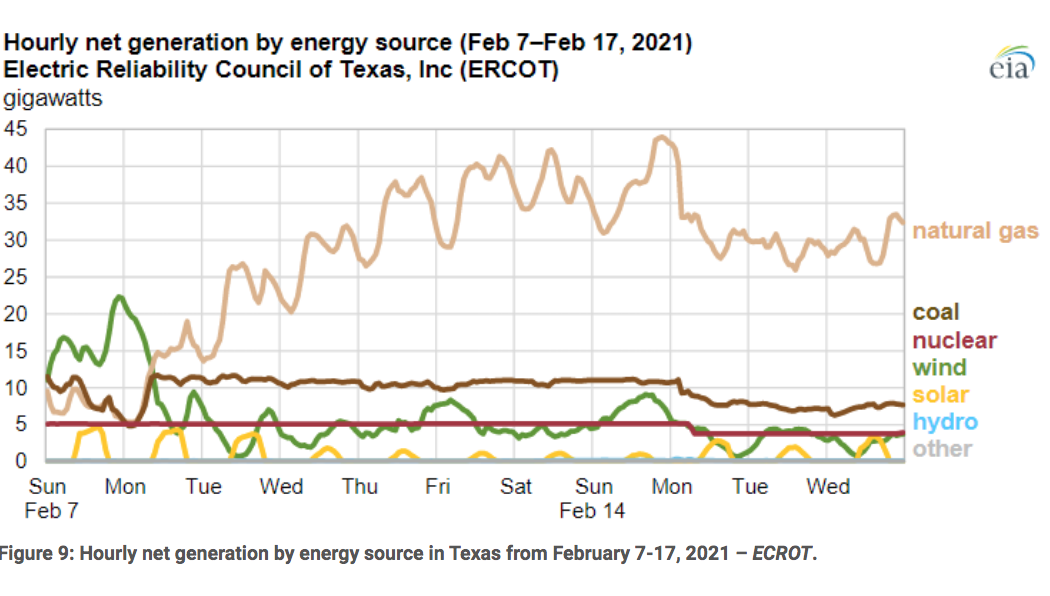
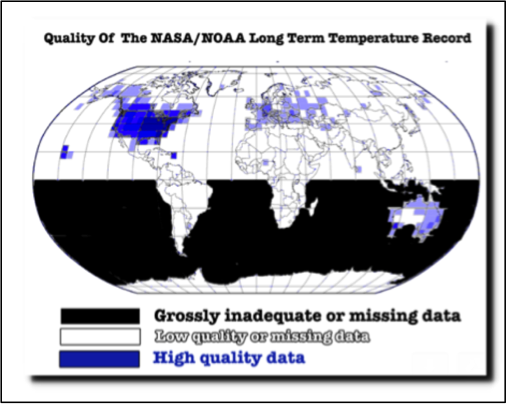
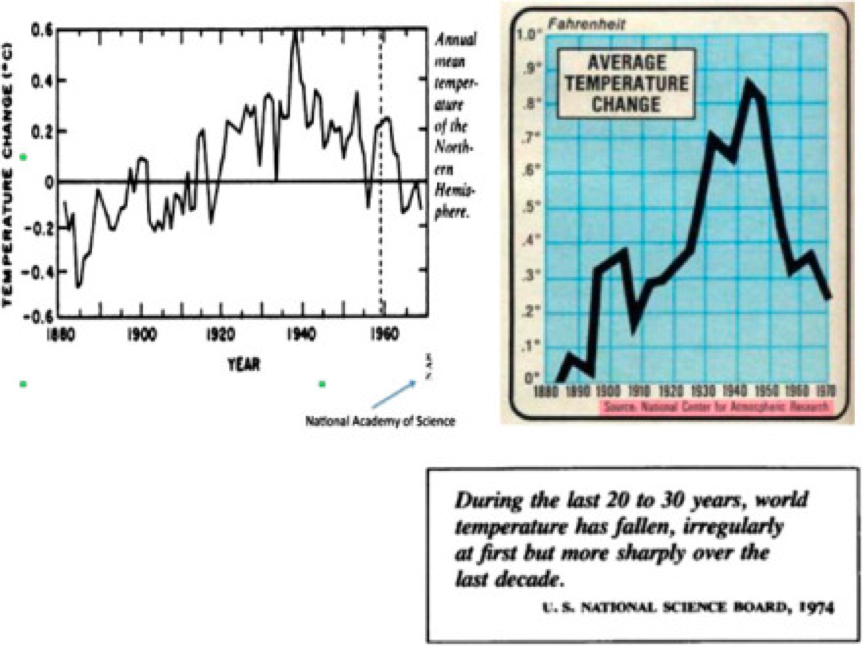
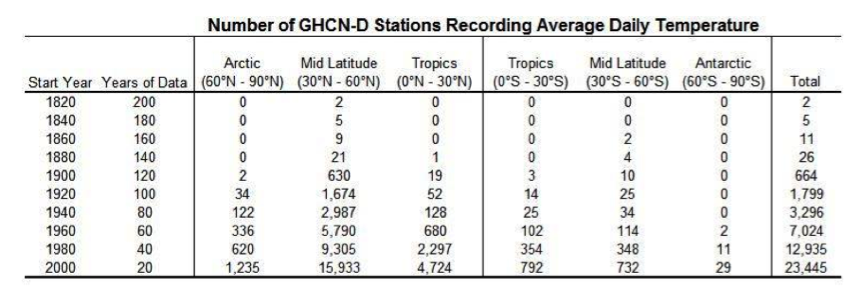
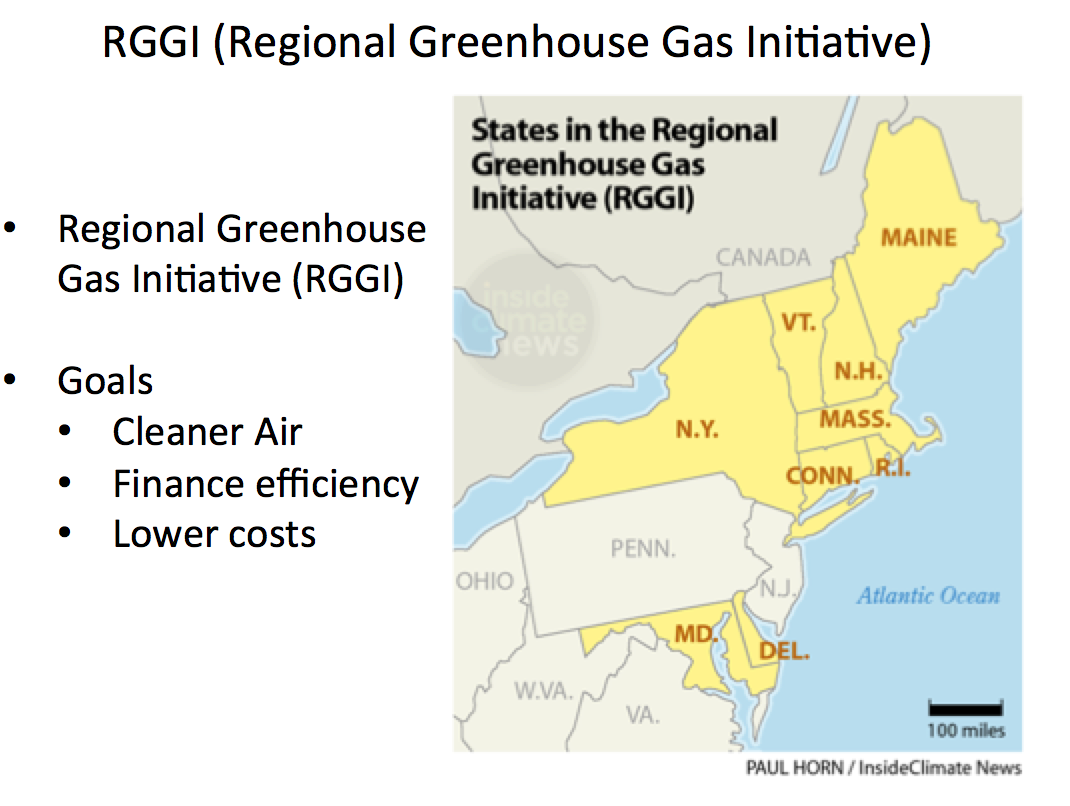
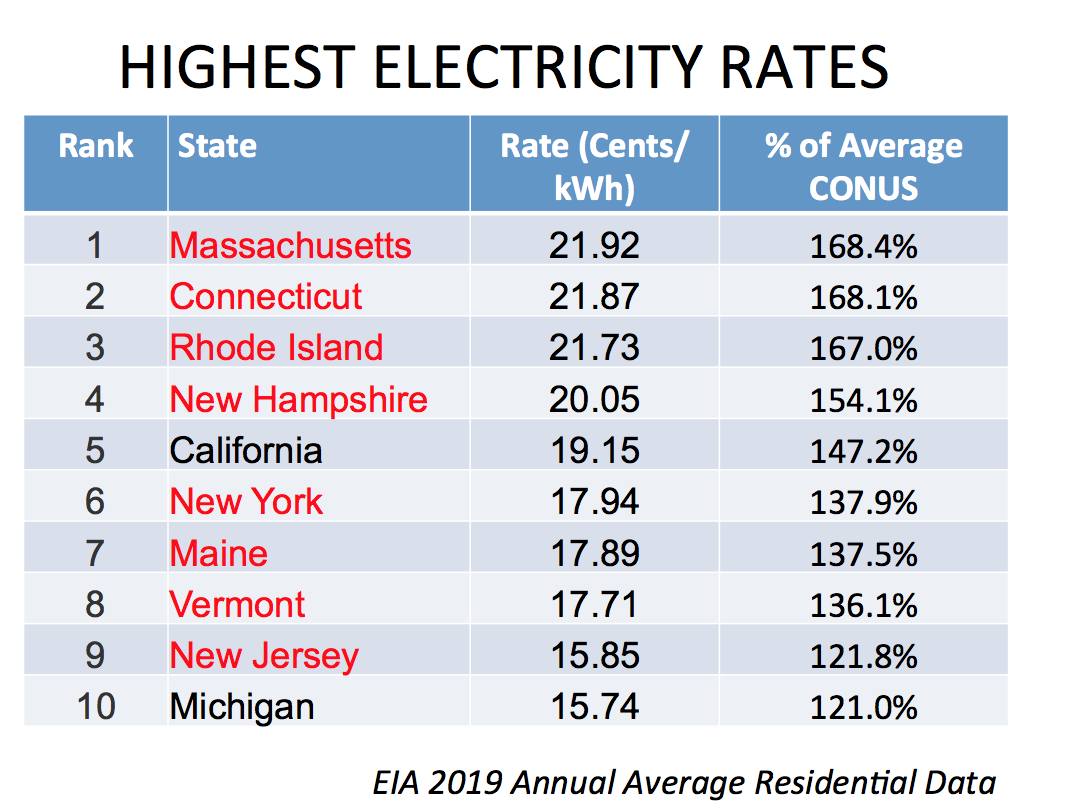
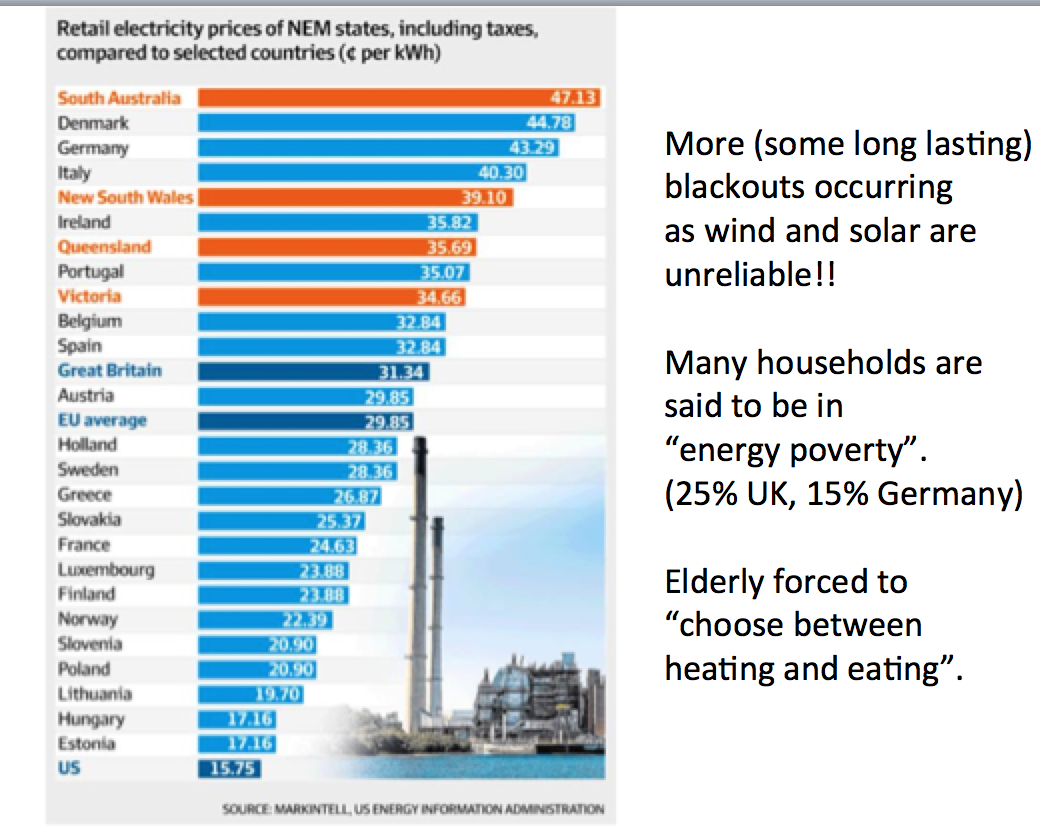
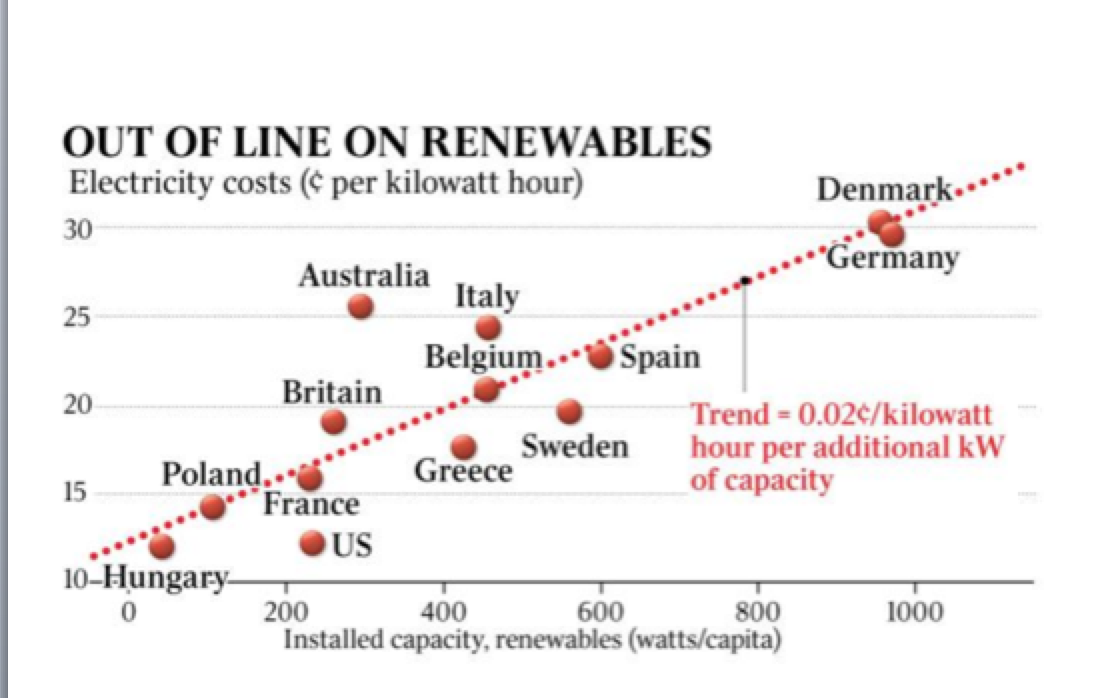
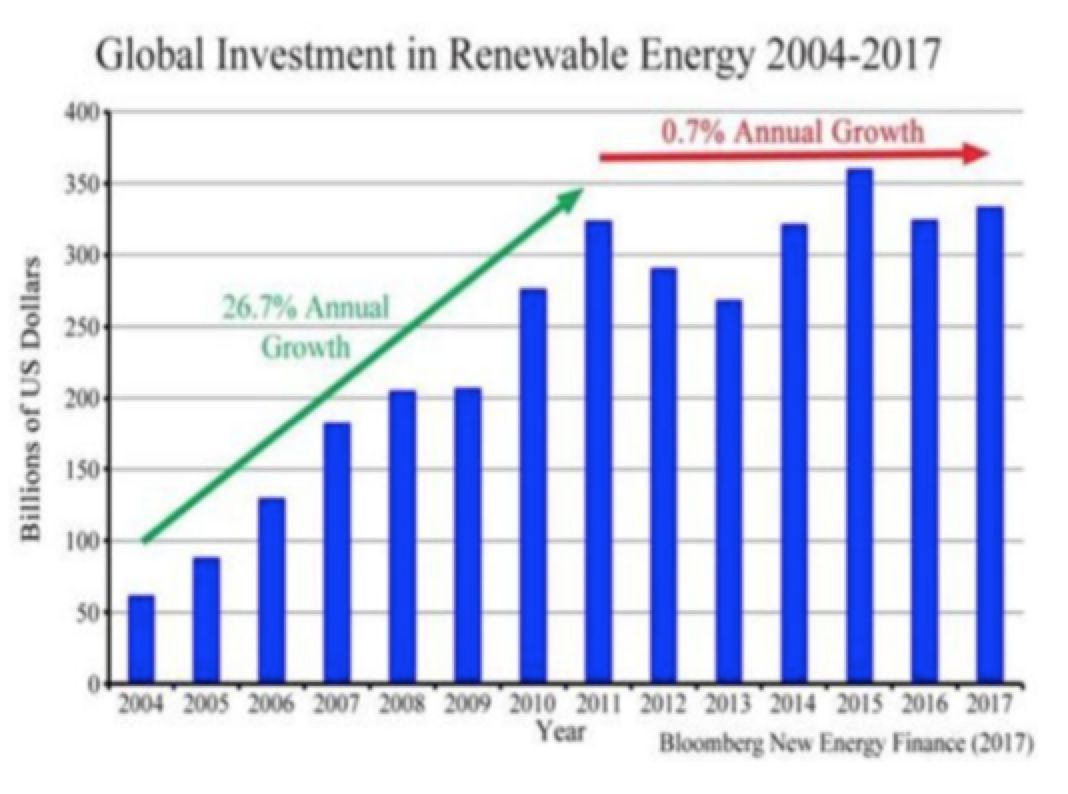
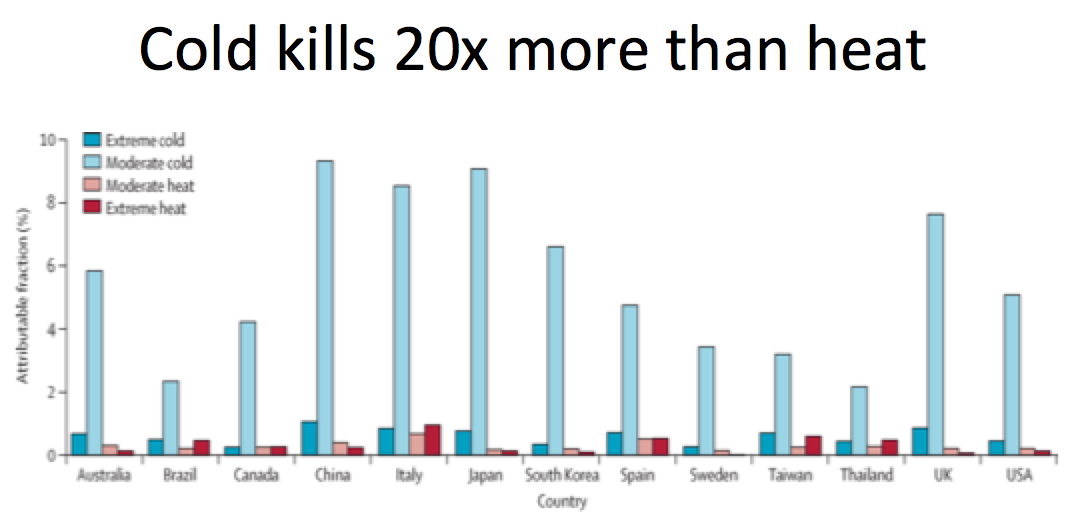
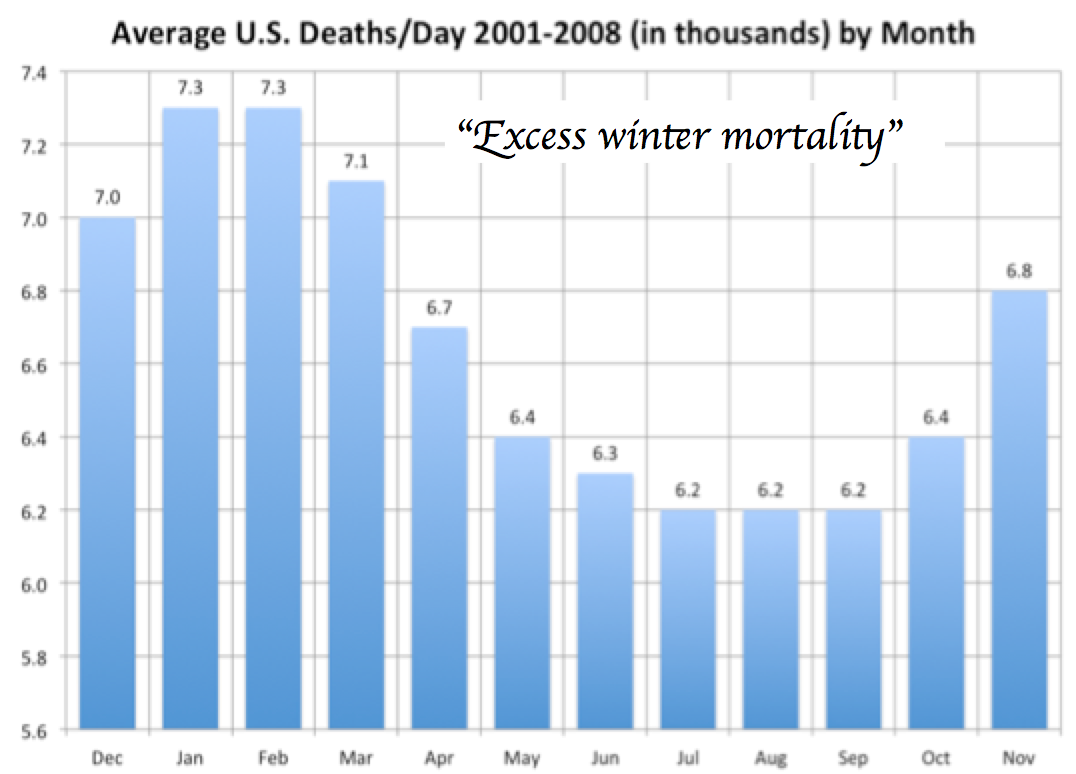
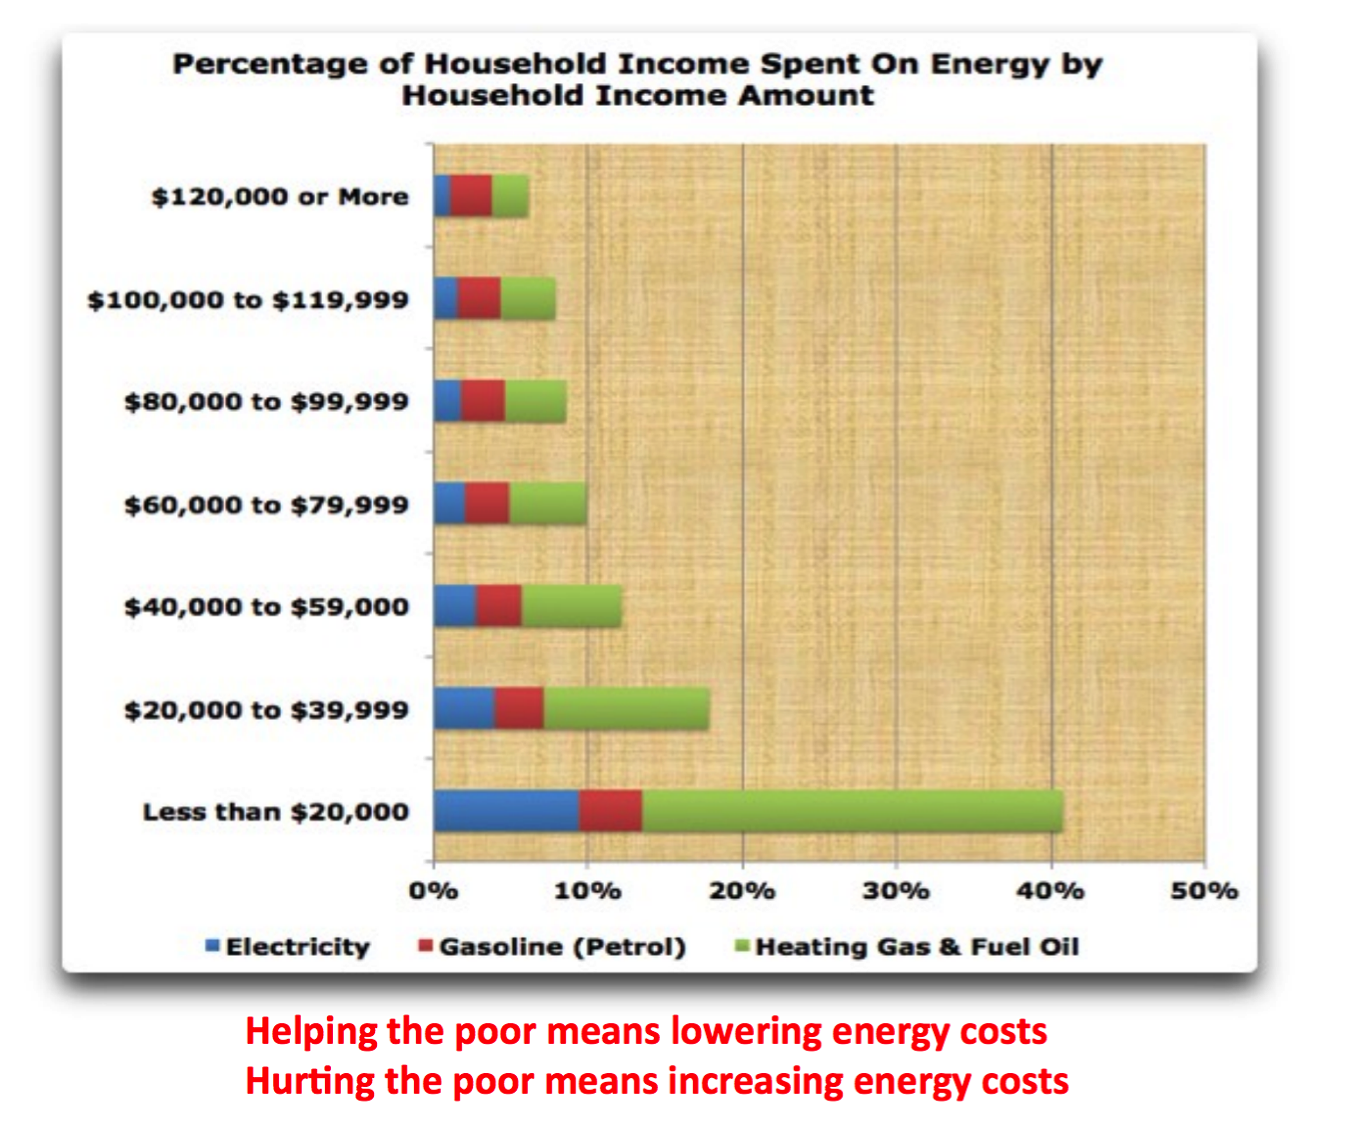
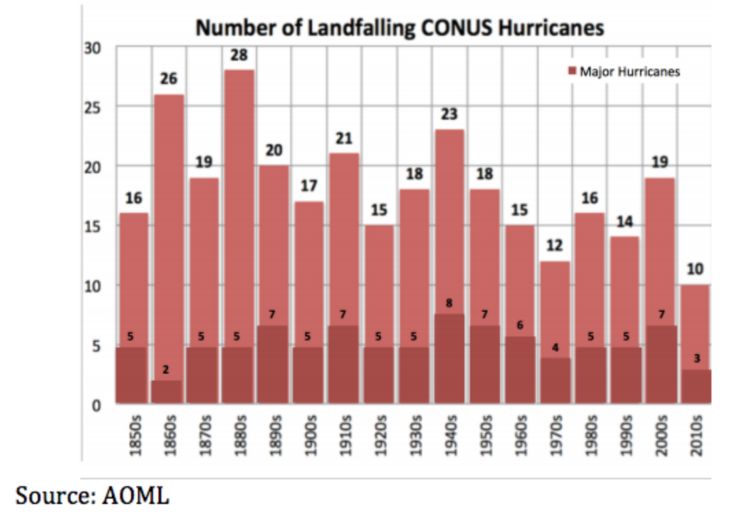
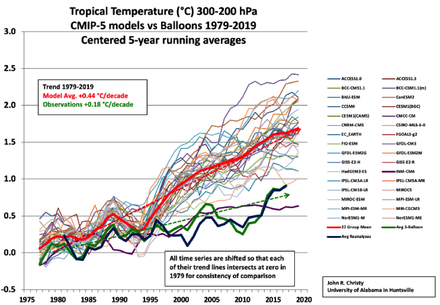
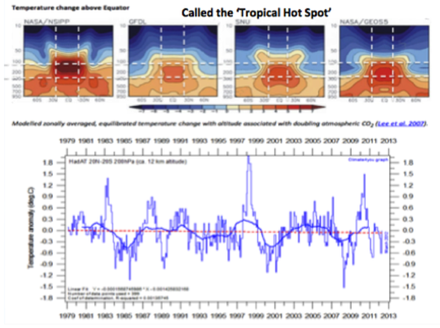
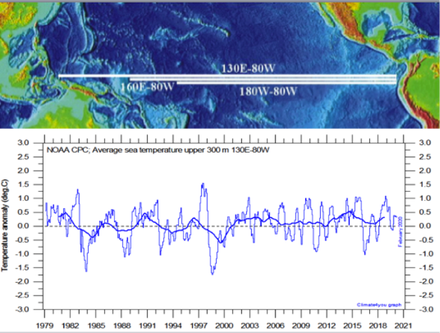
.jpg)
.jpg)
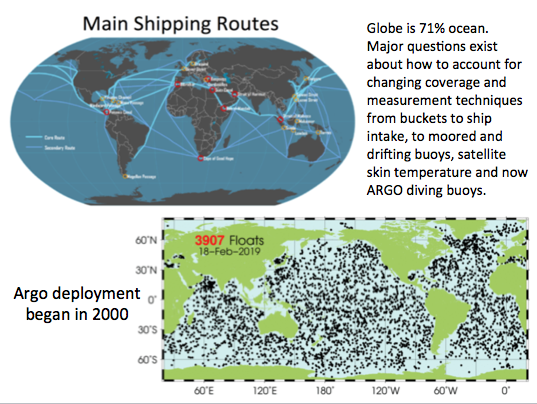
.png)
.jpg)
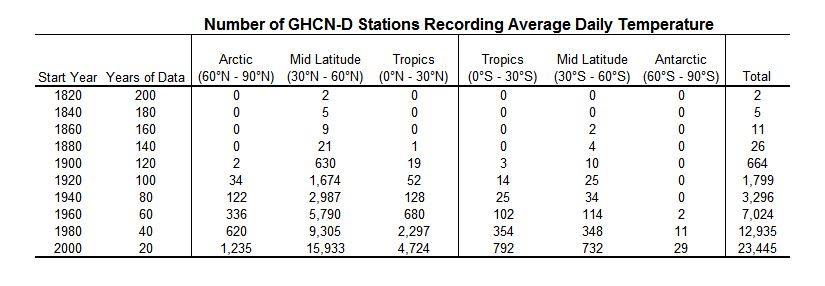
There were just 26 stations in 1880, only 4 in the southern hemisphere. Even in 1900, the 664 global stations was on 2.8% of the number in 2000.
Temperatures over oceans, which covered 71% of the globe, were measured along shipping routes mainly in the Northern Hemisphere erratically and with varying measurement methods. Despite these shortcomings and the fact that absolutely no credible grid level temperature data existed over the period from 1880 to 2000 in the Southern Hemisphere’s oceans (covering 80.9% of the Southern Hemisphere), global average surface temperature data estimation and publication by NOAA and NASA began in the early 1990s.
To illustrate the problem, on January 16, 2020, the WSJ published a lead article by Robert Lee Hotz stating: “NASA, NOAA ranked 2019 as the second-hottest year in tracking data to 1880. The world experienced near-record global temperatures in 2019, federal climate scientists said. ---.” This claim was made despite the fact that absolutely no credible temperature data exists over this period for more than 40% of the planet (0.5*0.809 =0.4+).
After 2000, there were diving buoys. But when the best technology designed specifically for the purpose, the ARGO buoys, disappointed by showing no upward trend, the data from the buoys was “adjusted.” John Bates, data quality officer with NOAA admitted “They had good data from buoys...and “corrected” it by using the bad data from ships. You never change good data to agree with bad, but that’s what they did - so as to make it look as if the sea was warmer.” He retired after that change was made.
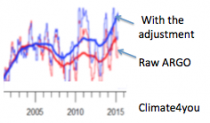
That was just the latest example of data manipulation. Initially, this global data had a cyclical pattern similar to previously reported Northern Hemisphere data (high in the 1930s and 40s, low in the 70s). Then, as time progressed, the previous officially reported GAST data history was modified, removing the cycle and creating a more and more strongly upward sloping linear trend in each freshly reported historical data set.
--------------
Peer reviewed, published and readily reproducible research has shown that: “The conclusive findings were that the three GAST data sets are not a valid representation of reality.”
“In fact, the magnitude of their historical data adjustments, which removed their cyclical temperature patterns are completely inconsistent with published and credible U.S. and other temperature data. Thus, despite current assertions of record-setting warming, it is impossible to conclude from the NOAA and NASA data sets that recent years have been the warmest ever.”
Current climate policies - based on these unreliable temperature records - threaten our economic and national security interests. As the proposed climate policies grow more extreme, the consequences of allowing this record to remain unchallenged gravely threatens an onslaught of litigation based on the greenhouse gas endangerment finding. Importantly, this litigation imposes significant impediments to the mineral land leasing and pipeline infrastructure build out necessary to maintain and enhance energy independence and economic prosperity.
Furthermore, the US financial sector has already dramatically curtailed its support of conventional energy source development in large part due to the continued calls for regulatory destruction of the fossil fuel industry based substantially on NOAA and NASA’s now invalidated global surface temperature records. This situation is putting our Nation’s energy security at grave risk ‘ which means our economic and national security are also in great peril.
----------
ADDENDUM to the Research Report entitled: On the Validity of NOAA, NASA and Hadley CRU Global Average Surface Temperature Data & The Validity of EPA’s CO2 Endangerment Finding, Abridged Research Report, Dr. James P. Wallace III, Joseph S. D’Aleo ABD, Dr. Craig D. Idso, June 2017
The June 2017 Research Report provides ample evidence that the Global Average Surface Temperature (GAST) data was invalidated for use in climate modelling and for any other climate change policy analysis purpose. However, there was one very critical science argument that this report did not make, which is made here.
This critical point involves whether or not it was even possible to compute a mathematically proper GAST data set over the period 1900-2000 in the first place. Claims of record-setting GAST were made as one of the three Lines of Evidence of the 2009 GHG/CO2 Endangerment Finding. Another Line of Evidence purported that climate models, tuned to fit this GAST data, were adequate for policy analysis purposes. The third Line of Evidence for validation required credible Surface Temperature data as well. However, as stated in the aforementioned GAST Research Report:
“The conclusive findings of this research are that the three GAST data sets are not a valid representation of reality. In fact, the magnitude of their historical data adjustments, that removed their cyclical temperature patterns, are totally inconsistent with published and credible U.S. and other temperature data. Thus, it is impossible to conclude from the three published GAST data sets that recent years have been the warmest ever - despite current claims of record setting warming. Finally, since GAST data set validity is a necessary condition for EPA’s GHG/CO2 Endangerment Finding, it too is invalidated by these research findings” (1)
Thus, in this GAST report, ample evidence was provided that the current officially reported GAST data are simply not credible, therefore invalidating the 2009 Endangerment Finding. However, there is a proof that is far easier to understand. Over the period 1900-2000, there is virtually no credible surface temperature data available for at least 40% of the surface of the Earth. This follows from the fact that the Southern Hemisphere’s surface is over 80% ocean (.50*.80=40), and essentially no credible temperature data was captured for these vast oceans over this time period. (2)
Hence, it never made any sense to even attempt to compute a GAST data set over this time period unless the purpose was to construct a temperature data set that could be made to have virtually any pattern over that time period that the institutions involved desired to portray as reality. In truth, with literally no credible temperature data available for well over 40% of the Earth’s surface, these institutions were only limited by what was credible to the outside world. (3) Thus far, not knowing these facts, all relevant parties, e.g., regulators, environmentalists, and government officials, have been far too accepting of the GAST record as a valid global temperature database. Since GAST data has now been separately proven to not be a valid representation of reality, it also means that the 2009 CO2 Endangerment Finding has been once again invalidated.
Footnotes
(1) GAST Data Research Report - see page 4.
(2) Southern Hemisphere “The South Atlantic, the South Pacific, the Indian Ocean and several seas, including the Tasman Sea between Australia and New Zealand and the Weddell Sea next to Antarctica, constitute approximately 80.9 percent of the Southern Hemisphere. Land constitutes about 19.1 percent. In the Northern Hemisphere, on the other hand, most of the area is comprised of land masses.”
(3) “According to overseers of the long-term instrumental temperature data, the Southern Hemisphere record is “mostly made up”. This is due to an extremely limited number of available measurements both historically and even presently from the south pole to the equatorial regions.
In 1981, NASA’s James Hansen et al reported that “Problems in obtaining a global temperature history are due to the uneven station distribution (40), with the Southern Hemisphere and ocean areas poorly represented,” - - - - (Science, 28 August 1981, Volume 213, Number 4511)
In 1978, the New York Times reported there was too little temperature data from the Southern Hemisphere to draw any reliable conclusions. The report, prepared by German, Japanese and American specialists, appeared in the Dec. 15 issue of Nature, the British journal and stated that “Data from the Southern Hemisphere, particularly south of latitude 30 south, are so meager that reliable conclusions are not possible,” the report says.
“Ships travel on well-established routes so that vast areas of ocean, are simply not traversed by ships at all, and even those that do, may not return weather data on route. Attempting to compile a ‘global mean temperature’ for 70% of the earth from such fragmentary, disorganized, error-ridden and geographically unbalanced data is more guesswork than science.
As to sea surface temperatures (SST), this data is even more fragmentary than the air temperature readings. Prior to around 1940, SST was collected by throwing buckets over the side of a ship, hoisting it on deck and dipping a thermometer in it. Bucket data is only useful for immediate weather prediction purposes, not for long-term statistical climatic analysis. Any other data collected in such bizarre ways would be laughed out of any other scientific forum.”
“Since the 1980s and 1990s we have satellites to measure SST [22] using infra-red sensors (not to be confused with the MSU instruments which measure the atmosphere). Unfortunately, satellites sensing SSTs in the infra-red can only see the immediate water surface, not the water even a few centimetres deeper. This is because infra-red radiation at these wavebands (around 10 microns) cannot penetrate water at all, and so the satellite can only ‘see’ that top millimetre. This can result in both warm and cool errors. On hot still days, the top centimetre of the ocean surface can be much warmer than waters a few centimetres deeper, similar to the same phenomenon which can be observed in any undisturbed outdoor swimming pool. On windy days, there is no such difference due to wave mixing. There is also an intermittent ’thermal skin effect where the top millimetre of water on calm seas can be up to 0.3C cooler than the water just beneath the ‘skin’ due to evaporation taking place on the surface. For these reasons, SSTs taken from satellites are only accurate to within a few tenths of a degree, adequate for immediate meteorological purposes or detecting an El Nino, but not suited to measuring subtle global climatic changes of a few tenths of a degree.” John Daly
========
See the Superbowl of Data Tampering by Tony Heller:
--------------
All our efforts are volunteer (pro-bono). Help us with a donation if you can (left column).
Lest we forget -
Progressive Eco-Group Admits It: Renewable Energy Is a Hoax that Benefits its Greenie Elmer Gantries like Al Gore
By John Eidson
Independent physicist John Droz, Jr. alerted me to the website of Deep Green Resistance (DGR), an international environmental organization that calls for the total destruction of what it refers to as the “global industrial economy,” AKA capitalism. Given the group’s hard-left credentials, its call for dismantling capitalism throughout the world is not surprising.
What is surprising is that in an unusual show of progressive candor, Deep Green Resistance openly acknowledges what skeptical scientists have been saying for more than two decades: that renewable energy is a government-backed hoax that enriches big corporations - and green energy investors like Al Gore - at the expense of taxpayers and the environment. If you find that admission hard to believe, please keep reading. The questions and answers below are verbatim from the FAQ page on the organization’s website.
Will green technology save the planet?
No. Wind turbines, solar PV panels, and the grid itself are all manufactured using cheap energy from fossil fuels. When fossil fuel costs begin to rise such highly manufactured items will simply cease to be feasible.
Solar panels and wind turbines aren’t made out of nothing. They are made out of metals, plastics, and chemicals. These products have been mined out of the ground, transported, processed, manufactured. Each stage leaves behind a trail of devastation: habitat destruction, water contamination, colonization, toxic waste, slave labor, greenhouse gas emissions, wars, and corporate profits.
The basic ingredients for renewables are the same materials that are ubiquitous in industrial products, like cement and aluminum. No one is going to make cement in any quantity without using the energy of fossil fuels. And aluminum? The mining itself is a destructive and toxic nightmare from which riparian communities will not awaken in anything but geologic time.
From beginning to end, so called “renewable energy” and other “green technologies” lead to the destruction of the planet. These technologies are rooted in the same industrial extraction and production processes that have rampaged across the world for the last 150 years.
We are not concerned with slightly reducing the harm caused by industrial civilization; we are interested in stopping that harm completely. Doing so will require dismantling the global industrial economy, which will render impossible the creation of these technologies.
Will renewable energy save the economy?
Renewable energy technologies rely heavily on government subsidies, taken from taxpayers and given directly to large corporations like General Electric, BP, Samsung, and Mitsubishi. While the scheme pads their bottom lines, it doesn’t help the rest of us.
Further, this is the wrong question to ask. The industrial capitalist economy is dispossessing and impoverishing billions of humans and killing the living world. Renewable energy depends on centralized capital and power imbalance. We don’t benefit from saving that system.
Instead of advocating for more industrial technology, we need to move to local economies based on community decision-making and what our local landbases can provide sustainably. And we need to stop the global economy on which renewable energy depends.
“Stopping the global economy” means destroying the capitalist system that created here in America the most widespread prosperity the world has ever known. That a progressive eco-group would admit that the true agenda behind the push for renewable energy has nothing to do with “saving the planet” and everything to do with destroying capitalism is quite remarkable. To reinforce its position that renewable energy is a hoax, DGR’s website has a cartoon that shows dollar bills being sucked from a wind turbine directly into the pocket of a fat cat investor in subsidized green energy projects.
The Elmer Gantry of renewable energy
Few insiders have profited more from taxpayer-backed renewable energy projects than Al Gore. When he left the vice presidency in 2001, his net worth was estimated at $1 million to $2 million. Since then, his wealth has skyrocketed to $300 million, and if the climate change legislation he advocates is enacted, the former vice president stands to become a billionaire. Much of his enviable fortune has come from being an inside investor in government-backed renewable energy projects, many of which went belly up after the insiders made off with millions, leaving hardworking U.S. taxpayers stuck with the bill.
Like all wealthy eco-preachers, the Elmer Gantry of renewable energy uses his immense wealth to indulge in lavish living. When asked by Rep. Marsha Blackburn during his 2009 testimony before Congress whether he personally profits from his advocacy of global warming, Pastor Al professed a vow of poverty, and if you’ve never seen video of the tense encounter, you don’t want to miss it: “Every penny I have made I have put into a non-profit deal, the Alliance for Climate Protection, to spread awareness of why we have to take on this challenge. And Congresswoman, if you believe the reason I have been working on this issue for 30 years is out of greed, you do not know me.
Turned out Rep. Blackburn knows him quite well. As the greedy owner of a gargantuan green energy fortune, Pastor Al looked her squarely in the eye and denied making even a penny of profit. If every penny he makes goes into a non-profit deal, how did he end up with $300 million? The same way his alter ego pilfered money from the Lord: by concealing his true stripes.
As the social Utopians at Deep Green Resistance openly acknowledge, the push for a “green economy” is a scam that enriches big corporations and fat-cat investors like Al Gore. Shortly after teen climate activist Greta Thunberg gave an emotion-charged speech at the U.N. last September, I wrote about the renewable energy hoax in “The Cynical Plot behind Global Warming Hysteria.” If not for a totally corrupt Western media, two things would have happened years ago: man-made global warming theory would have been blown out of the water, and Pastor Al would have been called out as the self-righteous hypocrite he is.
An electrical engineering graduate of Georgia Tech and now retired, John Eidson is a freelance writer in Atlanta.
------------
Alarmist Claim Rebuttals
Below are a series of rebuttals of the 11 most common climate alarmists’ claims such as those made in the recently released Fourth National Climate Assessment Report.[2] The authors of these rebuttals are all recognized experts in the relevant
For each alarmist claim, a summary of the relevant rebuttal is provided below along with a link to the full text of the rebuttal, which includes the names and the credentials of the authors of each rebuttal.
Heat Waves - have been decreasing since the 1930s in the U.S. and globally Link Check for yourself at the data from the WMO here.
Hurricanes - this decade just ended as the second quietest for landfalling hurricanes and landfalling major hurricanes in the U.S since the 1850s. Link
Tornadoes - the number of strong tornadoes have declined over the last half century. Link
Droughts and Floods - no statistically significant trends. Link
Wildfires - decreasing since the very active 1800s. The increase in damage in recent years is due to population growth in vulnerable areas and poor forest management. Link NASA Earth Observatory shows here that globally fire acreage has declined 25% since 2003
Snowfall - increasing in the fall and winter in the Northern Hemisphere and North America with many records being set. Link
Sea level - the rate of global sea level rise on average has fallen by 40% the last century. Where it is increasing - local factors such as land subsidence are to blame. Link
Arctic, Antarctic and Greenland Ice - the polar ice varies with multidecadal cycles in ocean temperatures. Current levels are comparable to or above historical low levels. Link Link2
Alaska July 2019 heat records - this resulted from a warm North Pacific and reduced ice in the Bering Sea late winter due to strong storms. Record ice extent occurred with record cold in 2012. Link One of the coldest winters on record has followed with increased ice cover has followed.
Ocean Acidification - when life is considered, ocean acidification is often found to be a non-problem, or even a benefit. Link
Carbon Pollution as a health hazard - carbon dioxide (CO2) is an odorless invisible trace gas that is plant food and it is essential to life on the planet. It is not a pollutant..Link
Climate change is endangering food supply - the vitality of global vegetation in both managed and unmanaged ecosystems is better off now than it was a hundred years ago, 50 years ago, or even a mere two-to-three decades ago thanks in part to CO2. Link Video
See the full rebuttal and links to the details here.
See how The Green New Deal Would Be An Environmental Disaster here
Exposing the lies continues and has now breached the walls of the journal Nature.
Ocean acidification does not impair the behaviour of coral reef fishes (link).
Also
CO2 Emissions, Fossil Fuel Use and Human Longevity (Uploaded 9 January 2020)
by Dr. Craig Idso, CO2 Science
This video segment discusses the fundamental link between CO2 emissions and global life expectancy. It is patently false and borderline fraudulent to claim rising CO2 is enhancing human mortality rates, as many often do, when the data clearly demonstrate there are more people on earth today who are living longer and better lives because of rising CO2 and fossil fuel use…
Read a transcript of this video.
-----------
College campus climate change crusade
Predictions of climate gloom and doom have gotten more confident and dire with each passing year. But the passing years have not been kind to the certainty of their fruition.
As a new academic semester gets underway at the beginning of this new decade, the college campus is where catastrophic climate change has actually happened over the most recent decades. Like the inception of a violent storm, the destructive change had small beginnings.
The field of climatology in the 1970s, when I was a student of meteorology at Penn State, was rather cloistered, engaged in the tedious work of compiling facts and figures from decades of weather. The science was focused on collecting, analyzing and disseminating data from local, regional and global observations. Weather trends at the time indicated the potential return of ice-age conditions.
In the early 1980s, when the popular notion of an ice age from the 1970s was changing to machinations of the enhanced “greenhouse effect,” some of my university meteorology professors had their serious doubts about the new fervent forecast.
However, their challenges to the envisioned hothouse Earth faded as the fresh disaster paradigm quickly took hold. A new air of superiority was advancing. And with the atmospheric-science spotlight focused on climatology, climate scientists gained popular attention, including those in schools of higher learning, where groupthink can thrive and nurture intolerant stalks of “knowledge”.
Bad vibes from the hollow halls of academia result from perhaps the largest echo chamber on the planet. Still, without the financial fertilization from the deep pockets of Uncle Sam via opportunistic politicians - who can help grow a rudimentary prognostication into an absolute certainty - the runaway greenhouse effect hypothesis would not have gotten too far beyond the parochial greenhouse.
The college campus can be fertile ground for the production of biased views devoid of helpful added nutrients. Researchers whose entire knowledge tree is grown from grade school to grad school to professorship without leaving the schoolyard overlook the perspective found in real world working conditions. They seem to develop a mistrust of, even an adversarial attitude toward, work-a-day scientists who are off school property.
A significant departure from the qualms over out-of-school contributions can be found in the U.S. Environmental Protection Agency’s triennial air quality modeling conferences that are required by the federal Clean Air Act.
The 12th modeling conference held last October in Research Triangle Park in North Carolina showed an example for cooperation. I along with dozens of other air quality modelers from government, consulting and academia all had the opportunity to offer input to the federal government’s efforts to identify the best techniques to represent simulated relationships among pollution sources, dispersion conditions and receptors.
And, yes, scientists who represented industry concerns were treated with the dignity and respect so often signaled, but not practiced, in collegiate circles.
Elsewhere, in private meteorological consulting, Joe Bastardi, an extraordinary weather forecaster and historian that I have known since our student days at Penn State, has demonstrated that so called extreme weather events - events that are promoted as exceptional - can be predicted in advance based on their natural occurrence in history. Joe has shown how understanding of such inclement weather from the distant past (i.e., historic analogs) can lead to more accurate forecasts of the imminent future.
And, if these events can be predicted from their previous occurrence, doesn’t that call into question the claim that these events are somehow unusual and now based on human excesses?
Nonetheless, the promotion of “extreme weather” is a brilliant strategy by those pushing disastrous climate change. After all, everyone experiences such weather.
Weather extremes can become personal proof of disastrous climate change, especially to children who have a limited history of such events. No wonder kids skip class to air their angst in protest and even become passionate enough to be awarded “Person of the Year” recognition.
Fanning the flames of future futility are arrogant academicians along with science gurus, politicians, the media, Hollywood and all sorts of pious personages (holier-than-thou virtue signalers and sanctimonious scolds).
Regardless of the brand of climate crusaders or source of any current turmoil in the troposphere, imagined or real, the actual global climate is likely to change for the better long before the climate brightens on college campuses.
Anthony J. Sadar is a certified consulting meteorologist and author of “In Global Warming We Trust: Too Big to Fail” (Stairway Press, 2016).