


By Forrest Mims III, For the Express-News
In the early days of this column, concerned readers sent many questions about the earth’s ozone layer, which I began measuring in 1990. Today, public interest in the ozone layer has been replaced by concern about global warming.
Answering questions about global warming requires considerably more space than this 437-word column. So let’s focus in on the temperature history of Texas for now.
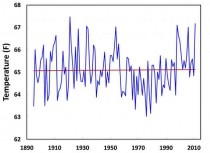
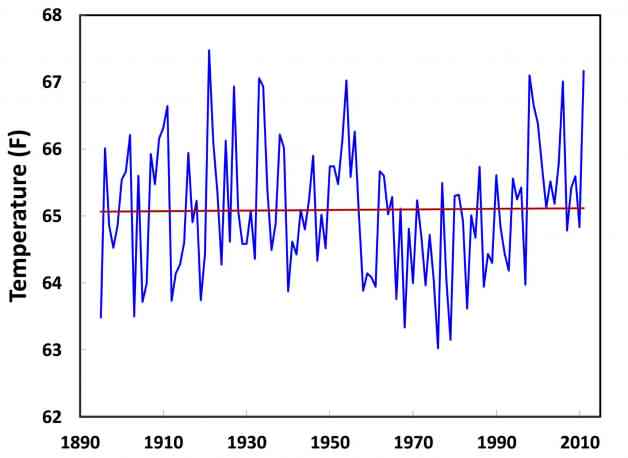
The 2011 Texas drought was exacerbated by the highest temperatures since 1895 during June, July and August. Several prominent climate scientists have blamed these record highs on global warming. These claims are puzzling because, in spite of the 2011 record highs, Texas records going back more than a century show slightly more cooling than warming. So I visited the National Climatic Data Center website to review Texas temperature records. The NCDC provides monthly temperature records for 10 Texas regions going back to 1895.
Enlarged
It also provides the average temperature for the entire state.
I retrieved all 12 months of data for each year since 1895 and plotted the average annual temperatures on a chart along with their trend. As shown in the chart, the average temperature of Texas barely changed between 1895 and 2011. The total warming during those 116 years was a statistically insignificant 0.046 degree Fahrenheit. If the record highs of 2011 are omitted, Texas cooled 0.055 degree from 1895 to 2010.
The NCDC temperature data do not fully account for the enhanced warming of weather stations that have become surrounded by buildings and pavement. This is the heat island effect. Dr. Daniel Boice of the Southwest Research Foundation studied the temperature at New Braunfels and San Antonio from 1946 to 1990.
He found that San Antonio has warmed when compared with its smaller neighbor. San Antonio might be several degrees cooler today than in 1885 if no new buildings and roads had been constructed. Why do some scientists insist that Texas is warming when the data show a negligible increase? I don’t know. But I do know that a National Science Foundation program officer told me that applications for atmospheric science grants that do not include a global warming theme stand little chance of acceptance.
Climate scientists are right to be concerned about droughts, especially since no Texas drought since precipitation records were begun around 1870 matches the megadroughts revealed in the rings of bald cypress trees. Those droughts occurred hundreds of years before SUVs and power plants began pumping carbon dioxide into the atmosphere, a process blamed for global warming that has not yet arrived in Texas.
Forrest Mims III, an expert reviewer for the Intergovernmental Panel on Climate Change, was named one of the 50 Best Brains in Science by Discover Magazine. His science is featured at http://www.forrestmims.org. Email him at forrest.mims@ieee.org.
Read more.
Author Note:My latest science column was on how the State of Texas has not warmed from 1895 through 2011, and I’m already dealing with a rather vicious hate mail and some warmists who are quite upset that I am denying global warming. The column was only about Texas, but that didn’t matter.
You can’t deny their religious beliefs. Data doesn’t matter. Ideology and theory and models only count to the believers. See this tragic example of another apocalyptic movement that led to a lost civilization.
---------------
Morocco’s Green dream fails climate test
Africa review
An unprecedented cold spell that struck Morocco in February and continues to linger well into March has raised serious questions about the countrys national agricultural development programme, which will fail to achieve its desired results if climate change continues to be mismanaged.
The ‘Green Morocco Plan’ was launched last year with the aim of remedying major obstacles that still hinder development of the agricultural sector, tackling everything from ensuring food security for 32 million Moroccans, to meeting the requirements of European markets, the biggest consumers of Moroccan produce.
However, the Plan does not do a thorough job of diagnosing climate factors, citing only drought, which it considers ‘periodical’, as an impediment to successful farming. The report does not address the sudden and unexpected arrival of cold weather, whose damages have been no less than disastrous.
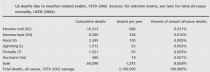
Last February, more than 8,200 of the countrys 8,700 hectares of potatoes, were ravaged. A further 14,000 of about 21,000 hectares reserved for sugarcane were also blighted by the cold. This is particularly significant since potatoes and sugar are two of Morocco’s primary export commodities.
“We have never seen such a degree of cold. All that we worked for was completely destroyed,” Ahmed El Aiboudi, a farmer from the Ouled Frej region, 120 kilometres south of Casablanca, said.
“We were not protected against this icy cold. Nobody expected it,” he added. Nevertheless, for climatologists, such changes have been inevitable.
Mohammed-Said Karrouk, professor of climatology at Hassan II Mohamedia University and a United Nations expert on climate change, told IPS, “The Green Morocco Plan does not contain any (concrete mention of) management of climate change. All that is considered is the management of water resources, (but what is really needed) is a method for managing the totality of the changes
By Dennis Ambler, SPPI Blog
On April 12th, the National Park Foundation announced their 2012 Parks Climate Challenge Program Grantees.
So what is the Parks Climate Challenge Program?
This is from the press release:
“Since 2009, the Parks Climate Challenge program has encouraged the use of national parks as classrooms to educate students about climate change through funding and facilitation. The ability to learn about this important issue through hands-on, science-based field curriculum, has proven a positive model through which to reach students.
“Climate change is a profound problem and the youth of America need to be at the forefront of the solution,” said Neil Mulholland, President and CEO of the National Park Foundation. “The Parks Climate Challenge is just one of our programs that empowers our youth and strengthens our parks.”
Now in its third year, the program first connects with teachers, giving them the tools to create engaging curriculum to teach to their student on the subject of climate change.”
The Parks Climate Challenge website says that:
“This website serves as a resource to provide all teachers with the tools necessary to be successful in delivering national park centric climate change lessons.”
They describe their program by referring to the “Climate Literacy Principles” developed by the National Oceanic Atmospheric Administration.
“These are the guiding and organizing principles for our resource offerings and are the measure by which you can judge the progress of your student’s understanding of climate change.”
Following the links takes us to the follow-up projects where these climate warriors pass on their new-found knowledge to even more vulnerable youngsters:
“After spending a month in North Cascades National Park and three days in Washington, DC, each student partnered with an elementary school class and their local national park to lead service projects in their home communities.”
The press release states that:
“This project was made possible through the generous support of Inner Spark Foundation and individual donors, and is done in partnership with the National Park Service and the National Park Foundation.”
A search for the Inner Spark Foundation reveals that it is a charitable foundation with an address in San Franciso, set up in 2006, with their latest IRS return filed in June 2010. There is no web site, and only details of one “officer”, with no details of trustees or a board of directors. In other words, it looks like a front organisation to hide the real sponsors of this program, whoever that might be.
The board of the National Parks Foundation is chaired by Ken Salazar and has as members, Ellen S. Alberding, President of the Chicago-based Joyce Foundation, where as a Senator, Barack Obama was a director and Peter Knight, President of Al Gore’s Generation Investment Management, New York.
A teacher’s comment on the Parks Climate Challenge website directs colleagues to the Alliance for Climate Education, ACE.
Who are they and what do they do?
ACE describe itself as the national leader in high school climate science education.
“We’re an award-winning national nonprofit dedicated to educating Americas high school students about the science behind climate change and inspiring them to do something about it -while having fun along the way. We’re based in Oakland, California, with educator teams in New York, Los Angeles, Chicago, Washington, DC, Atlanta, New England, Colorado, Nevada, North Carolina and Wisconsin.
ACE delivers two core offerings: the ACE Assembly and Student Action Program.”
Who funds them?
“ACE is a 501 (c)(3) public charity. Our supporters play a significant role in the success of our work and we are honored to have the support of government agencies, private foundations, companies and individuals.”
The list includes Ebay, Google, Walt Disney, Walmart, McKibbens 350, Saatchi and Saatchi, and many other organisations. They say about their donors:
“ACE will always be led by the world’s scientific consensus on climate change and will only accept funding if the prospective donor is committed to educating youth on the most updated climate science. The science ACE programs are built on will continue to be: (a) based on the most recent reports of the IPCC (Intergovernmental Panel on Climate Change), some of the most heavily reviewed scientific work in history; and (b) reviewed by ACE’s Science Advisory Board - which includes some of the world’s leading climate scientists.”
It just so happens that their Science Advisory Board contains IPCC authors Kevin Arrigo, Reto Knutti and Terry Root from Stanford and AR4 WG1 lead author Susan Soloman from NCAR.
“ACE will never allow any funder to alter ACE’s commitment to educate students based on the world’s scientific consensus on climate change.
Any prospective corporate donation over $25K will be reviewed by a “Funding Review Committee” consisting of the ED, a staff member, a board member and an independent fundraising advisor. Before considering such corporate contribution, ACE’s Review Committee must determine that such corporation is committed to climate science education and curbing the causes of climate change.”
Another teacher-recommended link from the Parks Climate Challenge website is to National Geographic, where you can download a 124 page booklet called Changing Climate - A guide for teaching climate change in grades 3-8.
The National Geographic Education Foundation Board includes former EPA administrator William K Reilly. Mr Reilly’s other credits are as former President and Chairman of the World Wildlife Fund (WWF) and currently WWF Chairman Emeritus, Chairman of the Board of the ClimateWorks Foundation, Chairman of the Advisory Board for the Nicholas Institute for Environmental Policy Solutions at Duke University, Co-Chairman of the Bipartisan Policy Center Energy Project, Co-Chairman of the Board of the Global Water Challenge, and a Director of the Packard Foundation.
The European Version - Teachers Corner
These appalling propaganda pieces are for use with children up to the ages of nine years old. (H/T An Englishman’s Castle): This book explains the causes and effects of climate change through the story of a boy who helps firemen extinguish a forest fire and save his friend Lila the fox.
This is the agenda that passes for climate science teaching in schools the world over and government agencies are all heavily involved in promoting the IPCC version of climate knowledge. Isn’t it ironic that the Heartland Institute was accused of attempting to “subvert the teaching of science”, when children are given such distorted information as fact by the education system.
NOTE: Heartland Conference: The Heartland Institute’s Seventh International Conference on Climate Change (ICCC-7) will take place in Chicago, Illinois from Monday, May 21 to Wednesday, May 23, 2012 at the Hilton Chicago Hotel, 720 South Michigan Avenue. The event will follow the NATO Summit taking place in Chicago on May 19-21. The Theme is Real Science, Real Choices. Open to the public, registration is required.
See Alan Caruba’s post on a Fighting Mad Heartland Institute.
---------------------
---------------
By Art Horn
In 1949 George Orwell published his now legendary book 1984. The book told a story about a world run by three super governments. Those governments had complete control over the lives of the people who lived in them. In the county of Oceania where the story takes place “The Party’ was the absolute ruler and made all laws and wrote all “truth”. The Party would simply write whatever it wanted to about anything so as to keep control over everything. All private property had been confiscated. There were no privately run companies. All of the so called truth was published and broadcast from the “Ministry of Truth”. In reality whatever truth was really out there was never published or broadcast. In effect there was no real truth, only convenient truth. The truth could be changed from day to day even hour to hour depending on how the Party wanted the “truth” to serve them.
There are interesting parallels in today’s world. Just because some of the warnings Orwell sounded back then didn’t appear to materialize in 1984 doesn’t mean he had the wrong ideas. His timing was just a little off. For instance today the Environmental Protection Agency, the EPA (can you say The Ministry of Truth) declared on Monday, December the 7th (Pearl Harbor Day) that carbon dioxide represent a serious health threat to all Americans. The justification for this declaration came from a 2007 Supreme Court decision calling carbon dioxide pollution and is therefore covered by the Clean Air Act.
Lisa Jackson, head of the EPA is making use of something Orwell called “Doublethink”. In the book doublethink is “The power of holding two contradictory beliefs in one’s mind simultaneously, and accepting both of them. To tell deliberate lies while genuinely believing in them, to forget any fact that has become inconvenient, and then, when it becomes necessary again, to draw it back from oblivion for just as long as it is needed, to deny the existence of objective reality and all the while to take account of the reality which one denies.” It is now convenient for the EPA to label a trace gas that is beneficial to all plant and animal life as a pollutant. She is well aware that carbon dioxide is not pollution. Submariners live under water for months with concentrations of carbon dioxide up to 10,000 part per million with no ill effects. Current atmospheric levels of carbon dioxide are at 392 parts per million. Actually carbon dioxide is an asphyxiant gas and not classified as toxic or harmful.
The EPA might argue that too much carbon dioxide in the air, caused by the burning of fossil fuels, will cause global warming and thus represents a serious threat to people and the environment and therefore justifies calling it pollution. One can die from drinking too much water but that doesnt make water pollution. It simple means someone had too much of a good thing. By employing doublethink the EPA can simultaneously know that carbon dioxide is not pollution but declare that it is if it suites their needs at the moment. It may not be the strict definition of doublethink but it sure is close.
Another interesting parallel to the book is how “the truth” about something can be changed to suite those in power. In contemporary context this could be the climate of the past. In 1984 the Party slogan proclaimed “Who controls the past controls the future. Who controls the present controls the past. In the book “The Ministry of Truth” was responsible for all propaganda (contemporary examples: carbon dioxide is pollution or the world is warming rapidly) and would re-write any historical fact to agree with the thinking of The Party. Orwell wrote If all others accepted the lie which the Party imposed-if all records told the same tale-then the lie passed into history and became truth” Orwell’s book was probably intended to be a warning for free people to be on the lookout for such revisions of history that can be used to satisfy the desires of those in power. Today, sixty three years after the book was published it appears that science itself is being re-invented.
The Goddard Institute for Space Studies (GISS) is a division of NASA located on the campus of Columbia University in New York. In 1999 it produced a graph of United States temperature anomaly from 1880 to 1999. It clearly showed that the year 1934 was much warmer than the next warmest year, 1998. The anomaly showed that 1934 was 0.6 degrees Celsius or 1.1 degrees Fahrenheit warmer than 1998. By the time the graph of United States temperature anomaly had undergone several “adjustments” by the Goddard Institute the 2010 version showed that remarkably, 1934 had “cooled” 0.3 degrees Celsius or 0.5 degrees Fahrenheit and equally amazingly, 1999 had warmed 0.4 degrees Celsius or 0.7 degrees Fahrenheit! Now in the new reality 1998 was warmer than 1934. These “adjustments” to the temperatures were not done all at once. They were done in tiny steps over a period of 11 years. Does this sound familiar? If all others accepted the lie which the Party imposed-if all records told the same tale-then the lie passed into history and became truth. Who controls the past controls the future. Who controls the present controls the past. By cooling the past gradually and warming the present the new truth will show that the earth is warming much faster than it actually is.
A striking example of a large institution changing the past climate to suite their own agenda took place at the end of the 21st century. Prior to its 2001 meeting, the United Nations Intergovernmental Panel on Climate Change (IPCC) had acknowledged and published in their reports on climate change, a graph that showed a Medieval Warm Period from about the year 1000 to 1350. It clearly showed that for a part of that warm period the average temperature of earth was warmer than today. The graph also showed that there existed a Little Ice Age from about 1400 to around 1900. The average temperature was significantly colder than today and that the temperature of earth had been slowly warming for over 300 years.
In their 2001 report the IPCC decided that this history of the earth’s climate for the last 1,000 years would not be helpful in propelling the agenda they had in mind. That agenda was and is total control of the climate change debate and then to use that control to accelerate their goal of redistributing the worlds wealth as they see fit. Then they found the “Hockey Stick” graph. It showed almost no temperature change over the last thousand years until the 20th century when the graph showed the temperature shooting upward. This pleased the IPCC and it was adopted as “truth”. By accepting a completely new history of the climate they simply erased all the research that had conclusively determined that the Medieval Warm Period and the Little Ice Age existed. In Orwells book there is a section where Winston Smith, the principal character, says “If the Party could thrust its hand into the past and say that this or that event, -it never happened- that, surely, was more terrifying than mere torture and death.”
If everyone accepts the new truth as reality than the Orwellian warning will be missed. Fortunately some brave men have stepped forward and are speaking out. Some 49 former NASA employees and Astronauts have written a letter that strongly recommends that NASA and GISS refrain from including unproven remarks in public releases and websites. The entire letter is here in Energy Tribune.
Those who currently control the climate of the past can manipulate the data. In doing they make past and current trends in temperature, sea level rise, ice melt, frequency of tornadoes, hurricanes, floods, droughts and anything else they can think of look unusual and alarming. All of this is of course caused by the use of fossil fuels. Everyone alive on this planet is subject to weather and climate changes. Controlling what the data says about those changes can be critical in forming policies that attempt to control the climate and therefore the people and industries that are allegedly causing those changes.
In the book 1984 the Party attained complete and total control over everyone by taking control of everything. Controlling the people and industries that are (supposedly) destroying the climate of the future is a powerful tool in controlling everything and everyone. If youve never read 1984 you should. If you have, you should read it again. You’ll find a lot of insight into how global warming “science” and politics works today in nineteen eighty twelve.
FOR IMMEDIATE RELEASE
Contact:Blanquita Cullum
703-307-9510
bqview@mac.com
Joint letter to NASA Administrator blasts agencys policy of ignoring empirical evidence
HOUSTON, TX - April 10, 2012. 49 former NASA scientists and astronauts sent a letter to NASA Administrator Charles Bolden last week admonishing the agency for its role in advocating a high degree of certainty that man-made CO2 is a major cause of climate change while neglecting empirical evidence that calls the theory into question.
The group, which includes seven Apollo astronauts and two former directors of NASAs Johnson Space Center in Houston, are dismayed over the failure of NASA, and specifically the Goddard Institute For Space Studies (GISS), to make an objective assessment of all available scientific data on climate change. They charge that NASA is relying too heavily on complex climate models that have proven scientifically inadequate in predicting climate only one or two decades in advance.
H. Leighton Steward, chairman of the non-profit Plants Need CO2, noted that many of the former NASA scientists harbored doubts about the significance of the C02-climate change theory and have concerns over NASA’s advocacy on the issue. While making presentations in late 2011 to many of the signatories of the letter, Steward realized that the NASA scientists should make their concerns known to NASA and the GISS.
“These American heroes - the astronauts that took to space and the scientists and engineers that put them there - are simply stating their concern over NASA’s extreme advocacy for an unproven theory,” said Leighton Steward. “There’s a concern that if it turns out that CO2 is not a major cause of climate change, NASA will have put the reputation of NASA, NASA’s current and former employees, and even the very reputation of science itself at risk of public ridicule and distrust.”
Select excerpts from the letter:
"The unbridled advocacy of CO2 being the major cause of climate change is unbecoming of NASA’s history of making an objective assessment of all available scientific data prior to making decisions or public statements.”
"We believe the claims by NASA and GISS, that man-made carbon dioxide is having a catastrophic impact on global climate change are not substantiated.”
"We request that NASA refrain from including unproven and unsupported remarks in its future releases and websites on this subject.”
The full text of the letter:
March 28, 2012
The Honorable Charles Bolden, Jr.
NASA Administrator
NASA Headquarters
Washington, D.C. 20546-0001
Dear Charlie,
We, the undersigned, respectfully request that NASA and the Goddard Institute for Space Studies (GISS) refrain from including unproven remarks in public releases and websites. We believe the claims by NASA and GISS, that man-made carbon dioxide is having a catastrophic impact on global climate change are not substantiated, especially when considering thousands of years of empirical data. With hundreds of well-known climate scientists and tens of thousands of other scientists publicly declaring their disbelief in the catastrophic forecasts, coming particularly from the GISS leadership, it is clear that the science is NOT settled.
The unbridled advocacy of CO2 being the major cause of climate change is unbecoming of NASA’s history of making an objective assessment of all available scientific data prior to making decisions or public statements.
As former NASA employees, we feel that NASAs advocacy of an extreme position, prior to a thorough study of the possible overwhelming impact of natural climate drivers is inappropriate. We request that NASA refrain from including unproven and unsupported remarks in its future releases and websites on this subject. At risk is damage to the exemplary reputation of NASA, NASA’s current or former scientists and employees, and even the reputation of science itself.
For additional information regarding the science behind our concern, we recommend that you contact Harrison Schmitt or Walter Cunningham, or others they can recommend to you.
Thank you for considering this request.
Sincerely,
(Attached signatures)
CC: Mr. John Grunsfeld, Associate Administrator for Science
CC: Ass Mr. Chris Scolese, Director, Goddard Space Flight Center
Ref: Letter to NASA Administrator Charles Bolden, dated 3-26-12, regarding a request for NASA to refrain from making unsubstantiated claims that human produced CO2 is having a catastrophic impact on climate change.
/s/ Jack Barneburg, Jack - JSC, Space Shuttle Structures, Engineering Directorate, 34 years
/s/ Larry Bell - JSC, Mgr. Crew Systems Div., Engineering Directorate, 32 years
/s/ Dr. Donald Bogard - JSC, Principal Investigator, Science Directorate, 41 years
/s/ Jerry C. Bostick - JSC, Principal Investigator, Science Directorate, 23 years
/s/ Dr. Phillip K. Chapman - JSC, Scientist - astronaut, 5 years
/s/ Michael F. Collins, JSC, Chief, Flight Design and Dynamics Division, MOD, 41 years
/s/ Dr. Kenneth Cox - JSC, Chief Flight Dynamics Div., Engr. Directorate, 40 years
/s/ Walter Cunningham - JSC, Astronaut, Apollo 7, 8 years
/s/ Dr. Donald M. Curry - JSC, Mgr. Shuttle Leading Edge, Thermal Protection Sys., Engr. Dir., 44 years
/s/ Leroy Day - Hdq. Deputy Director, Space Shuttle Program, 19 years
/s/ Dr. Henry P. Decell, Jr. - JSC, Chief, Theory & Analysis Office, 5 years
/s/Charles F. Deiterich - JSC, Mgr., Flight Operations Integration, MOD, 30 years
/s/ Dr. Harold Doiron - JSC, Chairman, Shuttle Pogo Prevention Panel, 16 years
/s/ Charles Duke - JSC, Astronaut, Apollo 16, 10 years
/s/ Anita Gale
/s/ Grace Germany - JSC, Program Analyst, 35 years
/s/ Ed Gibson - JSC, Astronaut Skylab 4, 14 years
/s/ Richard Gordon - JSC, Astronaut, Gemini Xi, Apollo 12, 9 years
/s/ Gerald C. Griffin - JSC, Apollo Flight Director, and Director of Johnson Space Center, 22 years
/s/ Thomas M. Grubbs - JSC, Chief, Aircraft Maintenance and Engineering Branch, 31 years
/s/ Thomas J. Harmon
/s/ David W. Heath - JSC, Reentry Specialist, MOD, 30 years
/s/ Miguel A. Hernandez, Jr. - JSC, Flight crew training and operations, 3 years
/s/ James R. Roundtree - JSC Branch Chief, 26 years
/s/ Enoch Jones - JSC, Mgr. SE&I, Shuttle Program Office, 26 years
/s/ Dr. Joseph Kerwin - JSC, Astronaut, Skylab 2, Director of Space and Life Sciences, 22 years
/s/ Jack Knight - JSC, Chief, Advanced Operations and Development Division, MOD, 40 years
/s/ Dr. Christopher C. Kraft - JSC, Apollo Flight Director and Director of Johnson Space Center, 24 years
/s/ Paul C. Kramer - JSC, Ass’t for Planning Aeroscience and Flight Mechanics Div., Egr. Dir., 34 years
/s/ Alex (Skip) Larsen
/s/ Dr. Lubert Leger - JSC, Ass’t. Chief Materials Division, Engr. Directorate, 30 years
/s/ Dr. Humbolt C. Mandell - JSC, Mgr. Shuttle Program Control and Advance Programs, 40 years
/s/ Donald K. McCutchen - JSC, Project Engineer - Space Shuttle and ISS Program Offices, 33 years
/s/ Thomas L. (Tom) Moser - Hdq. Dep. Assoc. Admin. & Director, Space Station Program, 28 years
/s/ Dr. George Mueller - Hdq., Assoc. Adm., Office of Space Flight, 6 years
/s/ Tom Ohesorge
/s/ James Peacock - JSC, Apollo and Shuttle Program Office, 21 years
/s/ Richard McFarland - JSC, Mgr. Motion Simulators, 28 years
/s/ Joseph E. Rogers - JSC, Chief, Structures and Dynamics Branch, Engr. Directorate,40 years
/s/ Bernard J. Rosenbaum - JSC, Chief Engineer, Propulsion and Power Division, Engr. Dir., 48 years
/s/ Dr. Harrison (Jack) Schmitt - JSC, Astronaut Apollo 17, 10 years
/s/ Gerard C. Shows - JSC, Asst. Manager, Quality Assurance, 30 years
/s/ Kenneth Suit - JSC, Ass’t Mgr., Systems Integration, Space Shuttle, 37 years
/s/ Robert F. Thompson - JSC, Program Manager, Space Shuttle, 44 years
/s/ Frank Van Renesselaer - Hdq., Mgr. Shuttle Solid Rocket Boosters, 15 years
/s/ Dr. James Visentine - JSC Materials Branch, Engineering Directorate, 30 years
/s/ Manfred (Dutch) von Ehrenfried - JSC, Flight Controller; Mercury, Gemini & Apollo, MOD, 10 years
/s/ George Weisskopf - JSC, Avionics Systems Division, Engineering Dir., 40 years
/s/ Al Worden - JSC, Astronaut, Apollo 15, 9 years
/s/ Thomas (Tom) Wysmuller - JSC, Meteorologist, 5 years
Heidi Cullen and Joe Romm and the many enviro journalists predictably blamed recent tornado outbreaks in 2012 and especially 2011 on greenhouse gases. This submission is from an employee of the same company Cullen worked at who asked to remain anonymous. She often had eyes rolling with her bad science. And what can you say about Romm. Both now are employees of George Soros - which speaks volumes
I recently asked SPC for the U.S. annual list of tornado count, fatatlies, and killer tornadoes.
They sent me the list. Official records begin in 1950.
This provides a good opportunity to examine an official data set and realize they can sometimes be misleading, especially when trying to determine trends over an extended period of time.
1) There is a significant spike in annual tornado count starting in 1953. This was the year the Severe Local Storms (SELS) unit, forerunner of SPC, was established for around the clock severe storm monitoring. Tornado reporting was encouraged by the U.S. Weather Bureau for documentation and watch/warning verification purposes, hence the increase in count.
2) Starting in 1990, you see another significant spike to above 1000 in tornado count. This year marked the first installation of NEXRADs and around this time, storm chasing was beginning to ramp up in popularity. Both of these resulted in more tornadoes being reported, verified, and documented.
3) After 1990, the NWS Modernization occurred over the next several years, and investigation of tornado reports and post damage storm surveys at each new WFO country warning area ramped up considerably, leading to a more representative count of tornadoes per year, staying above 1000 for all years afterwards except 2002.
4) Storm chasing really took off after the release of the movie ‘Twister’ in 1996 and has continued to grow ever since. This continued to increase/sustain higher annual tornado counts.
5) By the middle part of the first decade of the new millennium, digital cameras were rapidly replacing traditional slide and print film. This eliminated the long processing times of film, allowing for not only more tornadoes to be verified and documented, but also in a more timely manner.
6) By the end of the first decade of the new millennium, social media such as Facebook and Twitter allowed instant reporting of tornadoes in real time. Wireless Internet had been firmly established for the now ubiquitous smartphone/mobile device, combined with built-in digital still picture and video cameras, made tornado reporting and verification even quicker and more efficient. Also, tornadoes took front and center in the mainstream media, both in the daily news and reality shows.
So all the above shows that a data set can be misleading over an extended period of time if you do not take into account changes in things like technology, population, and public awareness, as three examples. Despite all this, we still too low in the annual tornado count. By how much on average?, difficult to say, but likely by a few hundred. We document nearly all the the significant tornadoes, but smaller, short live ones are missed, due to darkness, poor visibility, and/or remoteness of location. We are finding tornadoes in the Rockies and Great Basin and more common than once thought. Given the low population density and large area, it is likely these areas of the country are
where we miss the most tornadoes.
Some other notes...you can see the number of tornado fatalities can highly vary from year to year going back to to 1950. Overall though, there has been downward trend in fatatlies long term. However, the benefits of better warnings and awareness/preparation is constantly being tempered by the growing population.
Year U.S. Population
1950 151,325,798
1960 179,323,175
1970 203,211,926
1980 226,545,805
1990 248,709,873
2000 281,421,906
2010 308,745,538
We have doubled in population in 60 years. Put simply, there are just more people in the way of tornadoes every year. In addition, population in and around the larger cities has become denser, so the potential of very high death tolls for when a large, violent tornado plows through any of the larger cities is becoming more and more likely as time goes on.
So I think this shows to a respectable, if not a large degree, tornadoes are only becoming “worse” not due to meteorological or climatological reasons, but more due to technological and sociological reasons.
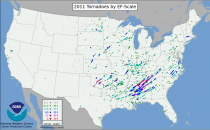
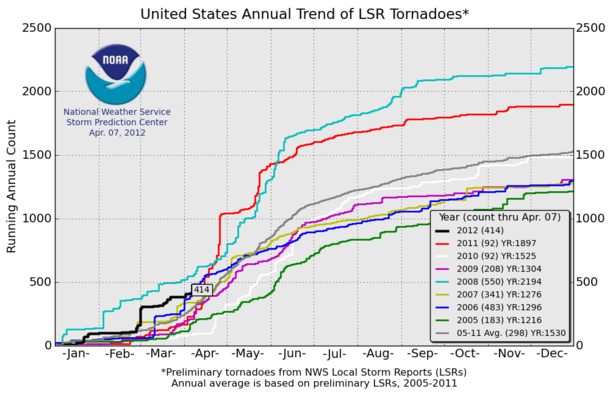
In terms of strong tornadoes, despite all the bloviating by Cullen and Romm about the 2011 barages, the final numbers SPC concluded were not unprecedented but typical of the cold PDO La Ninas of the 1950s to 1970s.

Enlarged.
And the count this year even with the big March outreak which was due to very cold air aloft is in the middle of the of the last decade even before the adjustment down for multiple report of the same tornadoes.

Being we are coming off La Nina and the PDO is still negative, we WILL see more outbreaks but remember 2011 was special since it was the second strongest La Nina on record (behind 1917/18 or 1955/56 depending on measure used). It was responsible for the flooding, drought, tornadoes, hurricane and snows.
PUBLIC INFORMATION STATEMENT
NATIONAL WEATHER SERVICE ANCHORAGE AK
411 PM AKDT SAT APR 7 2012
..ANCHORAGE MAKES HISTORY WITH A RECORD SNOWFALL SEASON
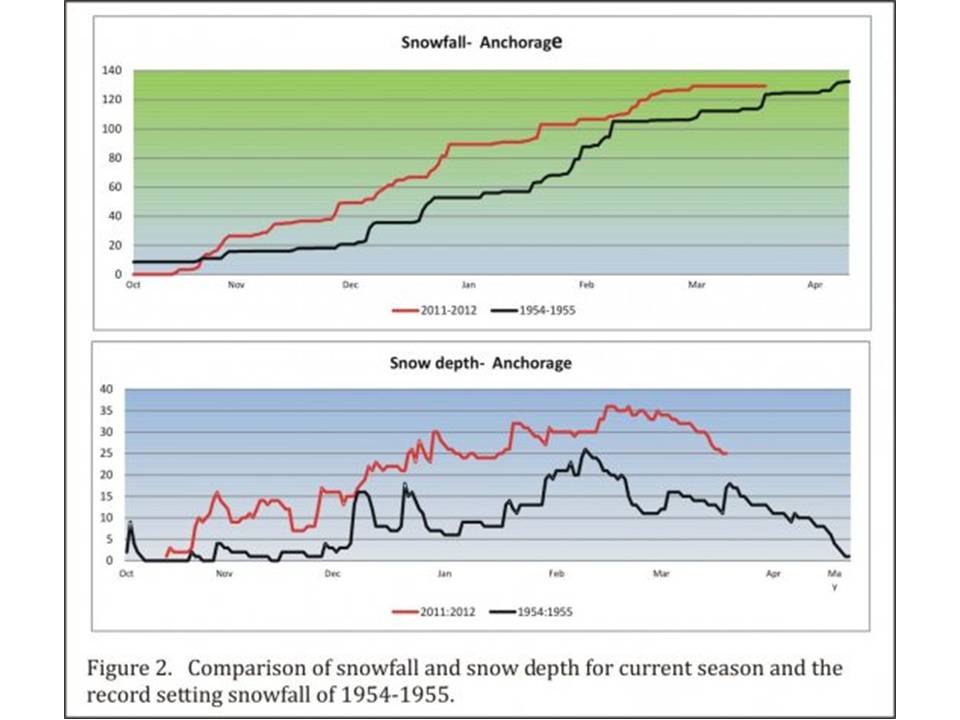
AS OF 4 PM AKDT SATURDAY AFTERNOON...3.4 INCHES OF NEW SNOW HAS FALLEN SINCE MIDNIGHT. THIS MAKES THE 2011-2012 WINTER SEASON THE SNOWIEST EVER WITH A TOTAL OF 133.6 INCHES. THE PREVIOUS SEASONAL SNOWFALL RECORD WAS 132.6 INCHES SET IN 1954-1955.
This analysis below was compiled a few dayts ago by John Papineau, climatologist at the Anchorage office of the National Weather Service with photo by NASA Earth Observatory.
--------------------
As of April midday April 7 we have received 131.7 inches of snow making it the second snowiest winter, (just 0.9 inches below the all-time record) and the season isnt over. Blowing snow and icy roads at times have made for some challenging driving. Snow berms have limited vision, particularly along narrow snow-choked side streets.
Nevertheless it has been a boom season for snow removal contractors and auto body repair shops. Skiers enjoyed a season of plenty when it wasnt windy, rainy or locked in a deep freeze of sub-zero temperatures.
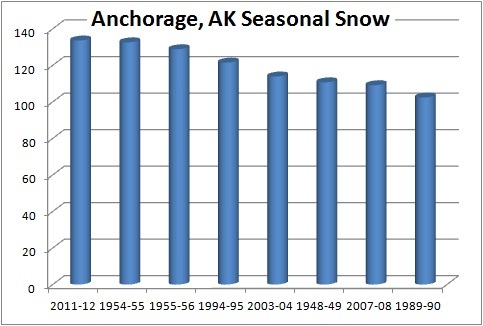
Normal winter: 75 inches of snow
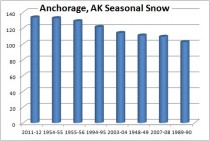
Eight Anchorage winters have seen snowfalls exceeding 100 inches, topped by the 1954-55 total of 132.6. Those measurements have been taken at a number of locations throughout the years. From 1998 to the present snowfall and snow depth has been measured at the National Weather Service Office, located just south of the airport. From 1953 through 1998, snow measurements were taken at Point Campbell, located on a knoll adjacent to the east-west runways at the airport. Before 1953, observations were taken at Merrill Field and various spots downtown. Some of these locations are windier than others during the winter, so there is some geographic variability—but the current location and Point Campbell are close enough for one continuous record.
The current 30-year mean Anchorage snowfall is 74.5 inches. Going back a full 81 years, the mean is 68.7 inches. Prior to 1953, snowfall was less than recent decades for some reason. Whether the difference is due to the location of the observations, or an actual change in snowfall, is unknown.
But no matter how you look at it, this winter was white—not only in Anchorage but throughout Southcentral and across much of Alaska. Although the official snowfall measurement is taken in west Anchorage, snow depth varies greatly across town. On the upper Hillside for example several locations have measured more than 200 inches of snow this season.
It all began Oct. 30 when the snow season got off to a humble start with 1.1 inches at the National Weather Service forecast office. Snowfall has been fairly consistent all winter. The longest dry stretch in mid-winter was a 10-day stretch during the mid-January cold spell. Currently we are in a 22-day drought.
Snow reached its greatest depth of 36 inches in late February and early March. As deep as that is, its not close to the record of 47 inches on Dec. 31, 1955. A year later in February and again in mid-March of 2002, the depth reached 39 inches.
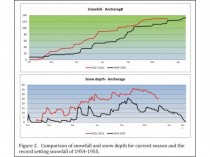
Figure 2 shows the month-to-month ‘path’ that the record snowfall took in comparison with the previous record of 1954-1955. Snow started later this season but outpaced the old record by early November. Only since mid-February have the two been close.
It is apparent that this winter shares characteristics with previous big snow years—most snow came in small increments rather than in large doses. A comparison of the number of snow days, defined as any day with at least 0.1 inches of snowfall, and the number of days where 6 inches of more snow fell.
Astute readers will noticed that three of the highest snowfall totals shown in Figure 1 have occurred in the last nine seasons. This begs the question whether we are experiencing an increase in snowfall or precipitation. There does not appear to be any trend in the data at this point, but its worth monitoring.
Historical data indicates no correlation between the occurrence of an El Nino or La Nina and the amount of snowfall in Anchorage. It is noteworthy that both the heavy snow seasons of 1954-1955 and 1955-1956 were La Nina winters. However, since the North Pacific climate shift of 1977, there has been 10 La Nina’s with an average snowfall of approximately 78 inches. There have been 11 El Nino events since 1977 producing an average of 74 inches of snow. Weather patterns during a given El Nino or La Nina in the greater Alaska region are less predictable than they are in the mid-latitudes due to the highly unstable positioning of the storm track across the southern Bering Sea and Gulf of Alaska.
In fact, of the 10 wettest (snow plus rain) winters since 1977 in Anchorage, three occurred during La Nina winters, three during El Nino’s winters and four during neutral winters. The primary difference between La Nina’s and El Nino’s is that there is a higher probability that a La Nina winter will be cooler than an El Nino winter.
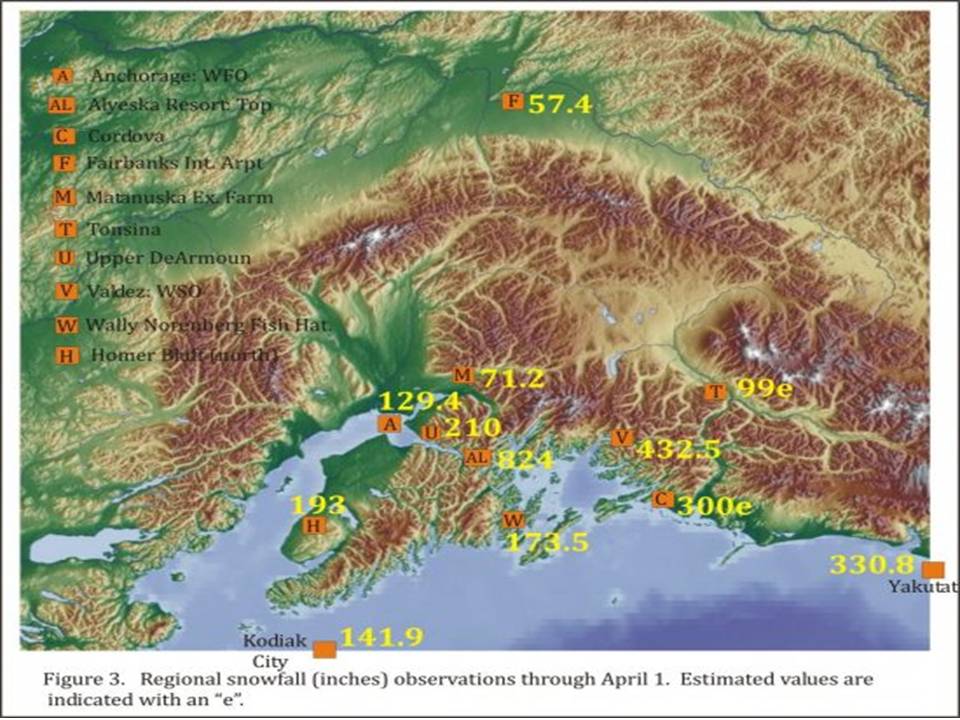
Heavy snow throughout region
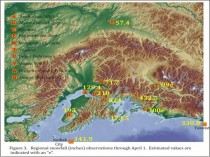
Figure 3 shows snowfall around the region; virtually all locations south of the Alaska Range have received well above normal amounts. Kodiak is close to setting a new snowfall record. Valdez has gotten lots of snow but is well behind its record of 550.7 inches set in 1989-1990. Although snowfall in Yakutat has also been well above normal, it is still some ways from its record of 403.2 inches set in 1975-1976.
Despite several days in the 40s recently, our snow season isn’t over yet, so who knows how much more we could receive over the next several weeks.
What many residents are wondering is how long will it take for all this snow to melt? Although snowmelt began in earnest this past week, it could take a while. The most significant factor is the speed at which air temperatures warm in April. Second in importance is sunshine.
Sometimes the warming is abrupt and the snow melts rapidly, as in late March of 1995. Other years are slow and the snowpack bleeds off, as happened in April 2002. One advantage to abundant November snowfall is that it insulated the ground. So despite the deep snowpack, once everything melts, the frost depth should be less deep that in many years—meaning that the ground should warm fairly rapidly.
The current estimate of frost depth in Anchorage is around 15 inches; although frost depth data is very limited, this is indeed much shallower than what we would measure in a typical winter.
If we look at the melt-out dates (just a trace of snow remaining at the Forecast Office) of several of the big snow years, we see a wide range of dates. The advantage of an abrupt warming trend in spring is that the snow melts sooner and the frozen ground can begin to thaw.
The disadvantage is that all the water forms ponds in low-lying areas. That makes for fun - or challenging - driving. Some of these melt ponds refreeze overnight, making for even more fun the next morning.
Nearly 2 feet in late April
Note that in April of 2008 the snow in west Anchorage had melted out—but on the 25th a major snow storm produced another 15-22 inches across town. That pushed the ultimate melt out back to April 30.
It may not be over
Those who think we’re done with snowfall for this winter should note that more than 18 inches of snow fell in April of 1955 to set Anchorage’s snowfall record. While the average snowfall for April is around 4 inches, it can range between 0 and 30 inches.
Surprisingly, much of this season’s snow fell during cold stretches. As a rule of thumb, warm air—when the temperature near the ground is in the 20s to lower 30s—is more conducive to snowfall than chillier temperatures. If we look at how much snow fell when the daily mean air temperature was 10 degrees F or colder during other heavy snow seasons we find:
16.5 inches fell in 1954-1955;
11.5 inches in 1955-1956;
12.8 inches in 2007-2008.
However, this season 31.1 inches of snow fell on especially cold days. Why is a mystery at this point—but since this winter has been a tale of extremes throughout much of Alaska, we shouldn’t be too surprised.
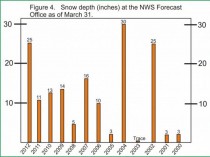
Enlarged.
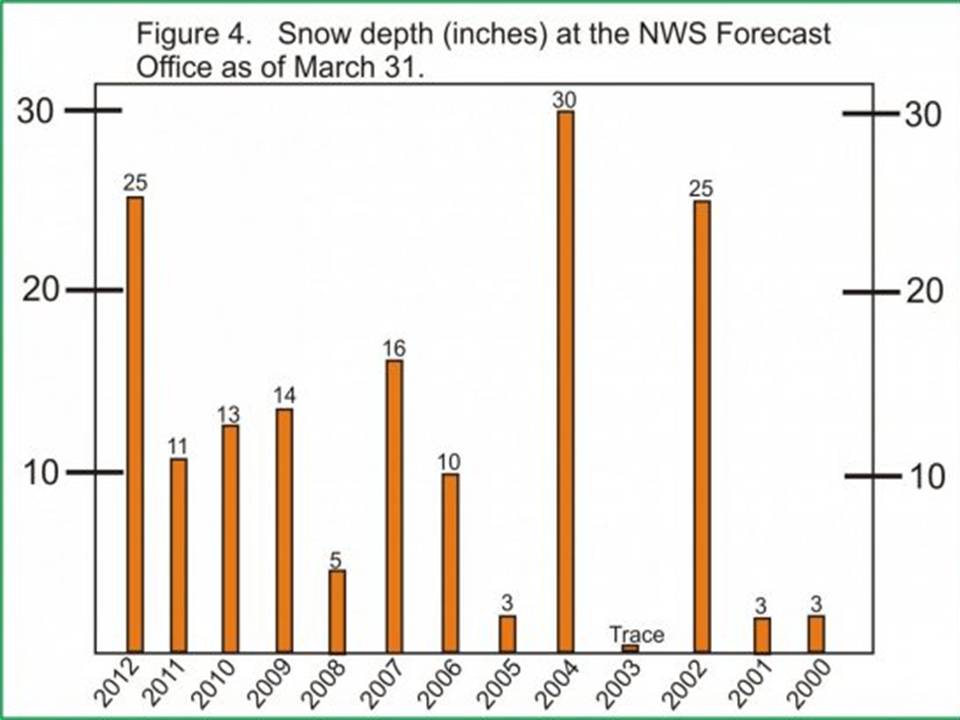
Figure 4 shows the snow depth on March 31 for the previous 12 years. Note that the current snow depth of 25 inches contains 6.4 inches of water, which means that if this amount of snow was suddenly melted it would release this much water. The range is from zero to 30 inches so our current value is on the high side but not extreme.
So what produced all the snow? Weather maps produced over the course of the winter indicate the storm track across the eastern North Pacific was shifted farther north than in most winters. Why is anybody’s guess, but the result was more storms in the Gulf of Alaska—with fewer reaching the western Lower 48 states.
Look at how many days brought rain or snow to the Gulf of Alaska coast from January through March. In Yakutat, typically 59 out of 90 days bring some precipitation—rain or snow. This past season saw 78.
The number of snow days during this three month period averages 38 days; this season had 61 days. During years of heavy snowfall, the increase is typically due to an increase in the number of storms rather than more snow from the same number.
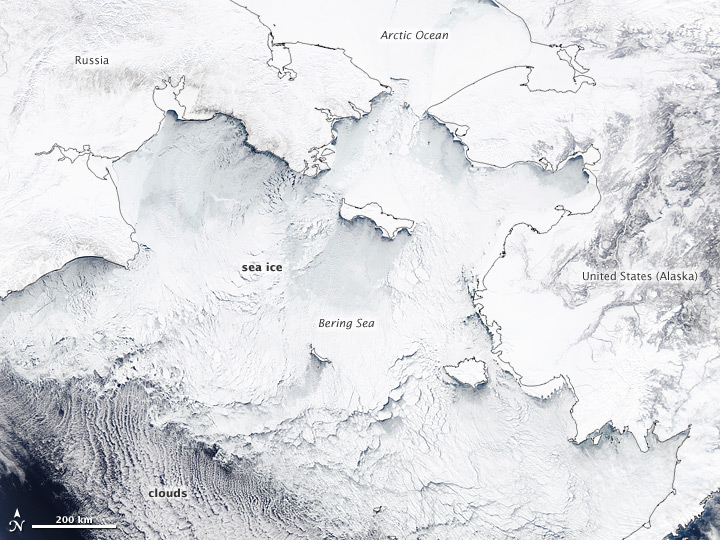
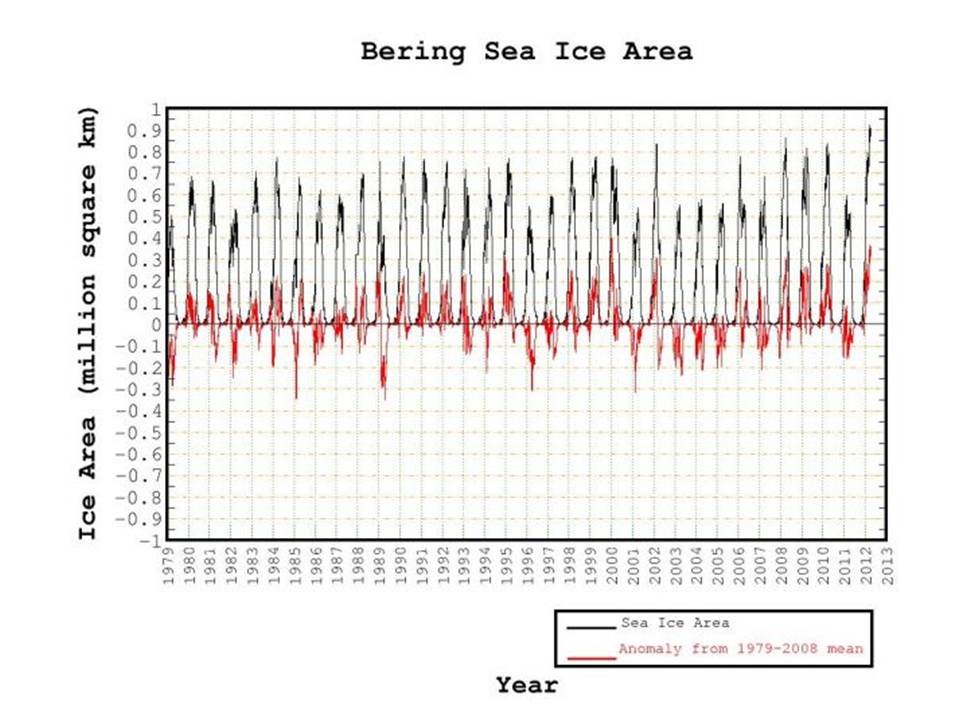
See the ice in the Bering Sea from NASA Earth Observatory.
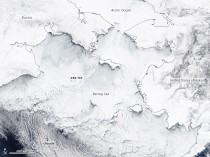
Enlarged.
The extensive ice coverage here helped the arctic ice extent exceed the 1979-2006 average for the first time in many years.
Also note:
Alaska Has The Most Ice Ever Recorded
by Steven Goddard
Alaska has blown away all records for sea ice this winter. Four of the five iciest years around Alaska have been since 2007. Look for the MSM to respond by publishing stories about drowning Polar Bears who can’t find any ice.

--------------------
Moscow gets slammed with spring snowstorm
MOSCOW: Muscovites on Thursday woke up to a blanket of snow covering the Russian capital after a powerful cyclone brought a winter storm in the middle of spring.
“Last night a small but powerful cyclonic whirl hit the capital at a speed of 50 kilometres (31 miles) per hour bringing with it copious snowfall,” weather forecaster Fobos said.
“On the morning of April 5 Moscow has become white once again,” the weather forecaster said, adding however that frequent weather changes were fairly typical in the country in April.
Temperatures in the afternoon were expected to go up to two degrees Celsius (36 degrees Fahrenheit).
The snowstorm comes as a major test of patience for Muscovites who have endured an unusually cold and long winter lasting five months. Russians consider that spring begins on March 1.
So much for an ‘all of the above’ energy strategy.
For three years the Environmental Protection Agency has imposed a de facto ban on new coal-fired power while doing everything it can to harm existing coal plants. But for once there’s something good to say about the latest EPA carbon rule: At least the agency was less devious when it formalized the coal ban last week.
The EPA proposed what are known as “new source performance standards” for carbon under the Clean Air Act, which are part of the agency’s “endangerment finding” to limit greenhouse gas emissions. To control CO2, utilities will need to install new technology, such as capture-and-sequestration systems that are among the world’s most complex and expensive industrial equipment.
But great news: The EPA estimates that the total cost of this rule will be $0. It will have no major effect on the economy. Not a single job will be lost.
How can that be? In its cost estimates, the EPA assumes the U.S. will never complete another coal-fired project. Ever. The agency is conceding that coal development has been shut down as a result of its many new regulations, such as the recent mercury rule and the illegal permitting delays that a federal appeals court slapped down last week.
But there’s also a problem. Because the putative “regulatory impact” is zero, there are also no benefits. So why is the environmental lobby applauding the EPA’s new rule like a performing seal? Even the EPA itself says the performance standards will apply only to new plants, not the legacy fleet that generates almost half of U.S. electricity. The media were careful to repeat this claim too.
It isn’t true. Just as the new rule’s fine print reveals that the rules won’t apply to the new plants because they’ll never be built, it also shows that the rules will put old plants at risk because of another EPA program known as New Source Review.
Whenever a plant upgrades - whether installing a new fan blade or replacing the proverbial toilet seat - it must comply with every rule on the books. So as a utility obeys the mercury rule, say, it will also be caught in the pincer movement of these new carbon performance standards. The green lobby knows this will slowly kill even current coal plants over time.
The problem with carbon capture and storage - apart from costs - is that the technology is still speculative. Even with massive subsidies, not a plant in the world is diverting its CO2 on a commercial scale and injecting it into spent oil and gas reservoirs underground. The Energy Department says it will take 20 years or more to get to scale, and even that prediction has to be balanced against the bureaucracy’s lousy track record. As for plants in areas where such geological formations do not exist, well, they could build pipelines, but the White House has a thing about pipelines.
Everyone in Washington including President Obama claims to favor an “all of the above” energy portfolio. As misguided as that is - far better to let markets decide which energy sources to develop - the EPA has now admitted that Mr. Obama doesn’t really mean it. Coal is not part of his “all.” Voters in swing coal states such as Ohio and West Virginia probably do care about that.
In a HUFFPO piece last week, meteorologist Paul Douglas - a self proclaimed Christian and a republican and “began investigating climate science, and, over time, began to see the thumbprint of climate change—along with “… 97% of published, peer-reviewed PhD’s, who link a 40% spike in greenhouse gases with a warmer, stormier atmosphere.”
Of course that 97% claim, made so often is a bogus study based on what ended up being the opinion of just 79 scientists on whether the globe was warmer than 1800 (the mini ice age) abd whether man played a role in climate change. Most all skeptics would have voted yes as surely we are not in a mini ice age (though could be sooner than we think) and man does have a very measurable affect on local climate (microclimate) through urbanization.
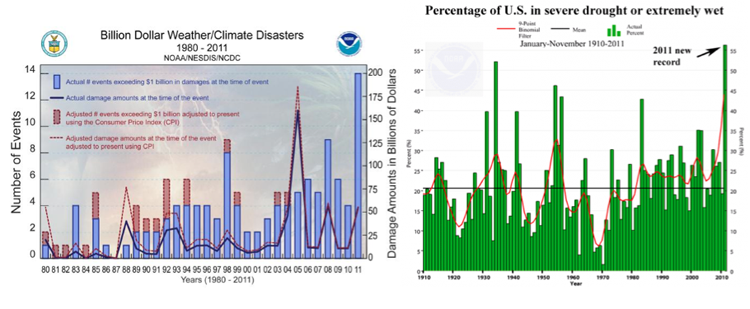
He found these NOAA charts especially convincing and credited ultra leftist Jeff Masters of the “Weather Underground” (named after the Alinsky Doerr radical 1960s group) for his interpretation.
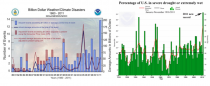
Roger responded to the graph on the left that shows billion dollar disasters
The National Oceanic and Atmospheric Administration is a federal agency that does a lot of excellent work related to weather, climate and the oceans. In fact, it is the primary sponsor of CIRES here at the University of Colorado where I serve as a Fellow. However, NOAA has been publishing information related to disasters that is extremely misleading and scientifically inaccurate.
The graph above shows NOAA’s tally of “billion dollar disasters” which NOAA defines as “the 1980-2005 events which resulted in at least $1 billion in overall damages/costs at the time of the event” (emphasis added, source here in PDF). The bolded part of that sentence is where NOAA’s methodology has a serious flaw, as $1 billion does not mean the same thing today as it did in 1980. In fact, adjusting just for inflation means that $1 billion today would have been the equivalent of $400 million in 1980. And that is not all, because there has been considerable development across the nation since 1980, meaning that there is more property and wealth to be damaged, $1 billion in damage today is actually equivalent to about $170 million in 1980.
Events which would have caused $1 billion in damage today, but did not when they occurred are not included in the NOAA listing. So by focusing on a $1 billion threshold, as $1 billion comes to represent less and less over time, NOAA has built in a strong bias in their analysis which creates the illusion of trend. If the point of the analysis is to say something about trends in weather, it will always be better to look at weather data, not damage data.
He concludes:
Regardless, of whether the total is 4 or 9 missed events or somewhere in the middle, NOAA’s data misses at least 80% of the billion dollar disasters in 1980. Not good. No doubt that a reanalysis of the years 1981 to present would turn up many more such events that failed to meet the contemporary billion-dollar threshold but would certainly do so today.
It is extremely misleading to use economic impacts as the basis for making claims about weather and climate. NOAA should take immediate steps to improve the scientific quality of its tabulation of “billion dollar disasters” lest it find itself accused of misleading the public and decision makers with scientifically unsound information
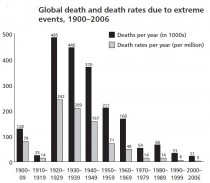
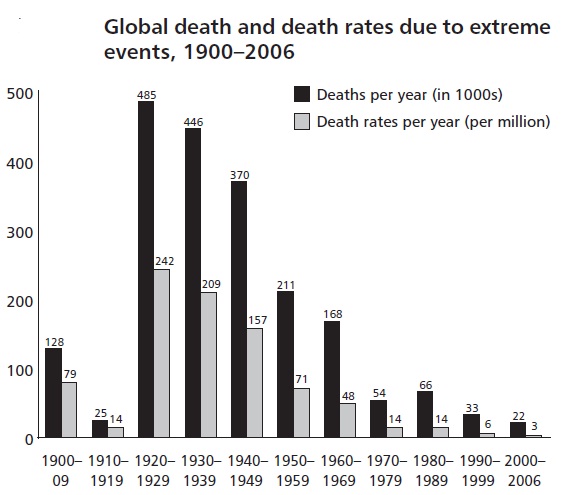
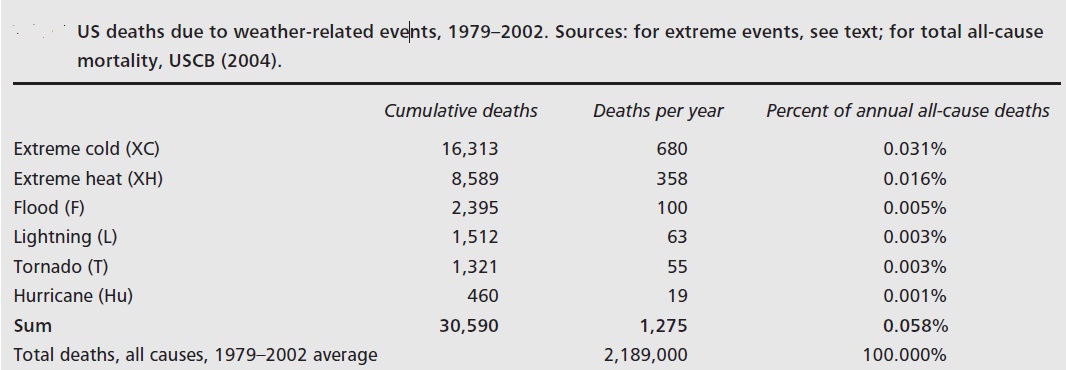
Also Indur Glokany in a study in 2007 showed death rates from extremes of weather were declining and COLD was the bisggest killer.
-----------
The chart on the right is correct but has precious little to do with CO2. Floods and droughts are characteristic of La Ninas especially those in the cold PDO. Last year’s La Nina was the second strongest in the records going back to 1900 and the PDO was deep in its cold mode. We predicted the floods, droughts and tornadoes months in advance.
Among the disasters were the tornadoes. Masters has shown the graph showing 2012 as the peak tornado year, proof in the pudding that we are responsible by driiving our SUVs and burning fossil fuels instead of using bird cuisinards.
Well NOAA’s Storm preciction Center has completed their analysis of 2012 tornado season and Paul Homewood wrote this excellent summary.
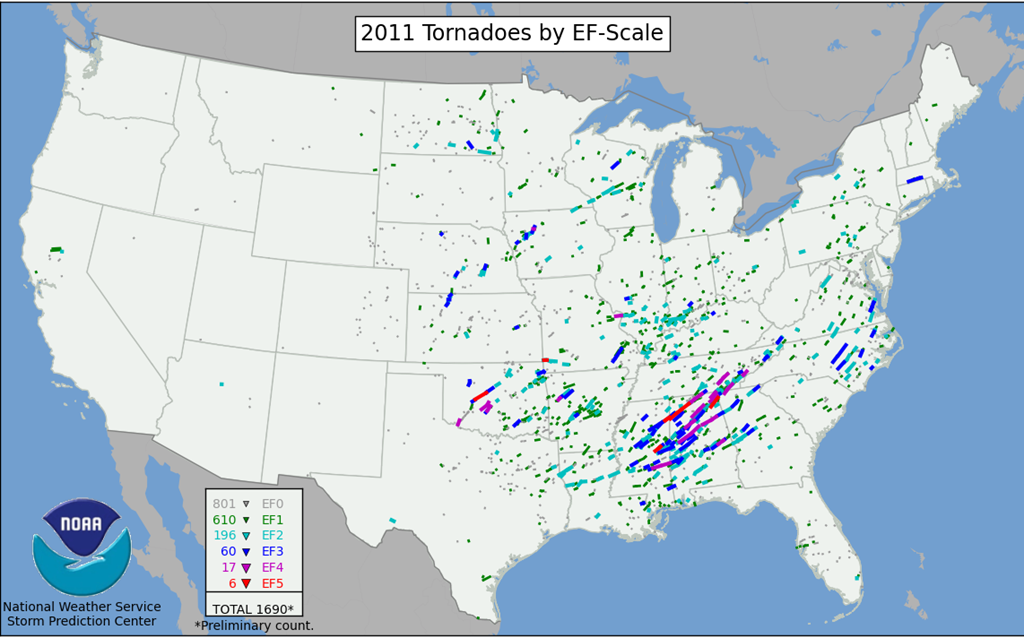
NOAA have just about finalised their numbers for the 2011 tornado season, although December figures still await confirmation. (It usually takes about three months to confirm the provisional reports as each tornado report has to be physically assessed by NWS personnel, in order to determine the category and, in many cases, even decide whether a tornado has actually occurred). So let’s take a look at the figures, as they stand currently.
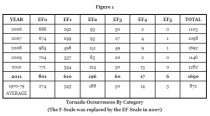
Enlarged
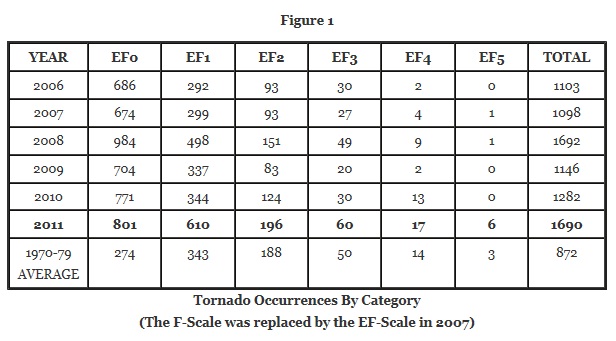
Tornado Occurrences By Category
(The F-Scale was replaced by the EF-Scale in 2007)
Historical Trends
When observing long term trends, it is important to remember that considerable changes have been made to the way that tornadoes are reported. NOAA have this to say :-
Improved tornado observation practices have led to an increase in the number of reported weaker tornadoes, and in recent years the number of EF0 and EF1 tornadoes have become more prevalent in the total number of reported tornadoes.
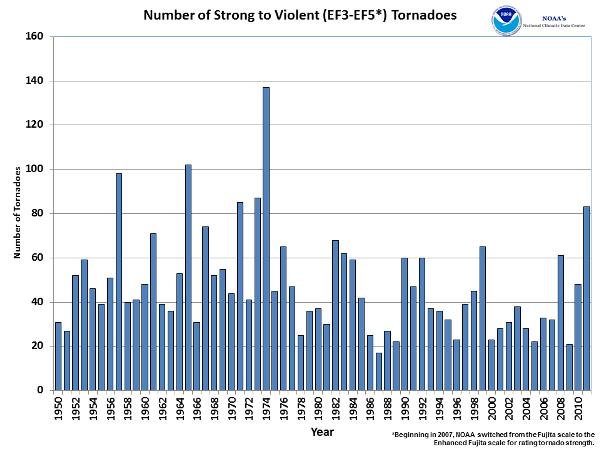
With increased national Doppler radar coverage [introduced between 1992 and 1997], increasing population, and greater attention to tornado reporting, there has been an increase in the number of tornado reports over the past several decades. This can create a misleading appearance of an increasing trend in tornado frequency. To better understand the true variability and trend in tornado frequency in the U.S., the total number of strong to violent tornadoes (EF3 to EF5 category on the Enhanced Fujita scale) can be analyzed. These are the tornadoes that would have likely been reported even during the decades before Doppler radar use became widespread and practices resulted in increasing tornado reports. The bar chart below indicates there has been little trend in the frequency of the strongest tornadoes over the past 55 years.
Enlarged
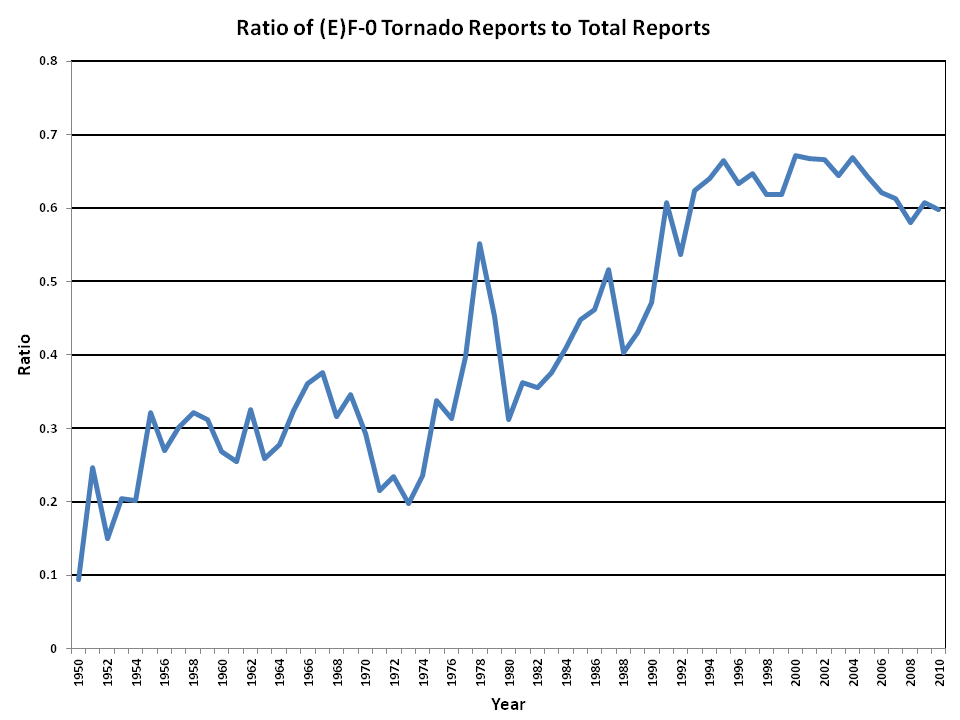
The effect of changes in observation can be clearly seen when looking at the ratio of the weakest F0 tornadoes to total numbers back to 1950, which rises from 10% to 60%.
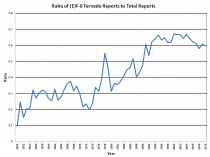
Enlarged
Further background to this issue can be seen here.
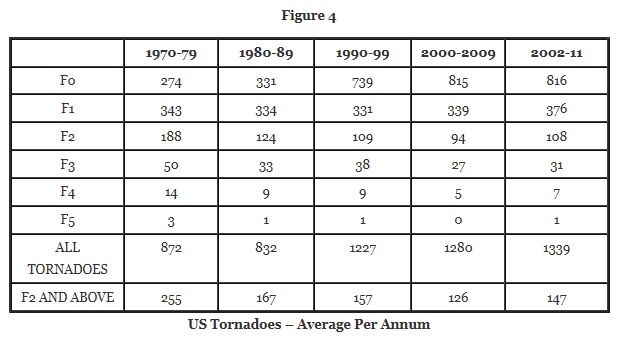
Analysis By Category
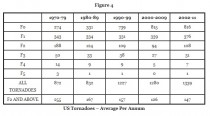
Figure 4 Enlarged
US Tornadoes - Average Per Annum
When the weaker tornadoes are excluded, it is clear that there is very little trend since the 1980s. It is also very apparent that tornado occurrences were much higher in all categories of F2 and above during the 1970s, than in the decades since.
Even in 2011, the total of F2+ tornadoes, which amounted to 279, was only slightly above the average of 255 for the whole 1970-79 period.
Are Tornadoes Becoming More Extreme?
In overall terms, Figure 2 indicates that for F3+ categories, 2011 ranked only 6th worst since 1950. But is there any trend towards the most severe categories?
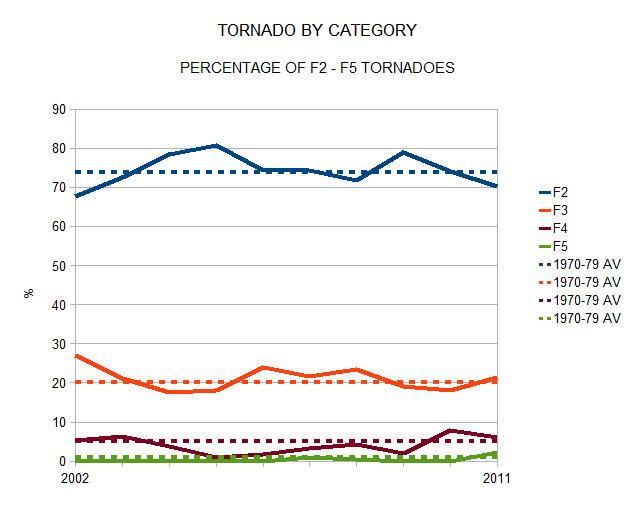
Figure 5
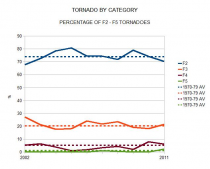
Figure 5 shows the number of F2+ tornadoes by category for each year since 2002 expressed as a percentage of the total of F2 to F5 occurrences. The dotted lines are the averages for the 1970s. Although 2011 experienced a sharp increase in F3, F4 and F5’s, the pattern over the 10 years as a whole does not seem to indicate any real trend, simply going up and down around the historical averages.
Conclusions
Whilst nobody can predict what 2012 will bring, there fortunately seems to be no evidence to suggest that there is any trend towards an increase in numbers or severity of tornadoes in the US.
Notes
1) The F-scale (Fujita) was uprated to the EF-scale (Enhanced Fujita) in 2007. The intent at the time was that the new scale should be consistent with the old one, and that, therefore, previous years would not be “revalued”. (More on the change here.) Please excuse me then, when I use both terminologies at different times!
2) All tornado statistics have been sourced from the Storm Prediction Centre.
See also Mark Johnson’s coverage of the CNN ridiculous tornado climate change relationship claim by former brainwashed by TWC weathercaster. CNN had a much more knowledgeable staff before ratings dropped and they had to go bottom fishing.
And as for republicans vs democrats, I know as many democrat scientists who are skeptic as republicans. And many liberals have abandoned the AGW movement when they looked into the data. It is a goal of the media and the democrats to portray the issue as left “settled science” versus right “denialist science”. It is really right versus wrong, good science versus bad politically driven science. And the democrats have helped fund the scientists and create this bad science and left leaning media has promoted the bad science and ignored all evidence to the contrary. Unfortunately our friend Paul has never really looked at other factors and has been hugely succesful in entreprenual businesses mainly built around the use of mesoscale high resolution computer models and computer driven visualizations. Whether he admits it or not (and he claims he has been burned by computer models as have all broadcasters) there is a certain trust factor built in. Joe Bastardi and I could show him how the natural factors are the real drivers using real data not models. JB tried to submit this comment to the blogs. It was a letter to Paul with links.
In his Farewell address to the nation Dwight Eisenhower in the speech remembered for comments on the military industrial complex also had a lot to say about poitically driven science:
Partly because of the huge costs involved, a government contract becomes virtually a substitute for intellectual curiosity. For every old blackboard there are now hundreds of new electronic computers. The prospect of domination of the nation’s scholars by federal employment, project allocations, and the power of money is ever present - and is gravely to be regarded. Yet in holding scientific research and discovery in respect, as we should, we must also be alert to the equal and opposite danger that public policy could itself become the captive of a scientific-technological elite.
Opinion: UN-Backed Scientists Call For Mega-City Population Lockup
Jurriaan Maessen on SPPI
In a recent statement put out by “Planet Under Pressure” several scientists call for denser cities in order to mitigate worldwide population growth. When in doubt that “UN’s Agenda 21” is not the Mein Kampf of our day, one should consider yet another in-your-face confession from yet another certified biocratic control freak
According to an MSNBC article one of the scientists while speaking about human populations worldwide, stated:
“We certainly don’t want them strolling about the entire countryside. We want them to save land for nature by living closely [together].”
Insisting the world’s population be locked up within the confounds of mega-cities, the elite realizes that if the herd is to be properly controlled walls are needed- thick walls, and by constructing these walls, making the masses go this or that way will be made easier..
Chief scientist Michail Fragkias involved with “Planet under Pressure” told MSNBC that “the answer (to population growth) is denser cities.”
The conference, co-sponsored by NASA and UNEP by the way, released its statement calling for denser cities to mitigate “worldwide population growth” ahead of the Rio+20 United Nations Conference on Sustainable Development taking place in June of this year.
“If cities can develop in height rather than in width that would be much more preferable and environmentally not as harmful”, Fragkias said.
People who know anything about history know that the creation of mega-cities in which the masses may be rounded up and enclosed, is identical to the Nazi principle of the “ghetto” as a means of managing the masses. Every student of history may also know what happens to those masses shortly after.
Some of the organizers of “Planet under Pressure” are founding their plea on the notion that we (as humanity) have entered the “Anthropocene”: a new geological era in which humans- not natural conditions- are the main drivers of geological and meteorological processes. Citing a website devoted to this concept, Martin Rees of the Royal Society stated at the conference:
“This century is special in the Earth’s history. It is the first when one species - ours - has the planet’s future in its hands,” reports the AFP news agency. “We’ve invented a new geological era: the Anthropocene.”, he stated.
This echoes yet another scientist, a professor at the University of Colorado, who in recent times also mentioned this new era in relation to a call for population control when he stated:
“Scientists now speak of humanity’s increased demands and impacts on the globe as ushering in a new geological epoch: the Anthropocene. Such selfish and destructive appropriation of the resources of the Earth can only be described as interspecies genocide.”
In addition the professor said: “Ending human population growth is almost certainly a necessary (but not sufficient) condition for preventing catastrophic global climate change. Indeed, significantly reducing current human numbers (emphasis added) may be necessary in order to do so.”
The call for compact cities, filled to the brim with humans, is part of the UN’s depopulation agenda for sure. Within these proposed mega-cities humans will be allowed to use RFID technology so they can be kept in check. The rest of the world, the “countryside” as one of the scientists told MSNBC, is reserved for the elite.
In this piece ”Prince Charles labeled Eco-Hypocrite as he arrives in the US to lecture on sustainability” written by Ann McElhinney & Phelim McAleer, the hypocrisy of the elitists is exposed, in this case bonnie Prince Charles, who this week comes to Georgetown to lecture us on sustainability, and how we must live with less in order to save the planet. He tells us we must end our “age of convenience”. He wants to make our lives more inconvenient to save the planet from alleged climate change but the Prince refuses to make any changes in his own life.
This process of downsizing and population control has already begun without any media attention:
By William Walter Kay
Intro
The author of Conservation Refugees, Mark Dowie, is the former publisher and editor of Mother Jones magazine. Six books and 200 articles have won him 18 awards. Researching this peer-reviewed M.I.T. Press-published text involved years of globe-trotting and the interviewing of many conservation and indigenous leaders. Dowie was privy to several leaked documents from major conservation organizations. Unusually, this book has no Acknowledgements section and does not mention Dowies patrons.
Highlights:
Between 1900 and 1950 about 600 wilderness parks were created worldwide. 400 were added in the 1950s. Today there are 110,000 such parks. 12% of Earths land is now conservationist controlled. This is an area larger than Africa. This is an area equal to half of humanitys farmland.
There is nothing civil about Third World environmental activism. Truckloads of armed men arrive at frontier villages. They torch shacks, wreck wells, rustle livestock, and confiscate firearms. This has happened thousands of times.
The global tally of conservation refugees is somewhere between 5 and 20 million. Dowie estimates 10million. One scholar estimates 14 million conservation refugees in Africa alone. The topic of conservation refugees has been assiduously neglected by academia. Conservation refugees are invisible because visibility raises the price of conservation.
After 1970, in a top-down process, elite enviro-organizations recruited and indoctrinated an auxiliary from the worlds most atavistic indigenous peoples. This puppet sub-movement is now fronting much environmentalist obstruction.
Conservationists are divided between those who advocate complete depopulation of hinterlands and those who want indigenous-environmentalist auxiliaries to govern these areas.
Man has no more control over the future of the planet than our own survival than the dinosaurs and other prehistoric reptiles were the dominant animals for about 185 million years during the Mesozoic era during the far warmer cretaceous, triassic and jurassic periods when lush plants grew but were eliminated along with many other species and flora by a cloud of dust from a meteor that hit the Yucatan. The herbivorous dinosaurs that fed on the plants died, as did the carnivorous dinosaurs that fed on the herbivorous dinosaurs. A supervolcano from say Yellowstone like the Caldera supereruption (2.1 million years ago) produced 2,500 times as much ash as the 1980 Mount St. Helens eruption would decimate the population in short order.
The population control freaks (including some in the current administration like science advisor Holdren) and their supporters at the UN are the ones that should be put in walled compounds and the rest of humanity should be free to enjoy the fruits of our labor and of this god given wonderful planet.
In their own words...just a sample
If you ask why these people would harm you and your family, the answer lies in these anti-American comments:
"All of these dangers are caused by human intervention… the real enemy then, is humanity” Alexander King, pioneer of the sustainable development movement who co-founded the Club of Rome in 1968
”...current lifestyles and consumption patterns of the affluent middle class--involving high meat intake, use of fossil fuels, appliances, home and work air conditioning, and suburban housing --are not sustainable” Maurice Strong, Secretary General, UN Conference on Environment & Development, 1992 (Rio Earth Summit)
Here is a wonderful video of the marvels of the human species.
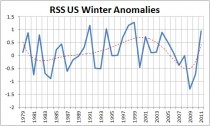
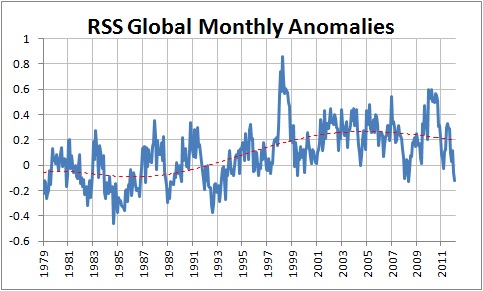
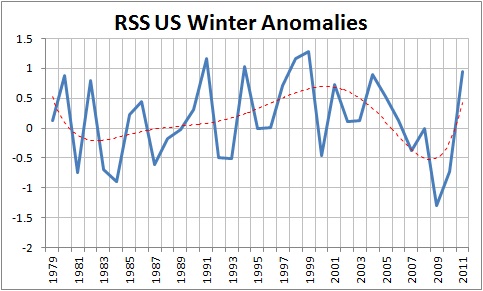
By Joseph D’Aleo, CCM, Weatherbell.com
Given the warm winter in the lower 48, it may surprise you that 2011/12 was the 11th coldest globally just behind 2008 among the 34 winters in the satellite era.
1 1985 -0.299
2 1989 -0.217
3 1984 -0.207
4 1993 -0.194
5 1979 -0.173
6 1986 -0.141
7 1992 -0.107
8 1990 -0.072
9 1982 -0.052
10 2008 -0.033
11 2012 -0.022
12 1997 -0.008
Monthly time series since 1979.

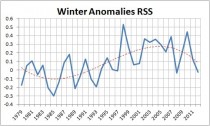
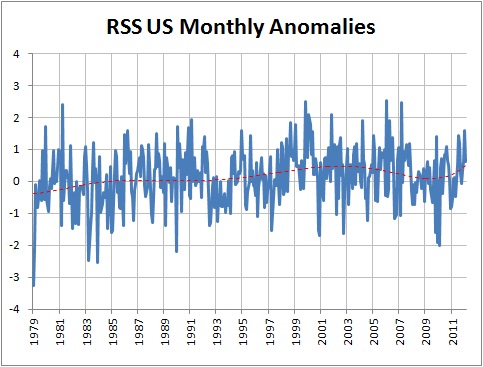
For the US, the RSS monthlies looked like this, surprisingly unremarkable.

The winter numbers are another story
Winter 2009/10 was coldest, 2010/11 the third coldest, 2011/12 the 5th warmest.
By Cliff Ollier
THE Weekend Australian reported on March 24 that Port Macquarie Hastings Council was recommending the enforcement of a “planned retreat” because of an alleged danger from sea-level rise in the (distant) future.
The controversy has two main aspects: is the alarming rise in sea level projected by CSIRO reliable? And is moving people from near-shore sites the correct response?
The CSIRO projection is extreme, but before explaining why, I would note that the world’s main source of alarmism is the Intergovernmental Panel on Climate Change. This is not really a scientific body but one that adjusts data and subjects it to mathematical modelling before passing its “projections” on to politicians.
The CSIRO and Bureau of Meteorology, then further adjust data and produce models with even more extreme scenarios.
In The Weekend Australian on November 7, 2009, the director of the National Tidal Centre of the BOM, Bill Mitchell, reported an Australian average sea-level rise of 1.7mm a year. This is a reasonable level accepted by most sea-level watchers outside the IPCC and CSIRO and gives a sea-level rise of about 15cm by 2100. He said the “upper end was 3mm a year”, which gives a 27cm rise by 2100.
At 8.30am on November 18, 2009, ABC Radio National had a program on sea-level changes. National Sea Change Taskforce executive director Alan Stokes said: “The IPCC estimate of rise to 2100 was up to 80cm.” No new data was provided to explain the leap and, in fact, the worst estimate by IPCC in its last report was 59cm.
Note that the IPCC estimates have been falling with each report. In its second assessment report the high-end projection of sea-level rise to 2100 was 92cm, in the third assessment report 88cm, and the fourth 59cm. It is good for the reader to look at sea-level measurements. You can see the sea-level data for the US and a few other countries. Most stations show a rise of sea level of about 2mm a year, but note the considerable variations even within a single state, though these are no cause for alarm.
The CSIRO uses figures far in excess of even the IPCC, which until now were the greatest alarmists. In its 2012 report, State of the Climate, the CSIRO says that since 1993 sea levels have risen up to 10mm a year in the north and west. That means that somewhere has had a 19cm-rise in sea level since 1993. Where is this place? The European satellite says that sea levels have been constant for the past eight years.
How does the CSIRO arrive at its figures? Not from new data but by modelling. Models depend on what is put into them. For example a 2009 report, The Effect of Climate Change on Extreme Sea Levels in Port Phillip Bay, by the CSIRO for the Victorian government’s Future Coasts Program, based its model on temperature projections to 2100 of up to 6.4C. That compares with the most extreme, fuel-intensive scenario of the IPCC and implies unbelievable CO2 concentration levels in 2100 of about 1550 parts per million.
Using all known fossil fuel reserves would achieve only half this and continuing the current rate of increase in concentration levels would result in only 550ppm by 2100. The result is a CSIRO prediction of sea-level rise for Port Phillip Bay by 2100 of 82cm and, with the help of the BOM, a further increase due to wind to 98m. That is well above even the top level projected by the latest IPCC report. This example is from Victoria but sea levels must have roughly the same rises and falls all over the world. So the whole world should be alarmed. Indeed, the IPCC and CSIRO try to alarm the world with stories of the drowning of low islands, such as Tuvalu. But detailed mapping has shown that Tuvalu, and many other coral islands, have actually grown during the past 20 years.
The Netherlands is particularly vulnerable to any large rise of sea levels. It is also a leader in coastal science and engineering, and the Dutch are not alarmed. In the December 11, 2008, issue of NRC/Handelsblad (Rotterdam’s counterpart to The Australian) Wilco Hazeleger, a senior scientist in the global climate research group at the Royal Netherlands Meteorological Institute, wrote: “In the past century the sea level has risen 20cm. There is no evidence for accelerated sea-level rise. It is my opinion that there is no need for drastic measures. Fortunately, the time rate of climate change is slow compared to the lifespan of the defence structures along our coast. There is enough time for adaptation.”
This brings us to the second part of the debate. We should adapt to changes in the shoreline, as do the Dutch. We should reject draconian rules to save folk from a remote and dubious peril. If Tim Flannery is allowed to take his chance living on his Hawkesbury property near sea level, Port Macquarie’s retirees should be permitted to do so too. They should not be evicted to “save” them from a dire fate they will never see.
Cliff Ollier is a geologist, geomorphologist, emeritus professor at the University of Western Australia.
Posted on March 27, 2012 by Anthony Watts
This just in from The Daily Climate, Kerry tells us we are winning, but the blames the usual suspects rather than the message itself. I love the part about where we “made up our own science”, which is sort of like when Kerry swiftboated the weather back in 2008, except there was really no support for his position in science. Of course that lack of basic understanding couldn’t be the reason “people just turn off” when he’s talking about climate, could it?
Kerry: ‘We have lost the notion of responsible capitalism’
Venting frustration at the lack of progress on environmental issues, U.S. Sen. John Kerry voices the exasperation of a core constituency in President Obama’s re-election bid.
By Doug Struck For the Daily Climate
BOSTON - Massachusetts Democrat Sen. John Kerry, exasperated at what he called “the flat-earth caucus,” on Sunday described the frustrations of working on environmental issues in the U.S. Senate.
Even amid the “Tuesday Group” - a bi-partisan bloc of lawmakers, mostly Democrats, who are interested in energy issues - “you can’t talk about climate now,” Kerry said. “People just turn off. It’s extraordinary. Only for national security and jobs will they open their minds.”
Kerry, in a dinner speech at Tufts University Fletcher School of Law and Diplomacy, voiced the exasperation of an environmental movement that had high hopes with the election of President Obama in 2008 but has been disappointed by the administration and largely shut out after the Republican takeover of the House in 2010.
“The irony is that we used to be a nation that valued science. We have become a nation that is now discarding science,” Kerry said. He spoke at a conference on the challenges facing the Arctic, attended by Iceland’s president, Olafur Grimsson.
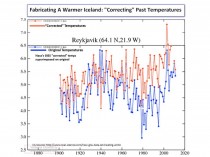
Iceland temperatures manipulated by government funded NASA/NOAA craftsman.
Opponents to the legislation “made up their own science. They made up their own arguments,” Kerry said. “The Republicans created this idea of (carbon credit) trading because it avoided command and control by the federal government.” Then, “they just decided to pick up and brand this a negative.”
Kerry blamed brothers David and Charles Koch, oil billionaires who have bankrolled attempts to discredit climate change, as well as opposition from energy companies. “You have Peabody Coal. You have MidAmerican. They have these big old cash cows, these old coal-powered plants. It’s just cash coming in, and they want to keep it that way.
Icecap note: And in a few years when the Atlantic follows the Pacific into the cooling mode and the Eddy Grand minimum begins and temperatures globally plummet, you Mr Kerry with your partner in crime, the equally clueless Henry Waxman who have helped the government fund the biggest scam in science in history will be turned on by angry Americans. The public senses the scam and see it is perpetuated by those who have a big D after their name. Sadly I am an independent who used to vote for Ds. No longer if they continue their anti science, anti energy, class warfare, big government ultra progressive campaigns.
------------------
John Coleman opines on the political nature of Global warming
It seems to be 90% politics to most people. Peoples attitudes about the threat to our way of live and our standard of living poised by Global Warming seems to be dictated by their political party affiliations, or least their political leanings, and attitude about the Environmental Green Energy issues than about the scientific issues or debate. Liberals are generally closed to scientific discussion saying it’s settled science, that 97% of scientists accept the science as settled (both of which are not facts at all) and conservatives support the Global Warming skeptics without doing much or any study of scientific arguments first. It drives me nuts.
I support the efforts to come up with alternate (green) energy sources (but I know that there is no viable such green energy alternative to fossil fuels now available and none that seems to be any where near to reality. I also know that in time we must come up with a replacement for fossil fuels and the internal combustion automobile and jet aircraft engines. But, that someday is definitely not now.
Thanks to science and engineering our processed fuels (Californias reformulated fuels lead the way) and injection engines with catalytic converters and smoke stack scrubbers and cleaned fossil fuels for power plants, our used of fossil fuel is no longer a significant air pollution issue. That is unless you subscribe to the outrageous anti-science position of the Environmental Protection Agency and classify carbon dioxide as a pollutant and the primary source of man-made global warming. That is a totally environmentalist driven, political distortion of science. It drives me nuts and must be addressed.
One of my heros, William Happer, Ph.D. in Physics, at Princeton has just contributed an item on this topic. Regardless of your political or environmental position, I hope you will read it. It is from the Wall Street Journal (see post under Political Climate).
Climate Obstinately Refuses to Cooperate with Global Warming Alarmists
By Larry Bell, For Whom the Bell Tolls on Forbes
Are you worried about global warming during this unusually mild winter? Geeze, who would have expected to see 75 F March temperatures in Chicago? Or those earlier than usual cherry blossoms in Washington, D.C. which hasn’t happened since 1946 (albeit, when atmospheric CO2 concentrations were 310 ppm vs. 385 ppm now)? Even regions of the Southern Hemisphere had a year with practically no winter temperatures.
So was Al Gore right after all? Perhaps you heard...he’s been off to Antarctica watching the ice melt along with NASA’s famous climate alarmist James Hansen, featured ClimateGate figure Kevin Trenberth, billionaire Richard Branson and about 100 other panicky pals. Their timing is perfect, offering a lot for them to observe. The Antarctic Peninsula sea ice expanse is nearly 200% greater now than usual.
For those of you here who would have preferred more typical sub-zero temperatures and rampaging tag team blizzards, I’ve also got some great news. While these conditions bypassed the continental U.S. this year for other locations, don’t discard those flannel long johns just yet. There’s every indication that you are going to need them over the next many years.
First, for a bit of background perspective, let’s realize that climate change is very real, and has been going on for a very long time...dating back to always. It actually began to occur even before the advent of flatulent dinosaurs, industrial smoke stacks and SUVs. And although temperatures have been generally mild over about the past 150 years (since the end of the last “Little Ice Age”...not a true Ice Age), we should remember that significant fluctuations are normal. In fact the past century has witnessed two distinct periods of warming.
The first warming period occurred between 1900 and 1945. Since CO2 levels were relatively low then compared with now, and didn’t change much, they couldnt have been the cause before 1950. The second, following a slight cool-down, began in 1975 and rose at quite a constant rate until 1998, a strong Pacific Ocean El Nino year. Yet U.K. Hadley Center and U.S. NOAA balloon instrument analyses fail to show any evidence, whatsoever, of a human CO2 emission-influenced warming telltale “signature” in the upper troposphere over the equator as predicted by all U.N. Intergovernmental Panel on Climate Change (IPCC) global circulation models.
Temperatures have been essentially flat since 1998, with the exception of another brief 2010 El Nino spike immediately followed by a dramatic 2011 La Nina decline. About half of all estimated warming since 1900 occurred before the mid-1940s despite continuously rising CO2 levels since that time.
Our warm 2011/2012 U.S. winter would have been a very welcome difference from what much of world experienced. A European cold spell killed more than 500. More than 140 perished in the Ukraine, along with hundreds of others in France, Serbia and the Czech Republic. Europes 2,860-kilometer Danube that is crucial for transport, power, industry and fishing froze over, as did nearly all rivers in the Balkans. More than 130 villages in Bulgaria went without electricity.
Closer to those of us in the lower forty-eight, Fairbanks, Alaska reported the coldest January temperatures since 1971, with temperatures reaching -24 F. The coldest January average temperature there occurred in 1906 (-36.4 F).
Recent readings taken from more than 30,000 measuring stations that were quietly released by the U.K.s Met Office and the University of East Anglia University Climate Research Unit show that world temperatures havent warmed over the past 15 years. Nor are they likely to for quite awhile. Many scientific studies indicate that the global climate will soon enter a substantial cooling phase attributable to a weak new solar cycle. This is predicted due to important modulating cloud-forming influences of cosmic rays throughout periods of reduced sunspot activity. More clouds tend to make conditions cooler, while fewer often cause warming.
Solar output typically goes through 11-year cycles, with high numbers of sunspots seen at their peak. We are currently approaching the peak of “Cycle-24”, yet sunspot numbers are running at less than half of those observed during other 20th century peaks. A paper released by the Met Office projected a 92% chance that both Cycle-25, and those taking place in following decades, will be as weak, or weaker than, a “Dalton minimum” of 1790 to 1830, when average European temperatures fell by 2 Celsius.
Nicola Scafetta, a climate scientist at Duke University and the Active Cavity Radiometer Solar Irradiance Monitor Lab (ACRIM), told me that doesn’t think that we will see a severe “Maunder minimum”, or even Dalton minimum-like conditions because the Sun is presently at the maximum of its 1,000-year cycle, a condition similar to that which produced the two century-long Medieval Warm Period. However, the Sun is now entering into a grand minimum most likely described by a strong 60-year cycle, with maxima occurring around 2000 and 2060. Scafetta predicts that there will be steady but moderate cooling over the next 20 to 30 years (more or less). His new paper which discusses this… published last week in the Journal of Atmospheric and Solar Terrestrial Physics… is based upon a solar data reconstruction since 10,000 BC.
The Met Office claims that the greenhouse effects of man-made carbon dioxide are far stronger than the Suns influences, sufficiently so not only to overwhelm potential solar cooling, but to produce net warming. These findings are fiercely disputed by solar experts. They point out that the Met’s assessment is based upon highly theoretical climate models that exaggerate CO2 influence, while failing to account for numerous other important contributing factors. For example, as CO2 levels have continued to rise, the Met Office claimed in 2007 that global warming was about to “come roaring back”, predicting an overall 0.3º C temperature increase between 2004 and 2014. Then, in 2009, it predicted that at least three of the years between 2009 and 2014 would break the previous 1998 temperature record. That doesnt appear very likely.
Since they couldn’t directly emulate the global surface temperature, the Met’s 2009 prediction is based instead upon a simple “energy balance model” (EBM) they used to emulate a fully coupled atmospheric ocean general circulation model (GCM). However, the GCM they applied to calibrate their EBM (the “HadCM3"), didn’t contain any solar climate amplification factors (such as cosmic ray/cloud feedback influences)
hence, showed very limited climate sensitivity to solar variations. This is a novel and very creative example of “garbage in-garbage out” modeling wizardry, where a climate model, used to model another climate model, is claimed to have realistic predictive validity.
Judith Curry, a well-known climatologist who chairs the School of Earth and Atmospheric Sciences at the Georgia Institute of Technology, finds the Met’s confident prediction of a “negligible” solar impact “difficult to understand”. She has stated that “The responsible thing to do would be to accept the fact that the models may have severe shortcomings when it comes to the influence of the Sun”. As for a predicted warming pause, she said that many scientists “are not surprised.”
Curry also notes important contributions of 60-year Pacific and Atlantic Ocean temperature cycles, observing that they have been “insufficiently appreciated in terms of global climate”. When both oceans were cold in the past, such as from 1940 to 1970, the climate cooled. The Pacific “flipped” back from a warm to a cold mode in 2008, and the Atlantic is also thought likely to flip back in the next few years.
Habibullo Abdussamatov, a scientist at the Pulkovo Observatory at the Russian Academy of Science in St. Petersburg, predicts that our planet is now entering a very cold and protracted climate phase. He believes that “after the maximum of solar Cycle-24, from approximately 2014, we can expect the start of the next bicentennial cycle of deep cooling with a Little Ice Age in 2055 plus or minus 11 years” (the 19th to occur in the past 7,500 years).
Another Little Ice Age? If you have been worried about man-made global warming, just think about that! While improbable, let’s really hope the Met Office is actually right for a change, and that good ol plant-nourishing CO2 will rescue us from such a truly chilling prospect.
Reprinted with permission of author
By Dr Roy Spencer
March 22nd, 2012
While the IPCC claims that recent Arctic sea ice declines are the result of human-caused warming, there is also convincing observational evidence that natural cycles in atmospheric circulation patterns might also be involved.
And unless we know how much of the decline is natural, I maintain we cannot know how much is human-caused.
In 2002, a paper was published in the Journal of Climate entitled Response of Sea Ice to the Arctic Oscillation, where the authors (one of whom, Mike Wallace, was a co-discoverer of the AO) shows that changing wind patterns associated with the AO contributed to Arctic sea ice declines from one decade to the next: from 1979-1988 to 1989-1998.
The Arctic Oscillation involves sea level pressure patterns over the Arctic Ocean, North Atlantic, and North Pacific. Since sea ice moves around with the wind (see this movie example), sea level pressure patterns can either expose or cover various sections of the Arctic Ocean.
When there are many winters in a row with high (or low) pressure, it can affect sea ice cover on decadal time scales. Over time, ice can become more extensive and thicker, or less extensive and thinner.
There is a time lag involved in all of this, as discussed in the above paper. So, to examine the potential cumulative effect of the AO, I made the following plot of cumulative values of the winter (December-January-February) AO (actually, their departures from the long-term average) since 1900. I’ve attached a spreadsheet with the data for those interested, updated through this past winter.
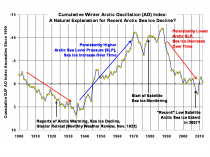
Enlarged
Consistent with the analysis in the above-cited paper, the sea ice decline since satellite monitoring began in 1979 was during a period of persistent positive values of the AO index (note the reversed vertical scale). Since the satellite period started toward the end of a prolonged period of negative AO values, this raises the question of whether we just happened to start monitoring Arctic sea ice when it was near peak coverage.
Note that back in the 1920’s, when there were reports of declining sea ice, record warmth, and disappearing glaciers, there was similar AO behavior to the last couple of decades. Obviously, that was before humans could have influenced the climate system in any substantial way.
I won’t go into what might be causing the cyclic pattern in the AO over several decades. My only point is that there is published evidence to support the view that some (or even most?) of the ~20 year sea ice decline up until the 2007 minimum was part of a natural cycle, related to multi-decadal changes in average wind patterns.
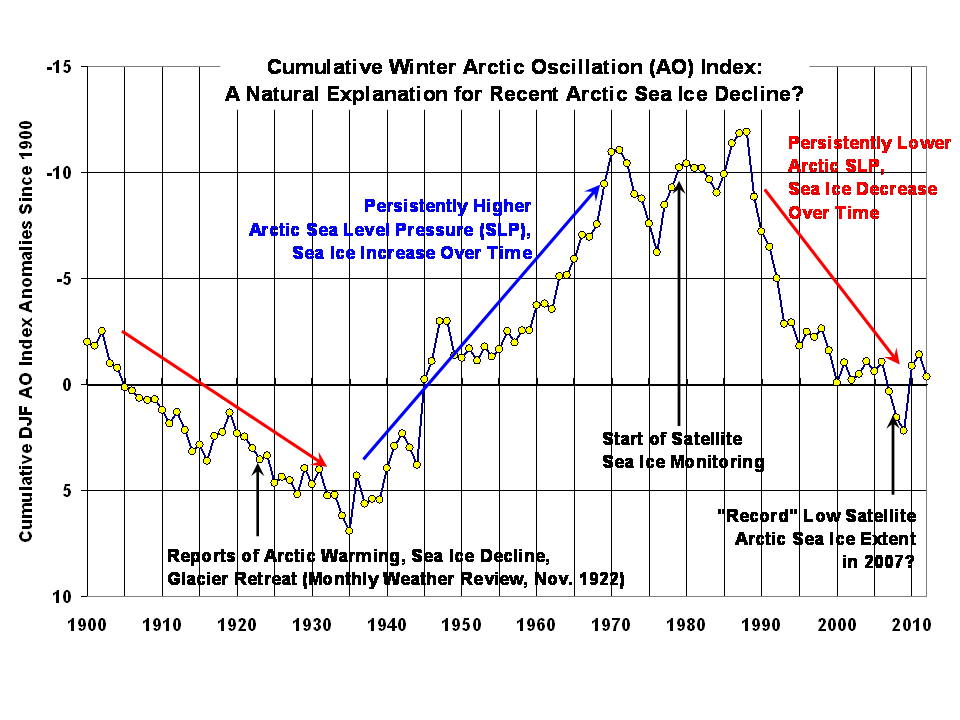
A federal judge in Mississippi has ended a long-running suit that attempted to hold a selection of U.S. utilities and coal and oil companies responsible for flooding damage caused by Hurricane Katrina.
U.S. District Judge Louis Guirola Jr., in a decision released yesterday, dismissed Comer vs. Murphy Oil with prejudice, meaning it can’t be refiled or reconstituted. The decision should serve to preclude, other similar lawsuits accusing companies of emitting global-warming gases that cause damaging weather patterns.
Guirola dismissed the case for legal reasons - he’d already dismissed it once before, and he said the plaintiffs were barred by various legal doctrines from reviving it - but “out of an abundance of caution” he reiterated why the case shouldn’t be allowed to proceed.
Those reasons are becoming familiar in global-warming cases: Guirola ruled the case invalid because the underlying issue of global warming is a political question, best left to the legislative branch and regulators to decide. And because existing tort law requires plaintiffs to prove a more solid connection between their injuries and the actions of those they are suing than a scientifically plausible argument that one contributed to the other.
Plaintiff lawyers have tried various ways to fit global warming into conventional tort law, where they can construct a case showing industry executives were aware of the threat of CO2 emissions and did nothing about it. That would allow them to make the argument that the industry exposed others to “unreasonable” risks. The evidence would be memos and other material showing they were aware of scientific links between CO2 and global warming, regardless of whether they believed them, much as the states pursued lawsuits against the tobacco industry by uncovering evidence executives were aware of research showing links to cancer and addiction.
Guirina wasn’t buying it, saying global warming was too complex an issue to ask a court to decide: “The plaintiffs are asking the Court, or more specifically a jury, to determine without the benefit of legislative or administrative regulation, whether the defendants’ emissions are “reasonable,’” he said.
The case followed an odd route after dismissal up to the Fifth Circuit, where a three-judge panel reinstated some of the claims, then an en banc panel agreed to rehear the appeal, only to dismiss the case when it couldn’t form a quorum of nine judges. The plaintiffs declined to appeal to the U.S. Supreme Court.
The decision helps close the door on global-warming litigation by private plaintiffs. The U.S. Supreme Court offered some hope to plaintiffs in 2007 when it held that Massachusetts could sue the E.P.A. for failing to enact rules to control CO2 emissions that threatened the states coastline. That seemed to affirm the basic idea that CO2 was a pollutant covered by the Clean Air Act. But the Supreme Court eased that door shut last year with Conn. v. AEP, where it said Connecticut must wait until or unless the EPA issues regulations before suing individual companies over emissions. The Ninth Circuit also dismissed a lawsuit by Inuit villagers against ExxonMobil and other companies, citing the political question doctrine.
The judge refused a request for sanctions against attorney F. Gerald Maples for refiling the case after it had been dismissed, saying he acted in “good faith” under a Mississippi law that might have, but didn’t, offer an extension of the statute of limitations.