


This is a story that won’t go away and the eventual outcome is that many alarmists and their media toadies will be in court and hopefully fined heavily or serve time in jail. In any event, here’s the obvious fact that the alarmists blogs heavily funded by liberal dollars and wrap the fish newspapers like The Guardian that its still exists only because it is propped up by a misguided charitable trust all forget, Government-funded research is subject to freedom of information laws; the internal deliberations of privately-funded research and advocacy groups are not. As we know from the climategate emails, Phil Jones and the gang at the Climate Research Unit (CRU) stonewalled FOIA requests for years to prevent independent researchers from checking their data and methodologies. That was a bona fide scandal.
Leaking the CRU emails - whistle blowing - was the only way to (a) produce documents responsive to valid FOIA requests, and (b) expose CRU’s willful evasion of FOIA.
There is no analogy between climategate and the theft of the Heartland documents because (1) Heartland has no legal obligation to share its internal deliberations with the public, and (2), unlike collusion to evade FOIA, strategizing about fund raising is not a crime!
Anthony Watts was heavily attacked in the looney left blogosphere for actually accepting funding for doing important work. Here was his defense of his funding as reported on Bishop Hill‘s blog.
Anthony Watts has sent details of the project that Heartland was involved in and his interactions with the Guardian on the subject. This I think is Heartland’s description of the project.
Weather Stations Project
Every few months, weathermen report that a temperature record - either high or low - has been broken somewhere in the U.S. This is not surprising, since weather is highly variable and reliable instrument records date back less than 100 years old. Regrettably, news of these broken records is often used by environmental extremists as evidence that human emissions are causing either global warming or the more ambiguous “climate change.”
Anthony Watts, a meteorologist who hosts WattsUpwithThat.com, one of the most popular and influential science blogs in the world, has documented that many of the temperature stations relied on by weathermen are compromised by heat radiating from nearby buildings, machines, or paved surfaces. It is not uncommon for these stations to over-state temperatures by 3 or 4 degrees or more, enough to set spurious records.
Because of Watts’ past work exposing flaws in the current network of temperature stations (work that The Heartland Institute supported and promoted), the National Aeronautics and Atmospheric Administration (NOAA), the government agency responsible for maintaining temperature stations in the U.S., has designated a new network of higher-quality temperature stations that meet its citing specifications. Unfortunately, NOAA doesn’t widely publicize data from this new network, and puts raw data in spreadsheets buried on one of its Web sites.
Anthony Watts proposes to create a new Web site devoted to accessing the new temperature data from NOAA’s web site and converting them into easy-to-understand graphs that can be easily found and understood by weathermen and the general interested public. Watts has deep expertise in Web site design generally and is well-known and highly regarded by weathermen and meteorologists everywhere. The new site will be promoted heavily at WattsUpwithThat.com. Heartland has agreed to help Anthony raise $88,000 for the project in 2011.
The Anonymous Donor has already pledged $44,000. We’ll seek to raise the balance.
And here’s Anthony’s response to questions from Suzanne Goldenberg at the Guardian:
Heartland simply helped me find a donor for funding a special project having to do with presenting some new NOAA surface data in a public friendly graphical form, something NOAA themselves is not doing, but should be. I approached them in the fall of 2011 asking for help, on this project not the other way around.
They do not regularly fund me nor my WUWT website, I take no salary from them of any kind.
It is simply for this special project requiring specialized servers, ingest systems, and plotting systems. They also don’t tell me what the project should look like, I came up with the idea and the design. The NOAA data will be displayed without any adjustments to allow easy side-by-side comparisons of stations, plus other graphical representations output 24/7/365. Doing this requires programming, system design, and bandwidth, which isn’t free and I could not do on my own. Compare the funding I asked for initially to get it started to the millions some other outfits (such as CRU) get in the UK for studies that then end up as a science paper behind a publishers paywall, making the public pay again. My project will be a free public service when finished.
And then this:
DeSmog, as part of their public relations for hire methodology to demonize skeptics, will of course try to find nefarious motives for this project. But there simply are none here. It’s something that needs doing because NOAA hasn’t made this new data available in a user friendly visual format.
For example, here’s a private company website that tracks highs and low records using NOAA data.
NOAA doesn’t make any kind of presentation like that either, which is why such things are often done by private ventures.
Golly, aren’t sceptics wicked? I wonder why the Guardian didn’t mention Anthony’s comments?
Logic-gate: The Smog blog exposes irrational rage. Innumeracy. And Heartlands efficient success>
By Joanne Nova
The believers of man-made-weather-disasters are wetting themselves with excitement. It painful to watch grown men drool.
Poor things, they were really wounded by Climategate, and they’ve been waiting, praying that some day someone would level the playing field and show that skeptics were just as petty, shameless, and money-grubbing as their team turned out to be (not to mention hypocritical, deceptive and incompetent). In their dreams.
Instead the hyped non-denier-gate shows just how incredibly successful the Heartland Institute is. Look at the numbers. The skeptics have managed to turn the propaganda around against a tide of money, and it is really some achievement.
USD
Greenpeace $300m 2010 Annual Report
WWF $700m
Pew Charitable Trust $360m 2010 Annual Report
Sierra Club $56m 2010 Annual Report
NSW climate change fund (just one random govt example) $750m
NSW Gov (A$700m)
Heartland Institute $6.4m
US government funding for climate science and technology $7,000m ($7B) “Climate Money”
US government funding for “climate related appropriations” $1,300m ($1.3B) USAID 2010
Annual turnover in global carbon markets $120,000m ($120B) 2010 Point Carbon
Annual investment in renewable energy $243,000m ($230B) 2010 BNEF
US government funding for skeptical scientists $ 0
These are annual turnovers or annual budgets
So what the expose shows is that the Heartland Institute punches far above its weight with an incredibly efficient budget. That is, of course, assuming that the so-called expose is real and not a fake, or altered, which it could be, watch the Heartland site for any confirmation or information.
This is a wake up call to the freedom loving people of the world, it’s time to make donations a regular part of your monthly budget to support all the people out there who work on your behalf (SEE DONATE BUTTON ON LEFT). The fact that Heartland has only one major, generous donor is remarkable. Where are the rest?
The hypocrisy is flagrant. The Sierra Club listed a category for $1,000,000 donations by “anonymous donors” in their 2010 annual report. Strangely DeSmog didn’t froth with anticipation. Their Sierra Club annual report mentions “Matching Gifts”, and apparently supporters who matched gifts include the evil Exxon, not to mention GoldMan Sachs, Barclays, Google, Monsanto, Nestle, Yahoo, Bank of America, and many many more. But that’s alright then.
And if Bob Carter receives an honorarium type amount of $1500 a month, the pull of those big dollars must be powerfully tempting for people like Tim Flannery who struggle along on about $1200 each day he works.
1_thumb.jpg)
Enlarged. Julia needs to go after Garnaut, Karoly, Trenberth and the other phonies that have created this phony global charade
As I always say when these matters are raised, YES Please. Let’s do talk about the funding.
Read Joanne Nova’s story here. Thank you to the Desmogblog radicals for calling attention to how one sided this really is.
See how someone appaerently stole papers from a Heartland board meeting. Some documents, including some faked documents were released.
HEARTLAND’s STATEMENT
Heartland Institute Responds to Stolen and Fake Documents
FEBRUARY 15, 2012 - The following statement from The Heartland Institute - a free-market think tank - may be used for attribution. For more information, contact Communications Director Jim Lakely at jlakely@heartland.org and 312/377-4000.
Yesterday afternoon, two advocacy groups posted online several documents they claimed were The Heartland Institute’s 2012 budget, fundraising, and strategy plans. Some of these documents were stolen from Heartland, at least one is a fake, and some may have been altered.
The stolen documents appear to have been written by Heartland’s president for a board meeting that took place on January 17. He was traveling at the time this story broke yesterday afternoon and still has not had the opportunity to read them all to see if they were altered. Therefore, the authenticity of those documents has not been confirmed.
Since then, the documents have been widely reposted on the Internet, again with no effort to confirm their authenticity.
One document, titled “Confidential Memo: 2012 Heartland Climate Strategy,” is a total fake apparently intended to defame and discredit The Heartland Institute. It was not written by anyone associated with The Heartland Institute. It does not express Heartland’s goals, plans, or tactics. It contains several obvious and gross misstatements of fact.
We respectfully ask all activists, bloggers, and other journalists to immediately remove all of these documents and any quotations taken from them, especially the fake “climate strategy” memo and any quotations from the same, from their blogs, Web sites, and publications, and to publish retractions.
The individuals who have commented so far on these documents did not wait for Heartland to confirm or deny the authenticity of the documents. We believe their actions constitute civil and possibly criminal offenses for which we plan to pursue charges and collect payment for damages, including damages to our reputation. We ask them in particular to immediately remove these documents and all statements about them from the blogs, Web sites, and publications, and to publish retractions.
How did this happen? The stolen documents were obtained by an unknown person who fraudulently assumed the identity of a Heartland board member and persuaded a staff member here to “re-send” board materials to a new email address. Identity theft and computer fraud are criminal offenses subject to imprisonment. We intend to find this person and see him or her put in prison for these crimes.
Apologies: The Heartland Institute apologizes to the donors whose identities were revealed by this theft. We promise anonymity to many of our donors, and we realize that the major reason these documents were stolen and faked was to make it more difficult for donors to support our work. We also apologize to Heartland staff, directors, and our allies in the fight to bring sound science to the global warming debate, who have had their privacy violated and their integrity impugned.
Lessons: Disagreement over the causes, consequences, and best policy responses to climate change runs deep. We understand that.
But honest disagreement should never be used to justify the criminal acts and fraud that occurred in the past 24 hours. As a matter of common decency and journalistic ethics, we ask everyone in the climate change debate to sit back and think about what just happened.
Those persons who posted these documents and wrote about them before we had a chance to comment on their authenticity should be ashamed of their deeds, and their bad behavior should be taken into account when judging their credibility now and in the future.
------
The Heartland Institute is a 28-year-old national nonprofit organization with offices in Chicago, Illinois and Washington, DC. Its mission is to discover, develop, and promote free-market solutions to social and economic problems. For more information, visit our Web site at http://www.heartland.org or call 312/377-4000.
----------
Wrong: Christian Science Monitor headline on Heartland leak
Posted on February 15, 2012 by Steve Milloy
“Documents reveal Koch-funded group’s plot to undermine climate science.”
Not only do the leaked documents from Heartland not indicate any “plot to undermine climate science” - something that has already been undermined by Michael Mann and his hockey stick - but of Heartland’s $4.6 million 2011 budget, only $25,000 (0.5%) came from the Charles G. Koch Charitable Foundation - and the $25,000 was earmarked for Heartland’s Health Care News project. So the CSM headline is entirely wrong.
------------
CFACT’s Climate Depot website provides further commentary on this outrageous action. Here is the link: http://www.ClimateDepot.com
As Climate Depot director Marc Morano has observed, the sums contributed to skeptical groups like Heartland “are loose change compared to the billions that have been funneled to green groups and alarmist research establishments.” The more the climate chaos edifice collapses, the more angry and desperate the rent-seeking alarmists have become. This is just one more manifestation of their desperation.
Thank you for helping to ensure that the American and world public learn the TRUTH about this despicable theft and fabrication. In addition take note of this environmentalist special interest campaign, which dwarfs even what the Heartland Institute has been falsely accused of.
Another example of bias and incompetence in the mainstream media.
By Steve Goddard
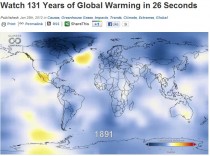
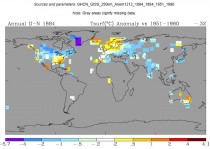
Watch 131 Years of Global Warming in 26 Seconds
There is an incredible amount of misinformation in this video. The first problem is that it starts in 1884, not 1880. But the real problem is that much of their land data is not from any known source.
I overlaid the land coverage of GISS 1884 (green below) on the animation frame from 1884. Note the great detail in the animation over Africa, South America, and central Asia – where they had no data. In Antarctica they had no data at all, yet drew in a tremendous amount of completely fraudulent detail! The first land based exploration of Antarctica didn’t even occur until 1892. Outside of Australia, they only had three or four land based thermometers in the entire southern hemisphere.
They must be using 5,000 km smoothing with highly detailed imaginary sub-smoothing.

---------------
Vitter, Inhofe Continue Investigation Into Allegations of Scientific Misconduct by Obama Administration
Washington D.C. - As part of their ongoing investigation into the scientific misconduct within the Obama Administration, Senator David Vitter (R-La.) and Senator James Inhofe, Ranking Member of the Senate Committee on Environment and Public Works, sent a letter today to Secretary of the Interior Ken Salazar asking him to explain why he consistently ignored serious complaints regarding the scientific integrity of the Director of the National Park Service (NPS) Jon Jarvis, and why these allegations were not addressed during Mr. Jarvis’ nomination process.
On three occasions in 2009, as Mr. Jarvis’ nomination for this Interior position was being vetted, a distinguished member of the National Academy of Sciences (NAS), Dr. Corey Goodman, wrote to Secretary Salazar explaining in detail 21 instances of scientific misconduct by Mr. Jarvis - yet in all three instances, Secretary Salazar failed to respond. In May 2009, however, Secretary Salazar asked Mr. Jarvis to address these 21 counts on his own, but Mr. Jarvis only responded to 7 of them prior to his nomination.
Senator Vitter: “We’ve seen facts manipulated and science ignored across the administration while they’ve developed policies with huge negative effects on the economy. We want the public to be aware of the administration’s scientific gimmickry, because important policy decisions by the EPA and Interior shouldn’t be based on guesswork or manipulated facts - and we want the agencies to be transparent and explain their methods.”
Senator Inhofe: “It is extremely troubling that 21 counts of scientific misconduct by Mr. Jarvis were either ignored or only partially addressed by Secretary Salazar, especially as Mr. Jarvis was being considered for a key post within the Department of the Interior. However, given the numerous examples of the Obama Administration using dubious science to bolster their agenda, I am not surprised. Senator Vitter and I will continue to pursue this case, as well as the many other instances of scientific misconduct with the Obama Department of the Interior and EPA, until we have answers.”
Today’s letter marks the latest in a series of instances uncovered by Senators Vitter and Inhofe which display a serious lack of scientific integrity within the Obama Environmental Protection Agency (EPA) and the Department of the Interior.
The EPA and Interior should be defunded should America come to its senses and remove the current administration.
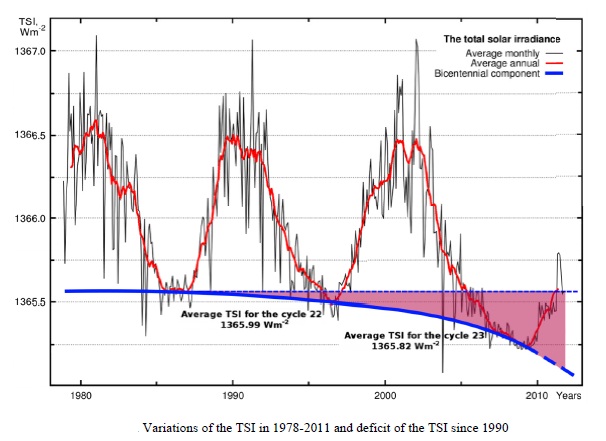
Habibullo I. Abdussamatov, Pulkovo Observatory of the RAS
Applied Physics Research Vol. 4, No. 1; February 2012
Abstract
Temporal changes in the power of the longwave radiation of the system Earth-atmosphere emitted to space always lag behind changes in the power of absorbed solar radiation due to slow change of its enthalpy. That is why the debit and credit parts of the average annual energy budget of the terrestrial globe with its air and water envelope are practically always in an unbalanced state.
Average annual balance of the thermal budget of the system Earth-atmosphere during long time period will reliably determine the course and value of both an energy excess accumulated by the Earth or the energy deficit in the thermal budget which, with account for data of the TSI forecast, can define and predict well in advance the direction and amplitude of the forthcoming climate changes.
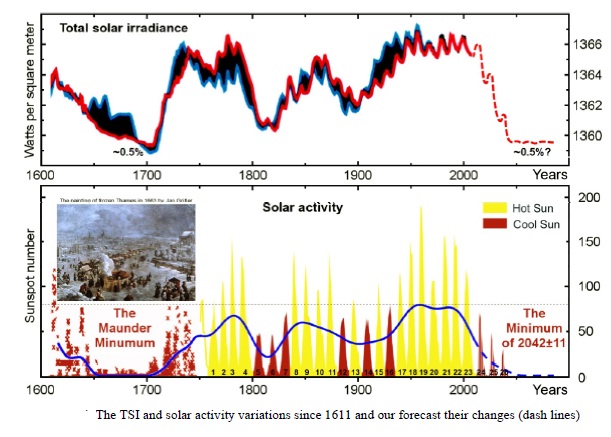
From the early 1990s we observe bicentennial decrease in both the TSI and the portion of its energy absorbed by the Earth. The Earth as a planet will henceforward have negative balance in the energy budget which will result in the temperature drop in approximately 2014. Due to increase of albedo and decrease of the greenhouse gases atmospheric concentration the absorbed portion of solar energy and the influence of the greenhouse effect It will additionally decline.
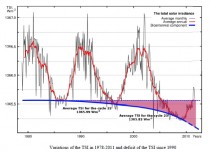
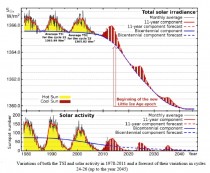
The influence of the consecutive chain of feedback effects which can lead to additional drop of temperature will surpass the influence of the TSI decrease. The onset of the deep bicentennial minimum of TSI is expected in 2042plus or minus 11, that of the 19th Little Ice Age in the past 7500 years - in 2055 plus or minus 11.
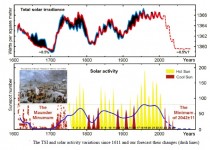
After the maximum of solar cycle 24, from approximately 2014 we can expect the start of the next bicentennial cycle of deep cooling with a Little Ice Age in 2055 plus or minus 11. Thus, long-term variations of TSI (with account for their direct and secondary, based on feedback effects, influence) are the main fundamental cause of climate changes since variations of the Earth climate is mainly determined by a long-term imbalance between the energy of solar radiation entering the upper layers of the Earth’s atmosphere and the total energy emitted from the Earth back to space.
See full paper PDF.
By Dr. Anthony Lupo
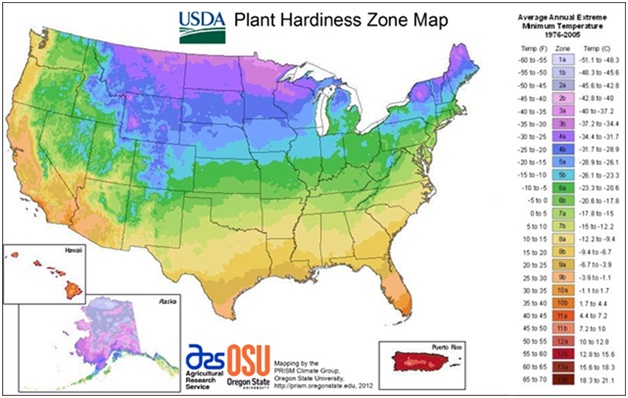
In late January, an updated planting zone map was issued by the USDA for the first time since 1990. As it was during the summer of 2011 when the new 1981-2010 climate normals were issued, this should be no surprise to climate scientists [1]. The new map is a big improvement over the older one as more data were incorporated using new techniques. It is available also online incorporating geographic information system (GIS) technology allowing it to be an interactive tool for users [2].
But, even as the map was released, stories written by media organizations such as the Associated Press were then carried in publications across the nation e.g. [3]. The first line of the story stated that the map demonstrates global warming is now affecting both your home and garden. It’s as if the map itself demonstrates, or is more proof for, the occurrence of human induced climate change (global warming refers to this phenomenon). The same article says this reflects the new reality that the coldest days of the year are not as cold anymore. They quote scientists as saying that you can now grow things in your locality that you could not plant before. The implication is that the warmth being experienced in recent decades is unprecedented.
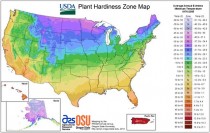
Figure 1. Adapted from the USDA website (enlarged). The plant hardiness zone map created using climate data from 1976 -2005.
However, USDA spokesperson K. Kaplan correctly points out that the map is not the best instrument for demonstrating climate change. She does not deny that climate change has taken place, but that the map is not the best indicator for demonstrating it. She is correct and presumably meant that the current map uses improved methods and more available data than the previous map, thus comparisons would be difficult to make even if climate had not changed.
Climate change has occurred in recent decades and that is easily demonstrated by comparing the 1981-2010 normals to previous periods [1]. The new USDA map included data gathered from 1976-2005 [2], which largely overlaps with the period including the new climate normals. As the article about the new normals stated[1], the new map (Fig. 1) included a period of time that was warmer than the period that was used to create the 1990 plant hardiness map. Thus, the map is going to be reflective of climatic conditions in the immediate past. On a planet where the climate is almost always warming or cooling, the map may be out-of-step with current realities. Global temperatures have been steady or cooling since about 2000 and especially since 2007.
Additionally, there is no way that one can ascribe a cause for climate change by looking at changes in the new normals or plant hardiness. Presumably, changes in the weather and climate, regardless of cause will be reflected by what kind of flora and fauna inhabit a region. As the glaciers shrank away for North America deciduous trees
such as American Beech moved northward from the Deep South and into the Great Lakes Region. Climate skeptics also recount that a thriving wine industry existed into the northern parts of England and the Vikings colonized Greenland during Medieval times, but not today.
An example closer to home and our time reveals that during the 1800s certain types of citrus grew well in Alabama, Florida, and even in South Carolina. In the colder period from about 1890 to 1920, some types of citrus were wiped out of this region (e.g., Satsuma Tangerines), and citrus production in general during this time shifted toward California [4]. In the last few decades, citrus production has increased again even as far north as South Carolina [5].
This is not to criticize the new map. It can only be based on the best available data and technology. But, the larger point is, the map is only guidance for the amateur or
experienced gardener or farmer. The map will always be changing into the future as the climate changes. For example it would be interesting to look at the same map by using comparable data gathered from the period 1921 -1960 when temperatures were still warmer than the current period used for the climate normals. But, it is flawed logic to imply that the new map is more evidence of human induced global warming.
[1] Lupo, A., 2011: Is warmer really the new normal? July 7, 2011.
[2] Kaplan, K., 2012: USDA Unveils New Plant Hardiness Zone Maps. January 25, 2012.
[3] AP Story, 2012: Plant zones get warmer in new map.
[4] Malcolm, P., 2006: History of Citrus. .
[5] ScNow.com, 2009: Citrus in South Carolina?
Update: See this analysis of the corruption of the temperature record by Steve Goddard on Real Science.
Update: See the well deserved credit given to Anthony Watts and WUWT bloggers for the collapse of the Global Warming Charade in this Pat Michael’s editorial on Forbes. Because of Anthony’s surface stations.org effort the Government’s own GAO also pushed NOAA to upgrade the siting of 1000 stations in the Climate Reference Network instead of the originally planned 114 after finding t least 42% failed to meets acceptable standards. In a fair world Anthony should be given an award by AMs instead of Hansen, Gore, Emanuel (3).
By Joseph D’Aleo
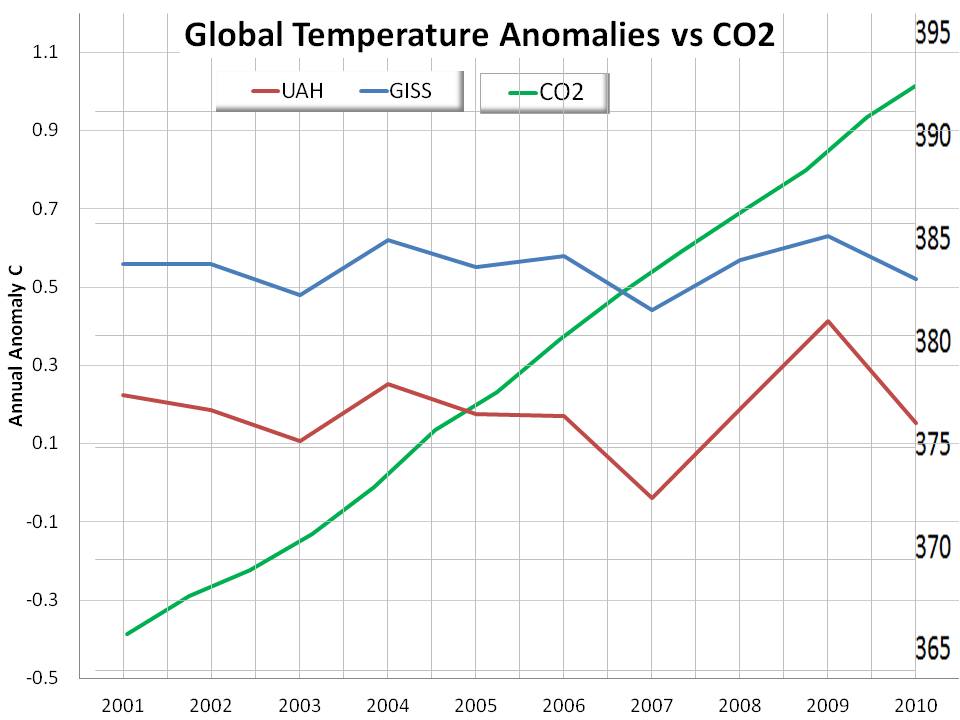
NASA announced this week that 2011 was the ninth warmest year since 1880 (132 years) despite a quiet sun (not really the case) and La Nina.
UAH had 2011 as the 18th warmest (thus 15th coldest) in their 33 years of record keeping. That alone should raise your eyebrows. Obviously the 15th coldest year in the last 33 years could not also be the ninth warmest in 132 years.
Here is a plot of the UAH and NASA GISS temperatures versus the CO2 in the last 10 years.
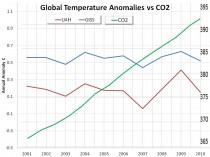
Temperatures are flat even as CO2 has risen almost 8%. It looks like the third coldest year of the ten in NASA and UAH data sets. The anomalies are supposed to be greater (1.2 times) for the lower troposphere as measured by UAH than the surface as measured by GISS because the atmosphere is where the CO2 is supposed to do its trapping work according to the theory. Instead the surface anomalies are three times higher suggesting surface contamination and a failed/incomplete theory.
Notice how much warmer NASA GISS is than UAH.
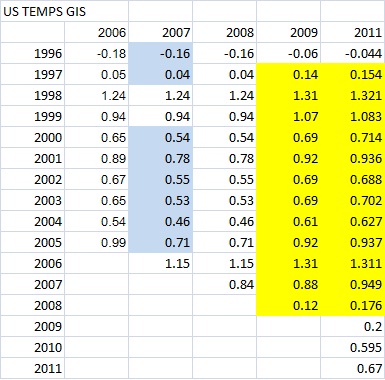
Back in 2007, Steve McIntyre found a millenium bug that elevated the temperatures after 2000 in the NASA data for the US. See how they adjusted down for that for 2007 data. Notice a few years later it all returned as the NOAA USHCN removed the UHI adjustment. Again this year they seem to find more warmth in recent years.
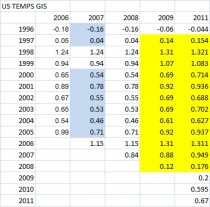
They also have found ways to cool off the prior warm period in the 1930s-1950s to make the current warm cycle look even more impressive. This chart uses an old Hansen temperature plot from 1980 and one from 2010.
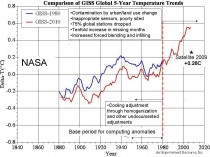
E-mail messages obtained by a Freedom of Information Act request reveal that NASA concluded that its own climate findings were inferior to those maintained by both the University of East Anglia’s Climatie Research Unit (CRU)—the scandalized source of the leaked Climate-gate e-mails—and the National Oceanic and Atmospheric Administration’s National Climatic Data Center.
The e-mails from 2007 reveal that when a USA Today reporter asked if NASA’s data “was more accurate” than other climate-change data sets, NASA’s Dr. Reto A. Ruedy replied with an unequivocal no. He said “the National Climatic Data Center’s procedure of only using the best stations is more accurate,” admitting that some of his own procedures led to less accurate readings. “My recommendation to you is to continue using NCDC’s data for the U.S. means and [East Anglia] data for the global means,” Ruedy told the reporter.
Hansen seems to have a teflon coat. Despite all his failures (including predictions of the West Side Highway being underwater by 2010 made in 1980 - sea level rises are about 1 inch) and data issues, he escapes scrutiny.
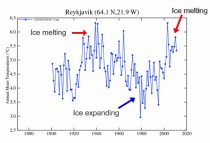
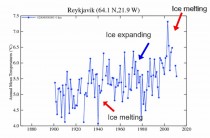
Just to put some numbers to this global manipulation, here is a selection from Iceland the change since last year’sversion. Enhancing warming trend by cooling off the past.
Reykjavik (degrees C)
Year Last This Diff
1911 5.31 4.21 1.1
1941 5.28 4.09 1.19
1971 5.85 4.65 1.2
1991 6.12 4.92 1.2
2011 5.58 5.58 0
NASA was not alone. the three data centeres collaborated as the climategate emails suggest.
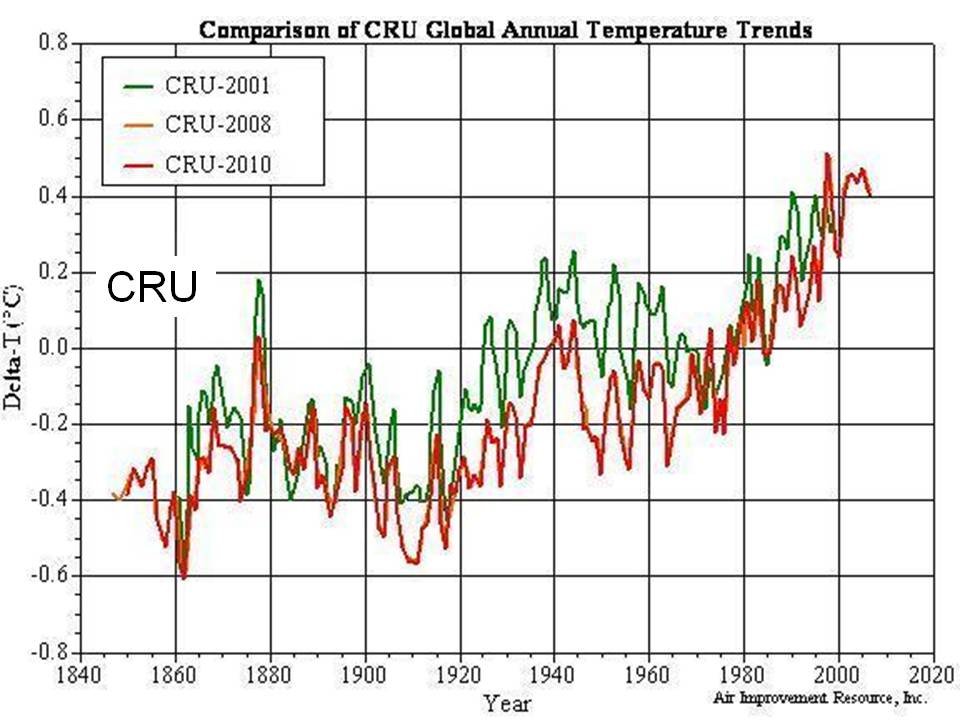
The CRU global records changed similarly.
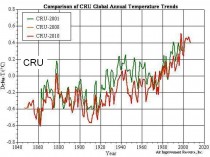
They accomplished this ‘kockey sticking’ by cooling off old data and warming later data, in part through elimination of a UHI adjustment in the US. They also cooled ocean temperatures near the bothersome warm blip around 1940, The climategate emails included one by Wigley of UEA and later NCAR suggesting a cooling then of about 0.15C would be effective but still plausible.
I am working on a document the next few weeks for the broadcasters and forecasters that gives reasons why we should remain objective about climate science and why resources should be spent on research into these natural factors so we can better foresee the large scale oddities like we have seen this winter.
Think Progress has raised the alarm about arctic and Alaskan warming based on a release from the evil advocacy group WWF which uses ficticous arctic readings taken from Hansen’s NASA GISS data set. Hadley and the UAH/RSS arctic make no estimates for the arcttic where there are no reporting stations. Hansen, estimates based on readings taken from 1200 km or more away. In his latest post on Think Progress, another George Soros (a malevolent philanthropist who made his fortunes destroying world economies and peoples), comedy blog, chief comic Joe Romm implies Alaska cold has left for India. Based on the drum beating of the looney left, concerned about mounting evidence that Arctic thawing is accelerating carbon emissions to the atmosphere, the Ranking Member of the House Energy and Commerce Committee, Henry Waxman (Democrat, California a fellow loon), has called for a hearing on the issue.
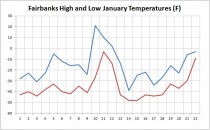
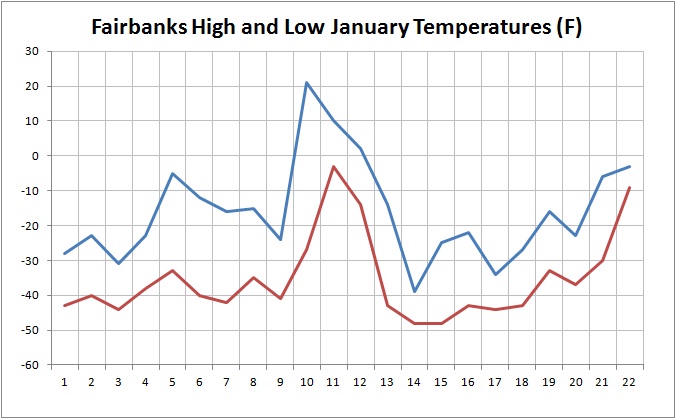
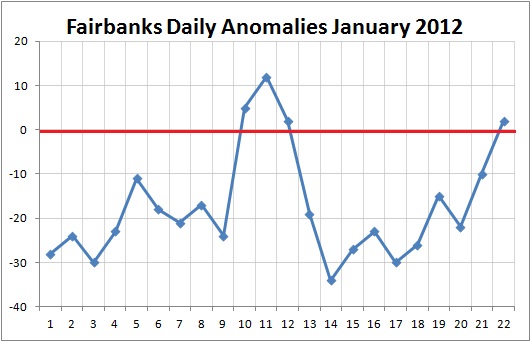
Temperatures dropped to -40F the earliest ever in November in Fairbanks. Record snows fell in southern Alaska from Anchorage east - some place 160 inches above normal through early January.
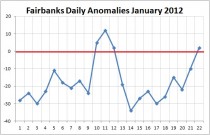
Here is the latest plot for January Fairbanks high and low daily temperature and then anomalies. 13 days below -40F, an average of -25.7F, a departures from normal of -17.6F, ranking it among coldest ever Januarys. Temperatures as low as -56F were seen in Alaska mid month. Balmy indeed.
And the hits just keep on coming, also in Think Progress, they lament that the Soros-funded astroturf campaign has been exposed and denounced for what it is.

ThinkProgress reports:
Right-wing weathermen who publicly reject climate science have responded with anger and vitriol to a campaign that exposes their influence on the American public. More than half of TV weather reporters don’t believe in human-induced climate change, even as our poisoned weather grows more extreme. Forecast The Facts challenges the American Meteorological Society to take a clear stand against these anti-science ideologues.
After ThinkProgress Green promoted the campaign, listing dozens of the prominent television weathermen who publicly heap scorn on scientific reality, the anti-science weatherguy community has lashed out:
- Rush Limbaugh’s “good guy” meteorologist Ryan Maue complained about the “left-wing sh*t website black-listing on-air meteorologists.”
- Accuweather Senior Vice President Mike Smith agreed that the ThinkProgress article “amounts to blacklisting.”
- San Diego’s KUSI-TV weatherman John Coleman said it was “very disturbing” that “the activists now feel the need to campaign to get us under control.”
- Cleveland’s WJW-TV weatherman Andre Bernier said: “The day the AMS strong arms anyone to tow the AGW is the day I disown them.”
- Retired TV weatherman John Ghiorse called the campaign “the ultimate in gestapo tactics.”
Strangely, they didn’t complain when Sen. Jim Inhofe (R-OK) compiled a list of science-denying weathermen in 2007…
These looney progressives prove that not all people are left or right brained. Some are neither.
By Steve Goddard
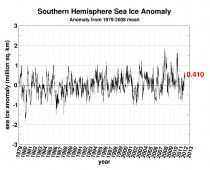
Gore, Hansen, and Trenberth are travelling to Antarctica (where sea ice has been steadily increasing for 30 years- latest anomaly chart below enlarged here) to showcase melting ice. The leader of Gore’s project thinks it is winter in Antarctica.
Former Vice President Al Gore is taking his fight against climate change to Antarctica next week as part of a cruise organized by his Climate Reality Project.
Gore and more than 100 fellow travelers will depart from Argentina late next week. Scientists, including climatologists James Hansen of NASA and Kevin Trenberth of the National Center for Atmospheric Research, will give talks during the journey.

The Antarctic voyage is part of a larger campaign to focus attention on the threat climate change poses to the world’s ice sheets and glaciers - a subject Gore highlighted in his 2007 documentary, “An Inconvenient Truth,” and at a 2009 conference he convened with Norway’s foreign minister, Jonas Gahr Støre.
“This winter we will be talking about Antarctica as part of our ‘Living on Thin Ice’ campaign which will focus on how people around the globe are being impacted by the melting of the world’s ice,” Climate Reality Project spokesman Eric Young said. “As part of that effort, we are journeying to Antarctica with our chairman, Vice President Gore, and leading scientists and thinkers to see firsthand how the climate crisis is unfolding.” EENEWS
A possible hint for them about the season would be the fact that Antarctica is completely surrounded by hundreds of miles of ice during the wintertime, and that it is also very dark and cold. Given that nobody lives in Antarctica, that sea ice is increasing there, and that temperatures are declining - one might question how anyone there is being impacted by melting ice.
h/t to Marc Morano and http://junkscience.com
Also the climate criminals are counting on the media and public not knowing it is summer in Antarctica now and the sea ice melts alomng the edges in the summer. This is the same trick NBC’s Tom Brokaw or Scott Pelle used standing at the edge of a dripping glacier in summer and claiming it was the ‘canary in the coal mine’.
Another stooge, proven liar, Naomi Oreskes heard from in another progressive rag ”The verdict is in on climate change - When it comes to climate change, open-mindedness is the wrong approach.
We have to get over that flawed notion. Scientists don’t play the role of prosecutor trying to prove a case. Rather, they are the jury trying to evaluate the evidence. And they have rendered their verdict. The problem is not that scientists have become advocates, as some have claimed. The problem is that there is no judge, no recognized authority giving us instructions we accept, and no recognized authority to accept the scientists’ verdict and declare it final.
By Joseph D’Aleo, Weatherbell Analytics
A persistent Pacific jet stream has pounded Alaska but kept winter at bay in the early winter in the lower 48 states.
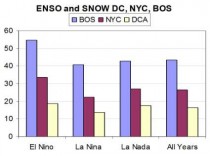
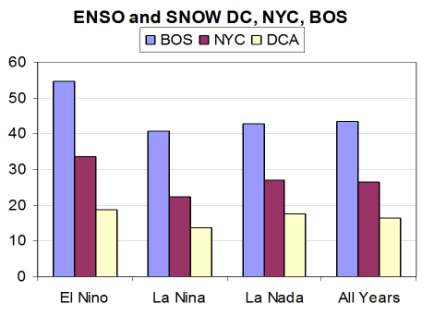
In the Washington Post, they reported on this lack of snow drought so far this season and admitted it was typical of La Ninas. All the cities of the east do well in El Nino winters, with major snowstorms.
Enlarged
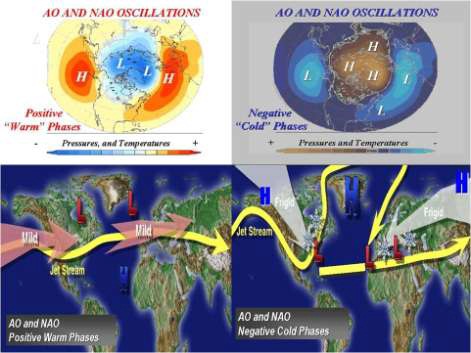
This year winter started with a strong polar vortex. This strengthens the westerlies and pumps Pacific Maritime air in to North America and mild Atlantic air into Europe. In 2009/10 in contrast, a very weak polar vortex allowed warmer air can penetrate into the polar high atmosphere and buckle the jet stream in ways that allows cold air to dump to middle latitudes. Big snows resulted.
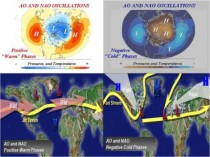
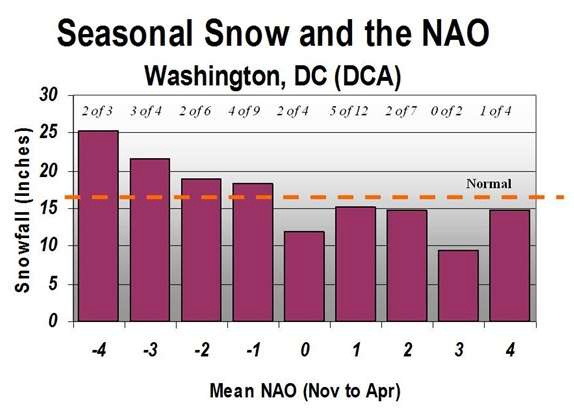
A negative NAO (and AO) leads to heavy snow in the major cities including DC.

Enlarged
2009/10 had record blocking negative NAO and an El Nino. The combination produced all-time record snows.

This season we have a La Nina and started the season with a very positive NAO and AO. That is why snow has been so hard to come by. The NAO and AO are turning negative. This will help but especially in the northeast.
TRENDS DOWN?
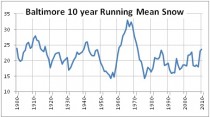
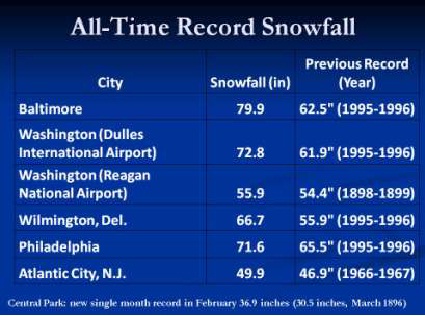
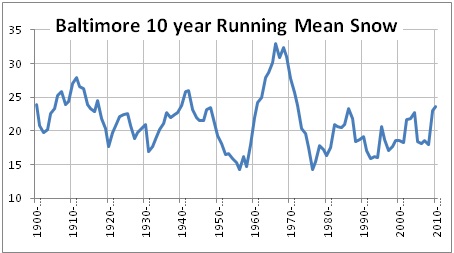
In the Post, Jason Sabenow reported that the DC airports have seen a decline in snowfall of about an inch a decade. Doing a 10 year running mean of seasonal snowfall does not confirm this claim. Baltimore showed a big spike in the 1960s, a cold decade with very negative AO/NAO and 4 cold El Ninos. It declined in the La Ninas of the 1970s but then has increased slightly the last 35 years.
New York City running means show ups and downs but current values are the largest since the 1910s and 1920s. Spikes also were seen in the 1940s and 1960s.
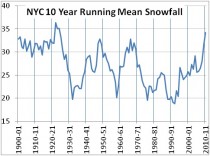
Enlarged
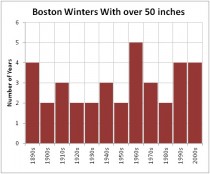
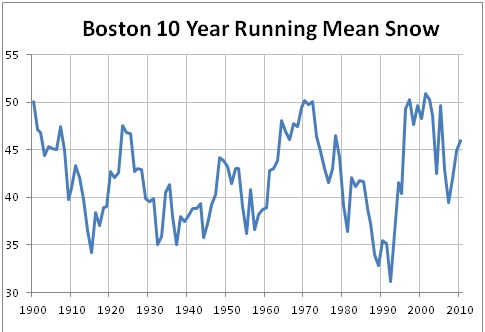
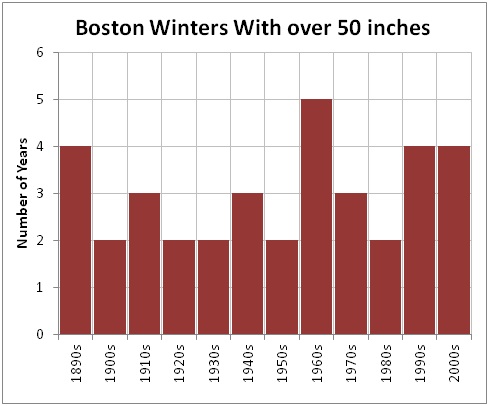
For Boston, the 1960s and 1990s/2000s were the peak snow years.
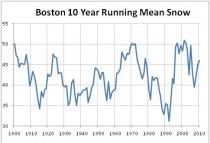
That is seen also in the number of years with over 50 inches of snow.
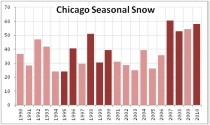
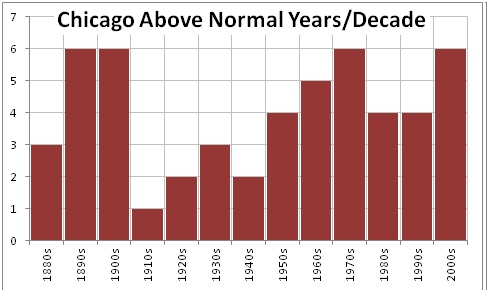
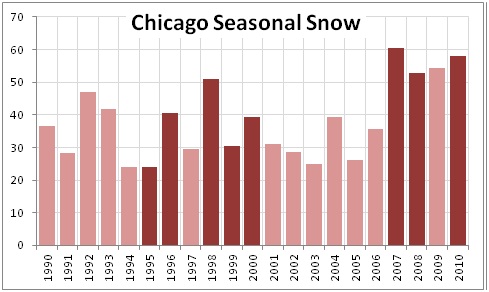
Chicago has had more recent above normal snow years like it did in the last cold PDO years (with more La Ninas) from the 1950s to 1970s.
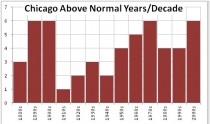
Enlarged
Chicago snowfall is running below normal and after four big years, that would not be surprising even with La Nina.
As for northern hemisphere snow in winter, it has trended up since 1967. Behind 1977/78 we find 2009/10, 2010/22, 2007/08 and 2002/03.
This is likely to fall far short of the top 5 this year, but the trends in the big cities and hemisphere are up not down. AND the winter will turn more active given the redevelopment of blocking. Most of the traditional La Nina snowy areas will do better starting the rest of this month. Last winter most of the action came early ending in early February. This year will be the opposite. DC will likely have to wait for the next El Nino (2012/13?) to cash in. But then again AGWers have it covered either way.
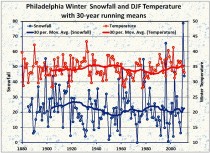
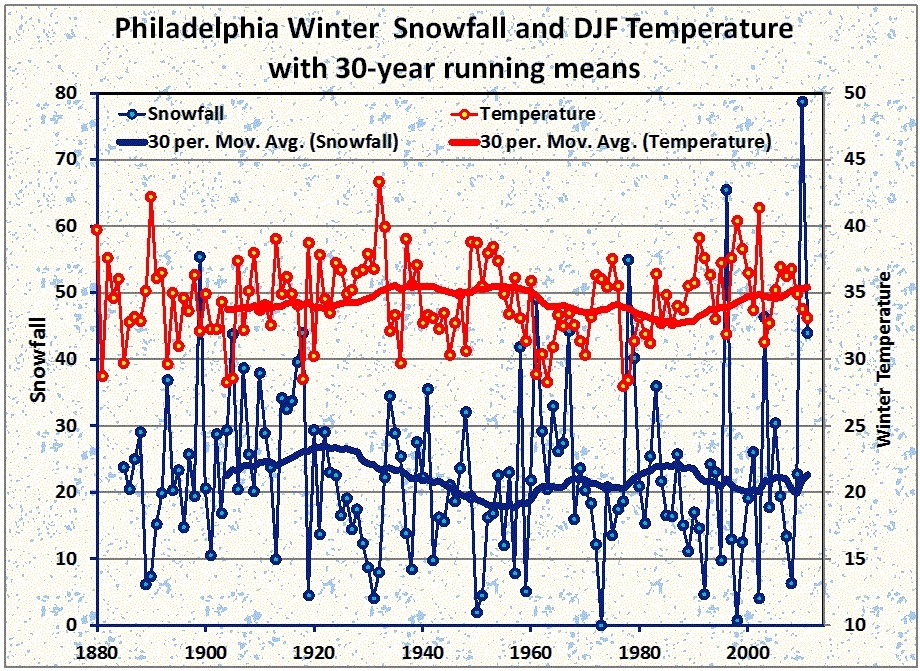
BTW, Dr. Richard Keen sent this note about PHL.
The PHL data (attached) is an updated version of the one I posted in an ICECAP article a year ago, and tells the same story as all the other locations. There is little trend in either snowfall or winter temperature over the past 130 years, and recent averages are the same as those 60 or 80 years ago. There is a bit of an up-and-down signal in both snowfall and temperature, all following the AMO quite nicely.
Anecdotally, Philadelphia’s snow low point in the 1930’s - 1950’s was due to a warm AMO that brought several exceptional hurricanes (culminating in 1954’s Hazel), mild winters, hot summers, and so little snow that I couldn’t use a Flexible Flyer sled I got for Christmas until three winters had passed. So a light winter with little snow is nothing new.
He adds from his mountain home in CO, Not a dud winter here - second snowiest December (71.6 inches) and season-to-date as of 12/31 (115.6), and a record wind gust (110 mph) on New Year’s eve. Ground blizzards and 70+ gusts most days this month.
I’m glad I installed a supplemental propane stove in the living room last summer. Thank God for having the foresight to load us up with fossil fuels a billion years ago.
By Steve Goddard
Hansen’s original data accurately showed the rapid warming during the 1920s, the 1940s temperature spike, and the rapid cooling during the 1970s.
Melting in 1940 :
The Courier-Mail Monday 6 May 1940
By far the largest number of local glaciers in north-east Greenland had receded very greatly during recent decades, and it would not be exaggerating to say that these glaciers were nearing a catastrophe.
In Alaska glaciers had been retreating from 100 to 200 years, the average rate of recession being about 50 feet a year. The Antarctic ice- sheet also showed signs of recent retreat.
“In fact,” said Professor Speight, “no case is recorded of a region of the world in which there are present signs of an advance.
The Sydney Morning Herald Friday 13 January 1939
The CIA wrote of ice expansion in 1974 :
“Early in the 1970s … the world’s snow and ice cover had increased by at least 10 to 15 percent”
Science News wrote this in 1975
The weather in the first part of this century has been the warmest and best for world agriculture in over a millenium, and, partly as a result, the world’s population has more than doubled. Since 1940, however, the temperature of the Northern Hemisphere has been steadily falling: Having risen about 1.1 degrees C. between 1885 and 1940, according to one estimation, the temperature has already fallen back some 0.6 degrees, and shows no signs of reversal. Specific areas, of course, may experience changes markedly different from the average. During the warming period, temperatures in parts of Norway rose five times more than the hemisphere average, and since the cooling trend began again, Iceland’s temperature has dropped nearly 2.0 degrees, threatening continued existence of some crops.
By contrast, Hansen’s new corrected data makes no sense. He now shows early 1970s temperatures warmer than 1930s temperatures.
Unless the freezing point of water has changed, Hansen’s “corrections” are bogus. They appear to be based on politics, not science.
See post. See more on GISS nonsense here.
By Kirk Myers, Seminole County Environmental News Examiner
This article, the second in a series, focuses on the misleading performance claims surrounding the “more energy efficient” compact fluorescent light (CFL) bulbs now replacing traditional incandescent bulbs. These potentially harmful mercury-filled lamps (see my previous column describing the dangers) are being forced on consumers by the U.S. congress with support from the Green Lobby and light-bulb manufacturers like GE, Sylvania and Phillips. These and other manufacturers stand to make huge profits selling the more expensive CFLs (more on that issue in my next column).
There is a growing body of evidence undermining claims of the EPA, environmental lobby and light bulb manufacturers touting the performance advantages of mercury-laced CFL bulbs.
Exaggerated lifespan
Real-world reports from the home front show that the claimed extended lifespan of CFLs is often greatly exaggerated. There is ample data indicating that the frequent switching on and off of CFLs greatly shortens their life. A study by H. Sterling Burnett, senior fellow at the National Center for Policy Analysis, and co-author Amanda Berg concludes
“Unfortunately, except under a fairly narrow range of circumstances, CFLs are less efficient than advertised. Manufacturers claim the average life span of a CFL bulb is 10,000 hours. However, in many applications the life and energy savings of a CFL are significantly lower. Applications in which lighting is used only briefly (such as closets, bathrooms, motion detectors and so forth) will cause CFL bulbs to burn out as quickly as regular incandescent bulbs . . . When initially switched on, CFLs may provide as little as 50 percent to 80 percent of their rated light output and can take up to three minutes to reach full brightness.”
According to a story in the Wall Street Journal, Pacific Gas & Electric originally estimated the useful life of CFL bulbs at 9.4 years. But based on real-world results, the company was forced to lower its estimate to 6.3 years, meaning that it had overstated bulb life by 49 percent. “The early burn-out rate, along with several other factors, meant that the actual energy savings were 73 percent less than the 1.7 billion kilowatt hours projected by PG&E,” the Journal reported.
Less bright, more dim with age
As many consumers have noticed, CFL bulbs grow dimmer as they age. In a 2003-2004 study, the U.S. Department of Energy reported that one-fourth of CFLs, after only 40 percent of their rated service life, no longer produced at their rated output.
And according to Wikipedia: “CFLs produce less light later in their lives than when they are new. The light output decay is exponential, with the fastest losses being soon after the lamp is first used. By the end of their lives, CFLs can be expected to produce 70-80% of their original light output.”
After conducting its own tests on bulbs from several manufacturers, The Sunday Telegraph in London “found that under normal conditions, using a single lamp to light a room, an 11W low-energy CFL produced only 58 percent of the illumination of an ‘equivalent’ 60W bulb - even after a 10-minute ‘warm-up.’”
The European Commission, which led the effort to ban incandescent bulbs in Europe, said that claims by manufacturers that CFL’s shine as brightly as old-fashioned bulbs are “not true.”
Posted on its website for consumers was the warning that “exaggerated claims are often made on the packaging about the light output of compact fluorescent lamps.”
Higher heating bills
Go-Green advocates like to complain about the fact that 90 percent of the energy from incandescent lights is given off as heat, with only 10 percent providing illumination. But they ignore one important fact: The extra heat given off during the winter months can actually lower energy bills.
According to a study by the Mackinac Center for Public Policy, “The heat of incandescent lights - more than 341 Btu per bulb per hour - can help to warm a room. Therefore, if the cost of electricity is low relative to the cost of home heating fuel, there may be an economic case for changing to incandescent bulbs in colder seasons.”
In other words, on a cold day when you’re running your electric heater, it makes sense to flip on all those incandescent heat sources. Of course, the contribution of incandescent bulbs to lower heating bills is conveniently missing from pro-CFL literature.
Unsuitable for outdoor lighting
What about the use of CFLs for outdoor lighting? Forget it. Most do not operate well in low temperatures, a performance shortfall that makes them virtually useless for home-security lighting, including as lights in motion detectors. By signing the incandescent bulb’s death warrant, congress has effectively rendered useless outdoor lighting systems that keep away intruders and discourage home break-ins.
Myth of mercury reduction
One of the most misleading arguments advanced in defense of CFLs is the assertion that they reduce harmful mercury levels (a dubious proposition given that the bulbs themselves are laced with mercury).
Case in point: In a letter to the Wall Street Journal in December, CFL advocate Nicole Lederer claimed that “coal-fired power plants produce about half of all mercury.”
In his Jan. 5 response, Charles Battig of Scientists and Engineers for Energy and Environment-Virginia called the statement “scientifically vacuous and misleading.”
Battig cited data from an op-ed ("The Myth of Killer Mercury” by Willie Soon and Paul Driessen) that broke down mercury contributions as follows: “U.S. coal-fired plants, about 41-48 tons per year; forest fires, about 44 tons per year; Chinese power plants, 400 tons per year, while recurring geological events such as volcanoes and geysers emit 9,000-10,000 tons per year.”
“With these missing pieces of information, wrote Battig, the U.S. power plant contribution of mercury is closer to a 0.5% value than the “half of all mercury” claim by Ms. Lederer.”
Battig then offered this advice:
“Would that Ms. Lederer and the Environmental Entrepreneurs expend an equal amount of environmental anguish over placing compact fluorescent lamp bulbs indoors in homes, schools and factories. These mercury-containing, stealth-pollution bulbs bring the mercury threat right into your living room and nursery.”
No good reason for switchover
The fact is there is no good reason for consumers - even energy-conscious go-green enthusiasts - to replace their old incandescent bulbs with the much-overhyped and potentially dangerous CFL lamps. The sole beneficiaries of the forced switchover are light bulb manufacturers who stand to make huge profits selling CFL bulbs whose shelf price has been artificially lowered (but still is higher than incandescent bulbs) through hefty subsidies paid to them by taxpayers.
In light of the facts, the switchover to CFL bulbs has become a real consumer turn-off.
By Nir Shaviv, Science Bits
A few days ago I had a very pleasant meeting with Andrew Bolt. He was visiting Israel and we met for an hour in my office. During the discussion, I mentioned that the writers of the recent IPCC reports are not very scientific in their conduct and realized that I should write about it here.
Normal science progresses through the collection of observations (or measurements), the conjecture of hypotheses, the making of predictions, and then through the usage of new observations, the modification of the hypotheses accordingly (either ruling them out, or improving them). In the global warming “science”, this is not the case.
What do I mean?
From the first IPCC report until the previous IPCC report, climate predictions for future temperature increase where based on a climate sensitivity of 1.5 to 4.5C per CO2 doubling. This range, in fact, goes back to the 1979 Charney report published by the National Academy of Sciences. That is, after 33 years of climate research and many billions of dollars of research, the possible range of climate sensitivities is virtually the same! In the last (AR4) IPCC report the range was actually slightly narrowed down to 2 to 4.5C increase per CO2 doubling (without any good reason if you ask me). In any case, this increase of the lower limit will only aggravate the point I make below, which is as follows.
Because the possible range of sensitivities has been virtually the same, it means that the predictions made in the first IPCC report in 1990 should still be valid. That is, according to the writers of all the IPCC reports, the temperature today should be within the range of predictions made 22 years ago. But they are not!
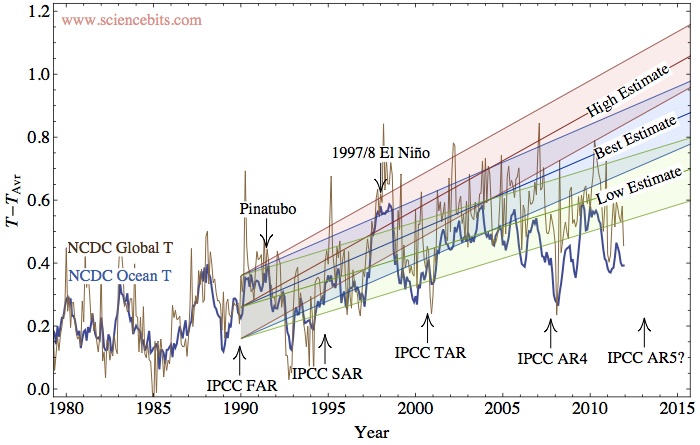
The business as usual predictions made in 1990, in the first IPCC report, are given in the following figure.
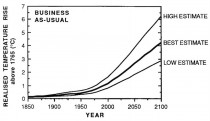
The business-as-usual predictions made in the first IPCC report, in 1990. Since the best range for the climate sensitivity (according to the alarmists) has not changed, the global temperature 22 years later should be within the predicted range. From this graph, we take the predicted slopes around the year 2000.
How well do these predictions agree with reality? In the next figure I plot the actual global and oceanic temperatures (as made by the NCDC). One can argue that either the ocean temperature or the global (ocean+land) temperature is better. The Ocean temperature includes smaller fluctuations than the land (and therefore less than the global temperature as well), however, if there is a change in the average global state, it should take longer for the oceans to react. On the other hand, the land temperature (and therefore the global temperature) is likely to include the urban heat island effect.
>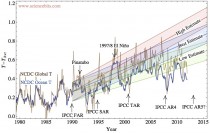
Enlarged
The NCDC ocean (blue) and global (brown) monthly temperature anomalies (relative to the 1900-2000 average temperatures) since 1980. The observed temperatures compared to the predictions made in the first IPCC report. Note that the width of the predictions is ±0.1°C, which is roughly the size of the month to month fluctuations in the temperature anomalies.
From the simulations that my student Shlomi Ziskin has carried out for the 20th century, I think that the rise in the ocean temperature should be only about 90% of the global temperature warming since the 1980’s, i.e., the global temperature rise should be no more than about 0.02-0.03°C warmer than the oceanic warming (I’ll write more about this work soon). As we can see from the graph, the difference is larger, around 0.1°C. It would be no surprise if this difference is due to the urban heat island effect. We know from McKitrick and Michaels’ work, that there is a spatial correlation between the land warming and different socio-economic indices (i.e., places which developed more, had a higher temperature increase). This clearly indicates that the land data is tainted by some local anthropogenic effects and should therefore be considered cautiously. In fact, they claim that in order to remove the correlation, the land warming should be around 0.17°C per decade instead of 0.3. This implies that the global warming over 2.2 decades should be 0.085°C cooler, i.e., consistent with the difference!
In any case, irrespective of whether you favor the global data, or the oceanic data, it is clear the the temperature with its fluctuations is inconsistent with the “high estimate” in the IPCC-FAR (and it has been the case for a decade if you take the oceanic temperature, or half a decade, if you take the global temperature, not admitting that it is biased). In fact, it appears that only the low estimate can presently be consistent with the observations. Clearly then, earth’s climate sensitivity should be revised down, and the upper range of sensitivities should be discarded and with it, the apocalyptic scenarios which they imply. For some reason, I doubt that the next AR5 report will consider this inconsistency, nor that they will revise down the climate sensitivity (and which is consistent with other empirical indicators of climate sensitivity). I am also curious when will the general public realize that the emperor has no clothes.
Of course, Andrew commented that the alarmists will always claim that there might be something else which has been cooling, and we will pay for our CO2 sevenfold later. The short answer is that “you can fool some of the people some of the time, but you cannot fool all of the people all of the time!” (or as it should be adapted here, “you cannot fool most of the people indefinitely!”).
The longer answer is that even climate alarmists realize that there is a problem, but they won’t admit it in public. In private, as the climate gate e-mails have revealed, they know it is a problem. In October 2009, Kevin Trenberth wrote his colleagues: “
The fact is that we can’t account for the lack of warming at the moment and it is a travesty that we can’t. The CERES data published in the August BAMS 09 supplement on 2008 shows there should be even more warming: but the data are surely wrong. Our observing system is inadequate. ”
However, instead of reaching the reasonable conclusion that the theory should be modified, the data are “surely wrong”. (This, btw, is a sign of a new religion, since no fact can disprove the basic tenets).
When you think of it, those climatologists are in a rather awkward position. If you exclude the denial option (apparent in the above quote), then the only way to explain the “travesty” is if you have a joker card, something which can provide warming, but which the models don’t take into account. It is a catch-22 for the modelers. If they admit that there is a joker, it disarms their claim that since one cannot explain the 20th century warming without the anthropogenic contribution, the warming is necessarily anthropogenic. If they do not admit that there is a joker, they must conclude (as described above) that the climate sensitivity must be low. But if it is low, one cannot explain the 20th century without a joker. A classic Yossarian dilemma.
This joker card is of course the large solar effects on climate.
Drew Cline, Union leader
A group called Carbon Solutions New England has circulated a petition that it says was signed by 50 scientists urging the Republican presidential candidates and all other candidates for public office “to acknowledge the overwhelming balance of evidence for the underlying causes of climate change, to support appropriate responses to reduce the emissions of greenhouse gases, and to develop local and statewide strategies to adapt to near-term changes in climate.”
The petition lists recent temperature and weather trends, such as warmer autumns and winters and more storms, and asserts such indisputably rigorous scientific assessments as: “These shifts in New Hampshire’s climate are clearly connected to changes in global climate.”
To respond with equal scientific authority: No, they’re not.
That is, some seem to be, others might not be, but where is the proof of a connection to human behavior? They provide none.
It is a funny little bit of propaganda made all the more humorous by its labeling as “scientists” a historian, a sociologist, two political scientists, a professor of health economics, several civil engineers, two medical doctors, and some Ph.D. candidates.
Nothing says “We are serious scientists; heed our doomsday predictions!” quite like the overstating of credentials. If they’ll overstate their credentials, then why wouldn’t they overstate the connection between recent weather events and human behavior?
Nonetheless, the petition got written up in The Hill, which lent it some undue legitimacy. Voters ought to ignore it.
---------------------
Even the Warmists Don’t Believe In Global Warming
By Louis Woodhill, Forbes
Much was written about the most recent United Nations Climate Change Conference, which was held in Durban, South Africa November 28 through December 9 of this year. However, most commentators gave short shrift to the most important - in a sense, the only - outcome of the meeting. This was, of course, the agreement to hold yet another conference in yet another nice location (Qatar) about a year from now.
The Durban conference was the seventeenth conference of its kind. They have been held annually since 1995 in places such as Geneva (in July 1996) and Bali (in December 2007). Don’t hold your breath for one to be held in Newark, New Jersey, or Fargo, North Dakota.
The meeting in Durban provided an opportunity for Progressives to make their latest argument that ordinary people should surrender their freedom and hand all money and power over to unelected, unaccountable “experts” like, well, the people at the conference. This is, of course, in order to “save the planet” from “climate change”. (The issue that had for years been called “global warming” was rebranded as “climate change” when the most recent decade’s worth of data proved uncooperative.)
First, let’s get the known and knowable facts out of the way. Is the climate changing? Yes. One feature of the manifested universe is the impermanence of all things. The climate has changed over time and will continue to change. Is the change good or bad? Like all change, it is both good and bad.
But, overall, is it good or bad? We can’t say. We don’t even have a conceptual framework that would allow us to answer that question, or even to adequately describe how the climate is changing. “Climate” is an abstraction, and all abstractions are untrue (or at least incomplete).
Is human activity causing the climate to change? We don’t know, and there is no way, even in principle, that we can know. It is difficult enough to determine the “what” of climate change. To determine the “why”, we would need to do controlled experiments. And, for this, we would need another planet, identical in every way to our own earth, which we could use as a “control”.
But wait! Isn’t the science “settled”, thus making anyone who questions the climate change “consensus” an anti-intellectual Luddite? No. Nothing in science is ever settled.
“Science” consists of nothing but theories that have not yet been disproved by evidence, but which, in principle, could be so disproved. Even Einstein’s theory of relativity, which has been validated by thousands of experiments and measurements over almost a century, was recently called into question by experiments involving neutrinos that appeared to travel faster than light.
If something is “settled”, it is not science. It is religious dogma, and an assault upon freedom of thought and inquiry.
But don’t the climate scientists’ computer models prove that carbon dioxide emissions from burning fossil fuels are causing climate change? No. First, no computer model can ever prove anything (see the definition of “science” given above). Second, we do not have the capability to model a system as complex as the earth.
The most any computer model can be is a useful tool. As it happens, all of the computer models that have been developed over the years by climate change proponents have already been invalidated by events that they did not accurately predict. For example, given the fast rising CO2 concentration in the earth’s atmosphere, global temperatures should have gone up much faster than they have over the past ten years. (And, it is not even clear that they have risen at all,)
So, we don’t know what is really happening to the earth’s “climate”. Even if we did, we could not be sure why it was happening. And, we have no way of knowing whether the change was good or bad for mankind as a whole.
But what of the Progressives’ argument that, because the effects of climate change are potentially so disastrous, we should surrender our freedom and move to a centrally planned world economy managed by experts, “just in case”?
Two points about this: first, it’s not going to happen. The Progressives will have to content themselves with extracting a few billion dollars per year from taxpayers to fund cushy “research” and “advocacy” jobs, and to hold climate change conferences like the one that just concluded in Durban. Second, the climate change advocates obviously don’t believe in climate change themselves.
You can’t necessarily tell what people are truly committed to from what they say. However, you can always tell what they are truly committed to by how they negotiate. If someone really wants to do something, they will react to a suggestion by engaging it. They will “work with” the suggestion, trying to see how it can help them do what they say they want to do. If someone says that they want to do something but they really have some other agenda, they will respond to a suggestion with an instant, “Yes, but…”
The climate change crowd has been frantically “yes, butting” geoengineering, which involves using technology to control the climate directly. Their efforts in this regard would be hilarious if the stakes in terms of money and freedom were not so high.
It is obvious that even if “climate change” is happening, and even if it is a bad thing, it is not going to be reversed by reducing CO2 emissions. Despite decades of climate change conferences, protocols, and agreements, fossil fuel use has been rising rapidly as people all over the world have adopted free market economics as a way of escaping poverty. So, if anything at all is going to be done about climate change, it will have to be done by “geoengineering”.
Geoengineering is a far more logical response to “global warming” than are efforts to curb CO2 emissions. First of all, geoengineering does not require that our assumption that it is man-made CO2 emissions that are causing the problem be correct. It would work regardless of what was “really” causing global temperatures to rise. Second, there are geoengineering approaches that could cool the earth at a cost of a few billion dollars per year, rather than tens of trillions of dollars per year. And, third, geoengineering does not require that the people of the world surrender their personal and economic freedom.
Given that geoengineering has the potential to actually do something about the climate change “problem”, the reaction of the climate change crowd to it has been illuminating. They have gone all-out to stop geoengineering experiments from being conducted, and they are doing everything they can to prevent geoengineering from even being discussed.
Climate change proponents recently mounted a desperate effort to stop an experiment in Britain designed to spray 40 gallons of pure water into the upper atmosphere (the so-called SPICE project). Thus far, they have managed to delay the test, and they are arguing that even if the experiment goes ahead, the results should not be made public.
The Progressives are well aware that their opposition to geoengineering experiments exposes their entire game, which is all about money, power, and central-planning control of people’s lives, and has nothing to do with concern about the earth. Unfortunately (for them), they have no choice. Geoengineering solutions might actually work, but they do not require that Progressives be given taxpayer money to hold lavish conferences in lovely places like Durban, South Africa.
By Wesley Pruden, The Washington Times
ANALYSIS/OPINION
“Climate research,” the New York Times confidently assures us, “stands at a crossroads.” This means that a lot of research scientists are standing at the crossroads, holding out paper bags like trick-or-treaters on Halloween night, standing in line for taxpayer largesse to fill ‘em up.
These specialists in shakedown “science,” who speak only in hyperbole, are calling the weather of 2011 the worst in history, or at least in memory, or maybe a decade, and say they could have found useful links between disasters and global-warming “science” by now if only they could shake down tightwad taxpayers for a few more millions.
The National Oceanic and Atmospheric Administration (NOAA) made a little list of a dozen weather disasters of the year now swiftly passing into history - wildfires in Texas, floods on the Mississippi and tornadoes in Tornado Alley. Unfortunately for global-warming “scientists” ever on the scout for handouts, there were no bad hurricanes to report this year. Nevertheless, the speakers of hyperbole are making the best of the scant material at hand.
“I’ve been a meteorologist for 30 years and have never seen a year that comes close to matching 2011 for the number of astounding, extreme weather events,” the easily astounded Jeffrey Masters of the Weather Underground website tells the newspaper, which is always alert for opportunities to beat this favorite drum. “Looking back in the historical record, which goes back to the late 1800s, I can’t find anything that compares, either.”
Maybe he should look a little harder. The disasters, calamities and other inconveniences blamed on changing weather include not only floods and fires in the United States but similar disasters in Australia, the Philippines and Southeast Asia, where calamity is part of something called “life.” Anyone spooked by “unprecedented flooding” in the Mississippi River Valley in the United States should check the precedents of the great floods of 1927 and 1937, when much of Arkansas, Mississippi and Louisiana lay underwater for weeks, and mud even longer.
The hyperbolic claims that man has never been so badly abused by the weather, and that man himself has asked for it with his wild and wicked ways abusing nature, are given the lie by the fact that the weather has been wild and wicked in many millennia before this one, when there were not nearly so many of us stalking the planet for opportunities to make mischief.
The Intergovernmental Panel on Climate Change predicts that 70 percent of the various species on the planet will be wiped out if global warming continues at the predicted rate. Floods, droughts, hurricanes, blizzards and other bad stuff will do us in.
The solution, the panel says, lies in either mitigation, to finally do something about the weather, or adaptation, to make the best of the bad news.
Mitigation relies on regulation, and naturally the worthies of shakedown science prescribe mitigation first. Regulation will require many studies, written in the language of academics that no one else can understand, to be read at elaborate conferences, always held at luxury resorts that a shakedown scientist could never afford on his own dime. The conclusion of the learned shakedown artists is invariably about how to milk the governments of the West for more handouts.
The director of NOAA tells the New York Times that with the pressure on the U.S. government to cut expenses and save taxpayers money, “it’s going to be more and more challenging to devote resources to many of our research programs.”
Science, which has replaced religion as the source of faith in certain circles, has otherwise always been skeptical of certitude. Science has always held that nothing is so settled as to be beyond questioning. This held until the propagation of the gospel of global warming. Skeptics are called “deniers,” their arguments mocked, and held up to public ridicule.
It’s a particular conceit of man to imagine that he is both the author and the center of the universe, that whatever happens to the stars is the work of his hand. “We are changing the large-scale properties of the atmosphere,” declares Benjamin D. Santer, a climate scientist at Lawrence Livermore National Laboratory in California. “You can’t engage in this vast planetary experiment - warming the surface, warming the atmosphere, moistening the atmosphere - and have no impact on the frequency and duration of extreme events.”
Or not. “Everybody talks about the weather,” Mark Twain said, “but nobody does anything about it.”
Wesley Pruden is editor emeritus of The Washington Times.
By Joseph D’Aleo, CCM
Roy Spencer announced why the November global Lower troposphere temperature is late this month.
There has been a delay in our monthly processing of global temperature data from AMSU.
An undersea telecommunications cable used to transmit about half of the huge volume of data coming from the Aqua satellite was cut in late November off the coast of the Netherlands, delaying receipt of that data. While there were redundant data transmission capabilities, apparently both failed.
Also, John Christy and I have been on separate travels quite a bit lately (I spent 2 weeks in Miami after my daughter had an emergency C-section - I’m a grandpa!) and now I’m at the AGU in San Francisco, with a trip to DC early next week, so monitoring of the situation has been difficult.
CONGRATULATIONS GRANDPA ROY.
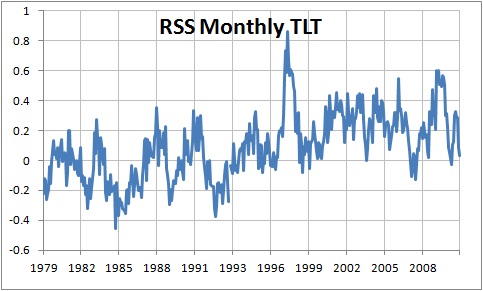
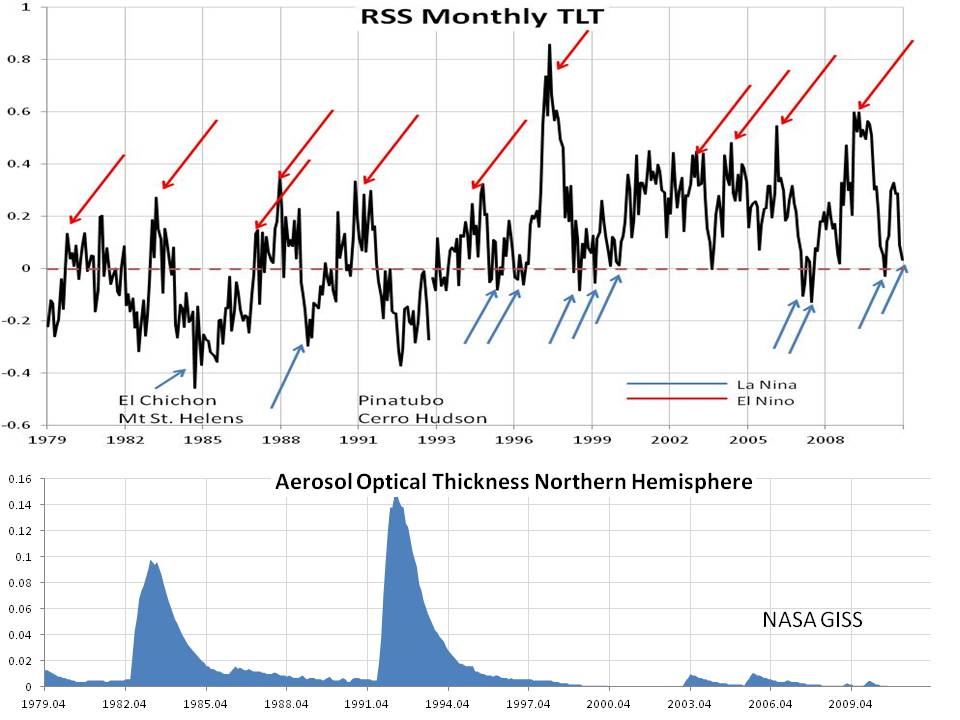
RSS did update their November data. It is down to 0.033C.
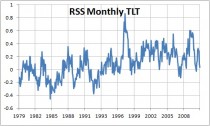
You can explain virtually all the excursions with El Nino, La Nina and volcanism (here indicated by the satellite derived aerosol optical thickness). High aerosol content as we saw in early 1980s and 1990s leads to global cooling and low aerosols (late 1990s through mid 2000s) warming through more insolation.

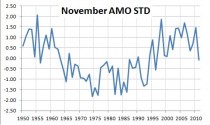
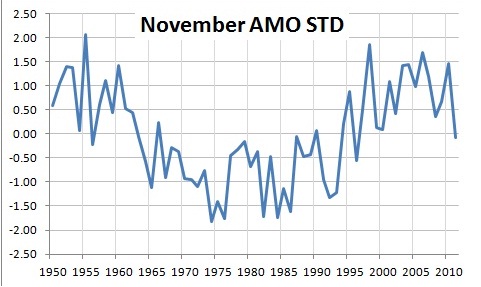
Wednesday we reported the AMO came in negative. The AMO had been negative a few years back for 5 months during the last La Nina cooling period, But popped positive in the super blocking El Nino year 2009/10. A lack of storms in the blocking high region and suppression of the subtropical high south resulted in less mixing up of cold water. It also meant less upwelling off Africa of cold water and also more trade wind zone sunshine. The Atlantic warmed in high and low latitudes in the Northern Hemisphere and AMO popped to over 1.5 STD
Now with a positive AO/NAO and an active north Atlantic storm track and more upwelling, the AMO has taken a dive. For November it is the lowest temperature since 1995.
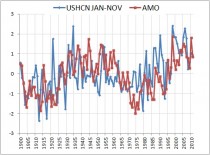
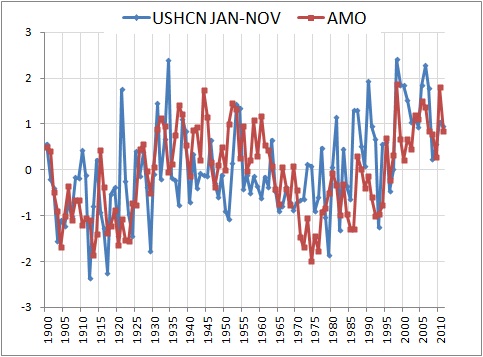
Above is how the AMO tracks with US temperatures since 1900.
(Vukcevic 2011).Global importance of the AMO is underlined by the recent Berkeley Earth Project: We find that the strongest cross-correlation of the decadal fluctuations in (global) land surface temperature is not with ENSO but with the AMO
The Pearson coefficient R = 0.458 for the AMO alone, the highest of any single factor.
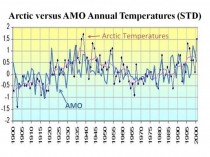
The arctic temperatures corrrelate very well with the AMO. Warm Atlantic temperatures move into the arctic and thin the ice from the bottom. It IS NOT CO2. This happened before as can be seen clearly here, related to AMO. Anecdotal data suggests a similar warming and ice thinning in the 1800s warm AMO period.
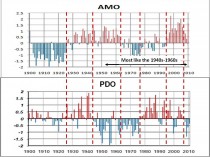
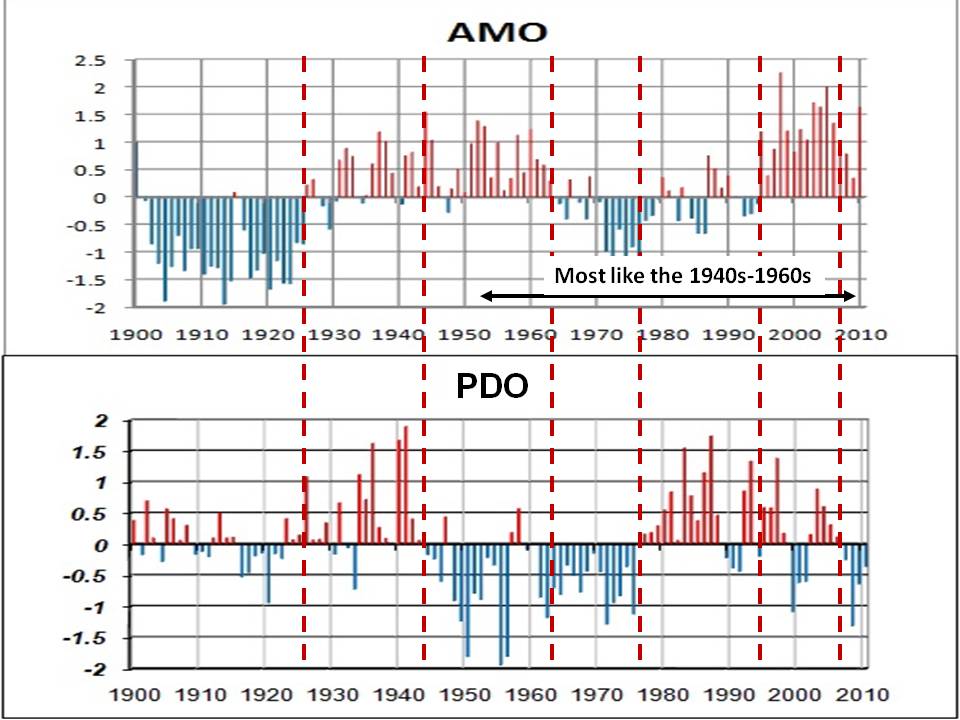
In general you can explain global temperature changes with the PDO (warming from 1977 to 1998) and AMO (warm after 1995) and volcanism. Note little change in tropics and Southern Hemisphere which suggests warming is not global.
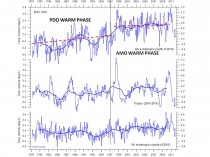
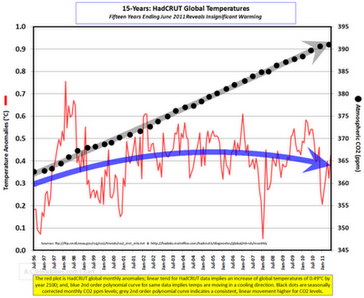
While temperatures flatlined or fell, CO2 rose the last 15 years.

1.jpg)
Industry analysts say the $5 billion of taxpayer funds President Barack Obama put into a green car initiative was a risk that is not yielding predicted results.
During his 2008 campaign, Obama predicted green cars would create thousands of jobs in the United States as demand soared, but that has yet to happen, The Washington Post reported. Since then, about $5 billion has been put into the electric car industry, offering incentives to manufacturers, their suppliers and car buyers.
However, in recent months, the demand for green cars has dropped, forcing companies that manufacture them to scale back.
A123 Systems, a battery maker that received $380 million in government aid to create 3,000 jobs in Michigan, recently announced declining orders had forced the company to lay off many employees. Battery maker EnerDel, which received a $118 million federal grant, declared bankruptcy this year.
“Many in this industry have jumped the gun on how aggressive the growth of electric vehicles will be,” said Kevin C. See, an analyst at Lux Research.
Even with as much as $7,500 in stimulus tax credits for buyers, electric cars are far more expensive than their gas driven counter parts. Navistar, which received a $2.4 billion grant from the government to make electric trucks has reportedly only sold 100 trucks.
Sam Eitel’s Maryland car dealership had to sell its lot of the electric trucks back to Navistar after not selling a single one.
“People are scratching their heads saying, ‘How will we pay this???” Eitel said of the trucks that cost buyers $150,000.
Supporters of Obama’s green-car initiative say the investments will be worthwhile in the long run.
“Certainly, with electric-vehicle sales, we’re not on track to meet the president’s goal,” said Brendan Bell, clean-vehicle expert at the Union of Concerned Scientists. “But ... these investments are good ones toward that goal.”
Energy secretary Chris Huhne wants all cars and vans powered entirely by renewable energy
By Giles Sheldrick
All petrol and diesel vehicles will be removed from the roads as part of a controversial “green revolution” being drawn up by the Government, it was revealed last night.
Energy secretary Chris Huhne wants all cars and vans powered entirely by renewable energy.
But the move will cost Britain’s motorists tens of millions of pounds.
‘Green’ cars are prohibitively expensive, with some such as the Toyota Prius, which emit little carbon dioxide, costing 20,000 pounds.
Mr Huhne’s bold vision is set out in his carbon plan which details how Britain could slash greenhouse gas emissions by 80 per cent in 40 years. One of the cornerstones of his radical policy is to replace the 30 million cars and vans on Britain’s roads with battery-powered vehicles that can be recharged from low-carbon sources of electricity like wind farms by 2050.
The carbon plan is a road map for a new industrial revolution
Energy secretary Chris Huhne wants all cars and vans powered entirely by renewable energy. The plan could also see 32,000 wind turbines built in the rush to meet strict green targets and power a mass electrification of the transport system and domestic heating.
Mr Huhne said: “The carbon plan is a road map for a new industrial revolution in which low-carbon electricity powers the economy and protects us from reliance on imports from volatile parts of the world.”
Motoring analyst Alexander Wells warned: “It’s not just about putting battery-powered cars on the road - you need the infrastructure to fuel, service and repair them which doesn’t fully exist yet.”
Meanwhile, last night it emerged Britain has spent 600million trying to promote green technologies in Third World countries since 2006.