The Regional Greenhouse Gas Initiative (RGGI) is a cooperative effort among eleven Eastern states to reduce carbon dioxide (CO2) emissions from power plants within each participating state.Together, the participating states have established a regional cap on CO2 emissions, which sets a limit on the emissions from regulated power plants within the RGGI states.
The Regional Greenhouse Gas Initiative (RGGI) is a cooperative effort among eleven Eastern states to reduce carbon dioxide (CO2) emissions from power plants within each participating state. Together, the participating states have established a regional cap on CO2 emissions, which sets a limit on the emissions from regulated power plants within the RGGI states. Over time, the regional cap declines, so that CO2 emissions decrease in a planned and predictable way.
Since 2005, the RGGI 10 states have reduced annual power sector emissions 50%, which is almost 50% faster than the nation as a whole, and have so far raised over $8.6 billion to invest into local communities. How Does RGGI Work? Within the RGGI states, certain power plants must acquire one RGGI CO2 allowance for every short ton of CO2 they emit. The RGGI states distribute these allowances at quarterly auctions, where they can be purchased by power plants and other entities.
Some states hold a limited number of allowances in set-aside accounts to sell at a fixed price or otherwise distribute outside of the auction process. Once an allowance is distributed, it can be held and traded, which creates a secondary market for allowances.
1. Are Modern ‘Anthropogenic’ Sea Levels Rising At An Unprecedented Rate? No.
Despite the surge in CO2 concentrations since 1900, the UN’s Intergovernmental Panel on Climate Change (IPCC) has concluded that global sea levels only rose by an average of 1.7 mm/yr during the entire 1901-2010 period, which is a rate of just 0.17 of a meter per century.
During the 1958 to 2014 period, when CO2 emissions rose dramatically, a recent analysis revealed that the rate of sea level rise slowed to between 1.3 mm/yr to 1.5 mm/yr, or just 0.14 of a meter per century.
Frederiske et al.,2018 “Anthropogenic” Global Sea Level Rise Rate (1958-2014): +0.14 of a meter per century
“For the first time, it is shown that for most basins the reconstructed sea level trend and acceleration can be explained by the sum of contributors, as well as a large part of the decadal variability. The global-mean sea level reconstruction shows a trend of 1.5 +/- 0.2 mm yr−1 over 1958-2014, compared to 1.3 +/- 0.1 mm yr-1 for the sum of contributors.”
2. ~15,000 - 11,000 Years Ago, Sea Levels Rose At Rates Of +4 to +6 Meters Per Century
In the past few thousand years, sea levels in some regions rose and fell at rates of + or - 0.5 to 1.1 meters per century. Sea levels during the Medieval Warm Period were+170 centimeters higher than today.
Hansen et al., 2016 Denmark, +1.7 meters higher than present during the Medieval Warm Period
“Continuous record of Holocene sea-level changes ... (4900 years BP to present). ... The curve reveals eight centennial sea-level oscillations of 0.5-1.1 m superimposed on the general trend of the RSL [relative sea level] curve [relative sea levels ~1.7 m higher than present from 1400 to 1000 years ago].”
Cronin et al., 2017 Global Sea Level Rise Rate: +4 meters per century (14,500 to 14,000 years ago)
“Rates and patterns of global sea level rise (SLR) following the last glacial maximum (LGM) are known from radiometric ages on coral reefs from Barbados, Tahiti, New Guinea, and the Indian Ocean, as well as sediment records from the Sunda Shelf and elsewhere. ... Lambeck et al. (2014) estimate mean global rates during the main deglaciation phase of 16.5 to 8.2 kiloannum (ka) [16,500 to 8,200 years ago] at 12 mm yr−1 [+1.2 meters per century] with more rapid SLR [sea level rise] rates (∼ 40 mm yr−1) [+4 meters per century] during meltwater pulse 14.5-14.0 ka [14,500 to 14,000 years ago].”
Abdul et al., 2017 Global Sea Level Rise Rate: +4 meters per century(11,450 to 11,100 years ago)
“We find that sea level tracked the climate oscillations remarkably well. Sea-level rise was fast in the early Allerod (25 mm yr-1), but decreased smoothly into the Younger Dryas (7 mm yr-1) when the rate plateaued to <4 mm yr-1 here termed a sea-level "slow stand". No evidence was found indicating a jump in sea level at the beginning of the Younger Dryas as proposed by some researchers. Following the "slow-stand", the rate of sea-level rise accelerated rapidly, producing the 14 +/- 2 m sea-level jump known as MWP-1B; occurred between 11.45 and 11.1 kyr BP with peak sea-level rise reaching 40 mm yr-1 [+4 meters per century]."
Ivanovic et al., 2017 Northern Hemisphere Sea Level Rise Rate: +3.5 to +6.5 meters per century (~14,500 years ago)
"During the Last Glacial Maximum 26-19 thousand years ago (ka), a vast ice sheet stretched over North America [Clark et al., 2009]. In subsequent millennia, as the climate warmed and this ice sheet decayed, large volumes of meltwater flooded to the oceans [Tarasov and Peltier, 2006; Wickert, 2016]. This period, known as the "last deglaciation," included episodes of abrupt climate change, such as the Bolling warming [~14.7-14.5 ka], when Northern Hemisphere temperatures increased by 4-5C in just a few decades [Lea et al., 2003; Buizert et al., 2014], coinciding with a 12-22 m sea level rise in less than 340 years [3.5 to 6.5 meters per century] (Meltwater Pulse 1a (MWP1a)) [Deschamps et al., 2012]."
Zecchin et al., 2015 Regional Sea Level Rise Rate: +6 meters per century(14,500-11,500 years ago)
"[M]elt-water pulses have punctuated the post-glacial relative sea-level rise with rates up to 60 mm/yr. [6 meters per century] for a few centuries."
3. Over 70 Papers Affirm Sea Levels Were 2+ Meters Higher Than Now A Few Thousand Years Ago When CO2 Levels Were 'Safe'.
70+ Papers: Sea Levels 2+ m Higher 9,000-4,000 Years Ago While CO2 Levels Were 'Safe' (265 ppm) More Here
Before the advent of the industrial revolution in the late 18th to early 19th centuries, carbon dioxide (CO2) concentrations hovered between 260 to 280 parts per million (ppm).
Within the last century, atmospheric CO2 concentrations have risen dramatically. Just recently they eclipsed 400 ppm.
Scientists like Dr. James Hansen have concluded that pre-industrial CO2 levels were climatically ideal. Though less optimal, atmospheric CO2 concentrations up to 350 ppm have been characterized as climatically “safe”.
However, CO2 concentrations above 350 ppm are thought to be dangerous to the Earth system. It is believed that such “high” concentrations could lead to rapid warming, glacier and ice sheet melt, and a harrowing sea level rise of 10 feet within 50 years.
To reach those catastrophic levels (10 feet within 50 years) predicted by proponents of sea level rise alarmism, the current “anthropogenic” change rate of +0.14 of a centimeter per year (since 1958) will need immediately explode into +6.1 centimeters per year.
The likelihood of this happening is remote, especially considering Greenland and Antarctica combined only contributed a grand total of 1.54 cm since 1958 (Frederiske et al., 2018).
It is becoming more and more apparent that sea levels rise and fall without any obvious connection to CO2 concentrations.
And if an anthropogenic signal cannot be conspicuously connected to sea level rise (as scientists have noted), then the greatest perceived existential threat promulgated by advocates of dangerous man-made global warming will no longer be regarded as even worth considering.
President Trump has long been a supporter of traditional energy. During his campaign, he spoke negatively about electric vehicles, wind, and other renewable energy sources. But in his first day in office, the new president began a historic shift in US energy policy, away from green energy and back to hydrocarbon energy.
On January 20, 2025, President Trump signed five wide-ranging executive orders that radically change United States energy and climate policy. These actions restore efforts to promote coal, natural gas, oil, hydropower, nuclear, and biofuels, while curtailing support for wind and electric vehicles. The Trump executive orders also rescinded orders issued by President Biden and closed federal departments established to promote climate change policies and green energy.
The executive order regarding “offshore wind” and “wind projects” immediately impacted the world wind industry. The US government owns all land from three miles to 200 miles offshore, so wind companies require a federal lease to build offshore systems. The order withdrew “all areas within the Offshore Continental Shelf” from wind leasing. The order also requires that the new Secretary of the Interior, Doug Burgum, “conduct a comprehensive review” to determine the necessity for “terminating or amending any existing wind energy leases” and to submit a report to the President. The order also put a hold on the Lava Ridge Wind Project in Idaho, pending a review by the Secretary of the Interior, a project which was approved by the Biden Administration in December.
Wind energy markets were shocked by Trump’s order. The stock price of Orsted, a Danish wind system supplier, dropped 17% to its lowest price in seven years. Orsted proposed to build Sunrise Wind, the largest planned US offshore wind system, to be located southeast of New York City. The company immediately took a $1.69 billion impairment charge on US wind projects.
Wind suppliers RWE of Germany, Equinor of Norway, Renovaveis of Portugal, and Vestas of Denmark also suffered stock price declines. Italy’s Prysmian announced that it would abandon a plan to build a plant in the US to make cables for offshore wind systems.
Wind energy plans for several states have been crippled. California planned to install 25 gigawatts of offshore wind energy by 2045, with initial projects at Morro Bay and Humbolt Bay, but these plans are on hold for at least the next four years. Maryland, Massachusetts, New Jersey, New York, North Carolina, South Carolina, Rhode Island, and Virginia are constructing or planning east coast offshore systems, but these programs will be reviewed, limited, or halted if not yet started.
The “Unleashing American Energy (UAE)” executive order calls for elimination of the “electric vehicle (EV) mandate” to promote consumer choice and access to gasoline-powered automobiles. It’s true that we have no formal EV mandate, but 22 states have zero-emissions vehicle laws or executive orders prohibiting sales of gasoline cars by a future date, typically 2035. On March 20 of last year, the Environmental Protection Agency (EPA) issued updated emissions standards that would force auto manufacturers to sell an increasing number of EVs, rising from about 8% last year to about 56% of new light vehicle purchases by 2032.
A map of the united states with green and white states
The Trump orders also call for termination of state emissions waivers “that function to limit sales of gasoline powered automobiles.” The 1970 Clean Air Act established the federal government as responsible for regulating pollution, except where a waiver is granted by the EPA to a state. For years, California has set emissions standards, receiving EPA waivers to do so, with other states following California’s lead. The orders seek to terminate these waivers to California and restore emissions control to the EPA. Earlier this month, California withdrew their request for a waiver for regulations to electrify heavy trucks and locomotives because it appeared that Trump’s EPA would not grant that request.
The order also calls for the “elimination of unfair subsidies and other ill-conceived government-imposed market distortions that favor EVs.” This probably refers to coming efforts to eliminate the $7500 tax credit on new EV sales and also efforts to eliminate the Corporate Average Fuel Economy standards issued by the Department of Transportation, which force auto manufacturers to sell a larger share of EVs.
The US economy today includes several green energy industries which probably would not exist without the vast array of federal and state subsidies and tax credits. Wind, solar, EV charging, carbon dioxide (CO2) capture, and green hydrogen receive a limitless stream of subsidies and tax credits from the Inflation Reduction Act (IRA) and the Infrastructure Investment and Jobs Act (IIJA), both of which were passed during the Biden Presidency. The CATO institute estimates that renewable energy will receive about $80 billion in federal funds during fiscal year 2025.
During his campaign, Mr. Trump vowed to eliminate the money flow from these two acts, and his first-day executive orders reflect this. The UAE order calls for “termination of the Green New Deal,” and a halt to the disbursement of funds from the IRA and IIJA. President Trump will probably need to pass Congressional legislation to permanently reduce the flow of IRA and IIJA funds.
Wind and solar systems are intermittent, use 100 times the land area, and require at least double the transmission infrastructure compared to traditional coal, gas, or nuclear power plants. Few utilities would build wind and solar systems if not for the fear of human-caused global warming. But the new executive orders make it clear that the US will no longer pursue efforts to “mitigate” climate change.
In the executive order titled “Putting America First in International Environmental Agreements,” the President directs the US Ambassador to the United Nations, nominee Elise Stefanik, to notify the UN in writing that the US withdraws from the Paris Climate Agreement, effective immediately. The order also states that the US will immediately cease financial payments under the Framework Convention on Climate Change.
The orders direct executive branch officials to cancel at least five Biden executive orders on climate change, and to disband the Climate Change Support Office, the American Climate Corps, and The Working Group on the Social Cost of Greenhouse Gases. The orders also call for the EPA to review the 2009 Endangerment Finding for “continuing applicability.” That finding concluded that carbon dioxide endangered US citizens and is the basis for regulating CO2 emissions in the US.
The Trump actions also seek to boost the development of hydrocarbon energy in the spirit of “drill, baby, drill.} Key actions include re-opening the licensing of liquified natural gas terminals, opening federal lands for onshore and offshore oil and gas production, reopening Alaska lands for energy production, and reducing efficiency regulations on dishwashers, stoves, and furnaces. The President also declared a national energy emergency to speed the deployment of pipelines and other energy infrastructure. The Trump EPA and Department of Energy will roll back regulations on oil and gas to expand US production.
Trump’s executive order bomb, followed by Congressional action to limit funds from the IRA and IIJA, promises to gut, or profoundly reshape, the US green energy movement. January 2025 may begin a long decline for green energy and a return to sensible energy policy.
Steve Goreham is a speaker on energy, the environment, and public policy and author of the bestselling book Green Breakdown: The Coming Renewable Energy Failure.
The official site for annual CO2 is Mauna Loa. The station at 11,300 feet high (3,444 meters), has a 131-foot (40-meter) tower that collects air to measure levels of carbon dioxide.
In 1958, Charles Keeling choose to install an atmospheric carbon dioxide monitoring system on Mauna Loa, a volcanic peak on the Big Island of Hawaii as the remote location would allow only carbon dioxide that had mixed with the atmosphere to be measured.
The latest annual numbers are around 420 which averages 0.04% of the air. Levels are lowest during July as vegetation is using it in photosynthesis and releasing O2.
It varies greatly where we actually live because when we breathe in the air with just 0.04% (420) ppm CO2), when we breathe out, we release 42,000 ppm. CO2 levels are much higher in populated areas and especially when people congregate (churches, schools, restaurants. even you home when the family and pets are there).
ITS NOT POLLUTION
HOME AND OFFICE AND SCHOOLS
Levels exceeding 2000 ppm are found in small offices and Ken. C., a science teacher writes, “In one classroom of 30 students after lunch reached CO2 levels of 4,825 ppm with the door closed. According to ASHRAE, the effects of poor indoor air quality in classrooms has been known for years. Chronic illnesses, reduced cognitive abilities, sleepiness, and increased absenteeism have all been attributed to poor IAQ. There is no direct harm from CO2, the claim is that it reduces oxygen levels.
CARS, TRAINS AND PLANES AND SUBMARINES
Studies found carbon dioxide levels rise to over 3,000 ppm in 30 minutes in an enclosed automobile with a single passenger. In airplane cabins it may rise to 1700 ppm. The alarmists are more interested in the emission from the planes into the atmosphere and want those that fly (and drive or ride the rails) to be held accountable (see the proposed 50 tonnes CO2 per person as a lifetime limit here).
I have always considered myself an environmentalist and conservationist as well as a Meteorologist and Climatologist. I worked on my doctorate with an atmospheric chemistry grant.
In the post WWII boom, we had problems with air pollution from factories, coal plants, cars, inefficient home heating systems and incinerators in apartments. We had serious air quality issues with pollutants. We had problems with particulates, sulfur dioxide, carbon monoxide, nitrogen oxides, ozone and lead. The worst episodes that really drove efforts to fight pollution were from a atmospheric chemical reactions - cold season water droplets in fog mixed with SO2 to cause sulfuric acid mist. Smog events in Donora PA 1948 led to 6,000 of the 14,000 population to experienced damaged lungs, and the Great London 4 day 1952 Smog Event produced between 10-12,000 deaths.
We set standards that had to be met by industry and automakers. After my BS and MS work at Wisconsin in Meteorology, I received a grant to study Air Resources/Pollution at NYU while I worked 7 days a week producing the weather fro WCBS TV and radio and the National Network on the Special series on Energy. Many of my colleagues took jobs dealing with air quality at the EPA and elsewhere, After the work we all did there and at many schools on pollution, we have the cleanest air in my lifetime and here in the U.S. in the world today.
Notice CO2 was not on the list. CO2 is a trace gas (.04% of our atmosphere). It is NOT a pollutant but a beneficial gas. CO2 is essential for photosynthesis. CO2 enriched plants are more vigorous and have lower water needs, are more drought resistant. Ideal CO2 levels for crops would be 3 to 4 times higher. They pump CO2 into greenhouses!
The climate models used to predict the impacts of increasing CO2 deliver warming over 2 times that observed by our NOAA orbiting satellite measurements of the air above the boundary layer where the greatest changes occur diurnally.
The apparent weak correlation to temperatures may be mostly the timing of the natural cycles. Longer term warming correlates with CO2 increases only 40% of the time.
CONCLUSION: CO2 IS NOT POLLUTION BUT A VALUABLE PART OF LIFE ON OUR PLANET
I have 2 CO2 monitors - I bought one - actually using Amazon credits and it arrived the next morning. One high quality model was donated to me to use by the CO2 coalition. I found with my daughter and 2 small dogs in the room, levels rise to over 800. At a football gathering of 8, it rose from 420 to near 1700 ppm. Had our team been doing better, we may have had a gathering with twice a many people and CO2 levels would have been well over 2000. I used and talked about our findings at a church organized meeting.
Many people confuse/conflate CO2 with the potentially deadly CO. That included a decade ago the chair of NH Science and Energy committee when I was one of the testifiers. She said she was taught CO2 was a health hazard (confusing with CO).
I found the story can influence people with open minds. If the CO2 is seen to be locally much higher where people congregate, I am a bit afraid the radical movement and would take that fact on as another cause and try to enforce extreme measures (limiting driving, flying, congregating in large events), to pretend it will keep levels low and it becomes another costly program with much more harm than benefit as their assault on fossil fuel energy usage and the whole COVID episode has been the last 4 years.
-------------
From the CO2 Coalition
According to Patrick Moore, chairman and chief scientist of Ecosense Environmental and co-founder of Greenpeace, the climate change messaging isn’t based in fact.
“The whole thing is a total scam,” said Mr. Moore. “There is actually no scientific evidence that CO2 is responsible for climate change over the eons.”
Mr. Moore said that over the past few decades, the climate message has continually changed; first, it was global cooling, then global warming, then climate change, and now it’s disastrous weather.
This is from Epoch Times and pay walled. Here is a pdf of the article.
------------
I over the years gave many talks on climate - see a recent 50 minute story on local cable.
Here is a much needed compilation from highest level scientists willing to tell the real story. New documentary, “Climate: The Movie” (2024), features Dr. Willie Soon from CERES.
A new documentary on climate change by Martin Durkin, “Climate: The Movie”, was posted online today (March 21st, 2024). The film presents a different perspective on climate change from the standard narratives promoted by the UN’s Intergovernmental Panel on Climate Change (IPCC).
Dr. Willie Soon, CERES co-team leader, was interviewed for this documentary, along with many other scientists and commentators. The 19th century philosopher, John Stuart Mill, noted in 1859 that “he who knows only his own side of the case knows little of that”. This documentary presents a different “side of the case” on climate change, and we think it is definitely worth watching and sharing with anybody who wants to hear different perspectives.
See and share this documentary below.
--------
Three projects I have worked on for the last 2 years have been completed. Together with my regular daily reports on Weatherbell with Joe Bastardi and other superstars, it limited my time on Icecap. I also struggled with the loss of my dear wife Emily, my lifelong companion. I will return to more regular posting and updating the important Alarmist Claim rebuttal work. I appreciate your donations to support the site. SInce our inception, we have had an amazing 271,599,998 views. Thank you!
Sep 12, 2024
The Next Big Climate Scare: Counting Climate Change Deaths
The next big climate scare is on the way. Advocates of measures to control the climate now propose that we begin counting deaths from climate change. They appear to believe that if people see a daily announcement of climate deaths, they will be more inclined to accept climate change policies. But it’s not even clear that the current gentle rise in global temperatures is causing more people to die.
In December, former Secretary of State Hillary Clinton spoke at COP28, the 28th United Nations Climate Conference, and mentioned climate-related deaths.
“We are seeing and beginning to pay attention and to count and record the deaths that are related to climate,” she said. “And by far the biggest killer is extreme heat.”
---------
See the CO2 coalition video using the actual facts to clearly show the fallacy of this alarmist media and psuedoscientist claims that Steve discusses here:
------------
According to Ms. Clinton, Europe recorded 61,000 deaths from extreme heat in 2023, and she estimated that about 500,000 people died from heat across the world last year.
Global temperatures have been gently rising for the last 300 years. Temperature metrics from NASA, NOAA, and the Climate Research Unit at the University of East Anglia in the United Kingdom estimate that Earth’s surface temperatures have risen a little more than one degree Celsius, or about two degrees Fahrenheit, over the last 140 years. But are these warmer temperatures harmful to people?
According to the Centers for Disease Control and Prevention, most cases of influenza occur during December to March, the cold months in the United States. Influenza season in the southern hemisphere takes place during the cold months there, April through September. The peak months for COVID-19 infections tended to be the cold periods of the year. More people usually get sick during cold months than in warm months.
More people also die during winter months than summer months, according to many peer-reviewed studies. For example, Dr. Matthew Falagas of the Alfa Institute of Medical Sciences and five other researchers studied seasonal mortality in 11 nations. The research showed that the average number of deaths peaked in the coldest months of the year in all of them.
Enlarged: A graph showing the number of countries/regions in the winter
The late Dr. William Keating studied temperature-related deaths in six European countries for people aged 65 to 74. He concluded that deaths related to cold temperatures were nine times greater than those related to hot temperatures. Dr. Bjorn Lomborg, president of the Copenhagen Consensus Center, has pointed out that moderate global warming will likely reduce human mortality.
Yet, on January 30, Dr. Colin J. Carlson of Georgetown University published a paper in Nature Medicine titled, “After millions of preventable deaths, climate change must be treated like a health emergency.” Carlson claims that climate change has caused about 166,000 deaths per year since the year 2000, or almost four million cumulative deaths.
Carlson admits that most of these deaths have been due to malaria in sub-Saharan Africa, or malnutrition and diarrheal diseases in south Asia. But he goes on to claim that deaths due to natural disasters and even cardiovascular disease should also be attributed to climate change. If death from cardiovascular disease can be counted as a climate death, almost any death can be counted.
The evidence doesn’t support these climate death claims. Malarial disease has plagued humanity throughout history, even when temperatures were colder than today. Dr. Paul Reiter, medical entomologist at the Pasteur Institute in Paris, points out that malaria was endemic to England 400 years ago during the colder climate of the Little Ice Age. The Soviet Union experienced an estimated 13 million cases of malaria during the 1920s, with 30,000 cases occurring in Archangel, a city located close to the frozen Arctic Circle.
Malnutrition has been declining during the gentle warming of the last century. During the early 1900s, as many as 10 million people would die from famine each decade globally. Today, world famine deaths have been reduced to under 500,000 people per decade. About 10% of the world’s people are malnourished today, but this is down from about 25% in 1970.
The number of deaths from natural disasters has also been falling during the warming over the last century. According to EM-DAT, the International Disaster Database, the deaths from disasters, including storms, famines, earthquakes, droughts, and floods, are down more than 90 percent over the last 100 years.
With deaths from natural disasters and famine declining, and since fewer people die in warmer temperatures, the case for counting deaths from global warming is poor at best. But don’t underestimate the ability of climate alarmists to create fear by exaggerating the data.
Steve Goreham is a speaker on energy, the environment, and public policy and the author of the new bestselling book Green Breakdown: The Coming Renewable Energy Failure.
------------------
Icecap Note: Any warming not related to ocean, solar cycles or volcanism is driven by urbanization. NCEI has a data set(s) that are protected from the urban warming contamination by better instrumentation and especially better siting.
US surface temperature trend when corrected for UHI
In the very first US operational data set in the late 1980s, adjustments were built in to correct for urbanization in the national network in growing cities and 70% of the network stations that were airport. In the following versions the original adjustment algorithms were removed and a data trace that better mapped the AGW claims of man made CO2 warming. Fortunately NOAA with a push from Dr. John Christy, set up a network of carefully sited stations as he used in Alabama where he was the state climatologist. NOAA never discusses this data gem but makes the data available monthly if you can find it on their site. See even with the warming globally that may be driven in part the last few years by TONGA (see) and also on WUWT, the warming trend is minimal.
May 2024 | 1.21F (0.67C)
US Climate Reference Network (data updated 10-15th of month)
Click for description of the data/larger graph
The US Climate Reference Network record from 2005 shows no obvious warming during this period. The graph above is created monthly by NOAA.
The graph shows the Average Surface Temperature Anomaly for the contiguous United States since 2005. The data comes from the U.S. Climate Reference Network (USCRN) which is a properly sited (away from human influences and infrastructure) and state-of-the-art weather network consisting of 114 stations in the USA.
These station locations were chosen to avoid warm biases from Urban Heat Islands (UHI) effects as well as microsite effects as documented in the 2022 report Corrupted Climate Stations: The Official U.S. Surface Temperature Record Remains Fatally Flawed. Unfortunately, NOAA never reports this data in their monthly or yearly “state of the climate report.” And, mainstream media either is entirely unaware of the existence of this data set or has chosen not to report on this U.S. temperature record.
The national USCRN data, updated monthly as shown in the above graph can be viewed here and clicking on ClimDiv to remove that data display in the graph here.
---------
See a history of weather data changes and manipulations over time here.
They ignore the actual heat records. The 1930s were clearly the hottest years for all-time state record highs. There have been more record lows than all time highs since then.
On December 11, 2023, the Supreme Court refused to examine the numerous science-based arguments contained in a Petition for Reconsideration of EPA’s 2009 Greenhouse Gas (GHG) Endangerment Finding. (See)
This court ignored the eight quite specific, but easy to understand scientific arguments contained in the Petition and simply denied the Petition claiming the petitioners did not have Standing - a well-known tactic to avoid decisions in a highly politically-charged situation.
Unfortunately, this Supreme Court decision denied scrutiny to the one regulation in the U.S. that is not only the single most economically significant, but also the single most scientifically flawed, of all of the regulations on the Federal books.The ramifications of this Supreme Court Denial will be enormous if an EPA GHG Endangerment Finding Reconsideration is not initiated very quickly. This fact should have been clear to the Court by the arguments quoted verbatim below:
“In short, based on the sum total of the eight validated arguments {contained in the Petition}, the currently contemplated Social Cost of Carbon (SCC) estimates are not only worthless; they are extremely dangerous to put forward to current U.S. energy, economic and national security-related policymakers as credible input to their analyses.
As clearly demonstrated by this body of research findings, climate alarmism has no basis in science. This alarmism is all driven and supported by fabricated temperature data as well as mathematical climate modeling and analytical incompetence. Motives of key scientists and other key players will be left to others to sort out.
Based on the easily reproducible, peer-reviewed and published research cited herein, climate science now finds that there is no mathematically valid proof that past increases in atmospheric GHG concentrations have caused the officially reported global warming over the last 50 years or so. Therefore, there is no proof of any social costs related to such GHG emissions. In fact, these GHG emissions are beneficial to society no matter what processes by which they might occur. Typically, if the efficiency of the particular process involved can be improved, such GHG emissions will automatically be reduced through action by a competitive marketplace. If not, there is no cost to society in any case.
Finally, on-going fact checks of the 13 most common climate alarmist claims have consistently validated that absolutely nothing unusual is going on with the Earth’s climate system. Moreover, in the considerable research cited, changes in the Earth’s temperature have been shown to be readily explained by natural factors involving changes in solar, volcanic and oceanic/atmospheric activity.
These findings strongly suggest that America and its allies have already made extremely severe climate policy errors, the negative impacts of which will only grow exponentially. By taking these erroneous climate and energy policy actions, America is rapidly destroying its energy security to the detriment of its economic and national security but to the great benefit of all three of its major enemies: China, Russia and Iran.
This must stop immediately and America must now reverse course quickly - taking the following actions:
* All efforts by state and federal governments to subsidize in any way the use of any renewable energy sources must be immediately terminated.
* All current state and federal as well as private (e.g., financial) sector efforts to inhibit the finding, production and use of all fossil fuels must be immediately terminated.
* All U.S. government action and funding at all levels to take steps to regulate the emissions of all GHGs must be immediately terminated - since they are all beneficial gases. Regulation of Criteria Pollutants under the CAA has been very successful and must be continued.
* This new information on climate science must be widely publicized via every possible credible channel targeting today’s relevant audiences, including: key federal and state leadership, financial, fossil fuel and auto sector leadership as well as key media outlets.
The utter lunacy of America’s Federal Government leadership continuing to take the unsuspecting American people on this ride over a cliff would certainly seem to be outrageous behavior on the part of those who know, or should know, the facts. Many of these key facts, e.g., the Global Average Surface Temperature data fabrication, have been provided to high level officials years ago without result. For the sake of all Americans, we pray that recipients of this transmission will behave differently.”
AUTHOR COMMENTS
All research by the authors of this document cited herein was peer-reviewed, published and purposely set up so as to be easily reproducible. No rebuttals have been received by the lead author from any person or entity. The research effort, that began in 2009, is all still being carried out on a pro bono basis. PART II provides an easy to understand, corroborated proof that EPA’s 2009 GHG Endangerment Finding is fatally flawed. Nevertheless, the Supreme Court saw fit to Totally Ignore the Science Team’s arguments provided verbatim in Appendix II denying consideration thereof based on “standing issues”.
See the full document here with the 8 validated arguments in the petition and the 13 most common climate alarmist claim fact checks as well as the list of authors and reviewers.
This document is an update of an earlier version contained in the following filings with EPA: here (see pages 17-21), and here (see pages 20-24).
A recent paper here “A Critical Assessment of Extreme Events in Trends in Times of Global Warming”, Gianluca Alimonti et al., European Physical Journal Plus, 2022 reviews recent bibliography on time series of some extreme weather events and related response indicators in order to understand whether an increase in intensity and/or frequency is detectable. “None of these response indicators show a clear positive trend of extreme events. In conclusion on the basis of observational data, the climate crisis that, according to many sources, we are experiencing today, is not evident yet.”
Also Ralph Alexander With GWPF has issued a report Extreme Weather, the IPCC’s Changing Tune. This paper compares empirical observations of extreme weather events with their coverage in the 2021 Sixth Assessment Report (AR6) of the Intergovernmental Panel on Climate Change (IPCC). The conclusions of AR6 are contrasted with observational data described in recent research papers and reports, particularly in relation to droughts, tropical cyclones, heatwaves (including marine heat waves) and cold extremes. The paper also covers major floods, tornadoes, wildfires and coral bleaching, with a short update of the discussion of disaster risk analysis.
---------------
Below are a series of fact checks of the 13 most common climate claims such as those made in the recently released Fourth National Climate Assessment Report. The contributors of these reviews are all recognized experts in the relevant fields. For each claim, a brief summary of the relevant rebuttal is provided along with a link to the full text and graphical support of the rebuttal and the names and the credentials of the authors for each rebuttal.
Claim: The globe has experienced among the warmest ever month or year in the entire record back to the 1800s. This claim is recurrent - often monthly.
Fact Check: These claims are totally unsupported by any credible analysis of raw global surface temperature data and its availability. Moreover, this Global Average Surface Temperature Data invalidation alone, invalidates the EPA 2009 GHG/CO2 Endangerment Finding as well as the subsequent EPA Findings’ claimed link between rising atmospheric CO2 concentrations and the other Climate Alarmist claims - which are also independently invalidated below by relevant empirical data. Thus, all such climate alarmist claims are in reality just politically driven fictions. See details here. See a Timeline of Surface Data versions here See this video from Tony Heller showing how much of the data in data void areas is created so as to provide the politically correct warming here. See also this analysis.
See Bombshell report: 96% of U.S. Climate data is Corrupted:
Satellite data for the lower troposphere shows a fraction of the warming of the surface stations. The greenhouse theory say the heating should be greater in the tropical atmosphere where greenhouse gases are theorized to be trapping the heat (tropical hot spot).
Claim: Heat Waves are more frequent and extreme. Heat waves kill people and greenhouse gases are to blame.
Fact Check: Heat waves like cold waves are a normal part of our global climate. Heat Waves have been decreasing since the 1930s in the U.S. and globally. See details here. See a summary of summer sizzle in 2022 here. See Dr. Cliff Mass’s excellent 2021 post “Flawed Heatwave Report Leads to False Headlines in Major Media Blogpost. “Last week we witnessed a major failure in science communication regarding the Northwest heatwave. A failure that misinformed you and millions of others, and a failure that highlighted glaring weaknesses in the media’s ability to cover important scientific issues. And it revealed the disappointing behavior of some members of the scientific community.” See full detailed analysis here. Roger Pielke Jr, tells “What the media won’t tell you about U.S. heat waves here. See this why amplified patterns, a feature of cooling climates, are behind the warm and cold extremes in 2021 and again this year here.] Cold not heat is the real threat. Cold kills up to 20 times or more than heat globally and has disastrous economic impacts. See details on why cold not heat is the main danger to humanity here. See more recent mortality studies that show a statistically significant excess mortality for cold over heat here. Latest Update here
Fact Check as of: 04/05/25
----------
Claim: Hurricanes have been increasing in number and/or extremity.
Fact Check: Even with a few very active seasons, the last decade ended was the second quietest for landfalling hurricanes and landfalling major hurricanes in the U.S since the 1850s. 2020 saw a record 30 named storms and many Gulf impacts like the late 1800s and active periods this past century, but the Accumulated Cyclone Energy Index (ACE) ranked only 13th highest in 2020. The 1860s and 1880s had the most landfalling hurricanes and major hurricanes. See a perspective on Major Hurricane Ian here. See summary through 2022 here. See this June 2021 NOAA study that though 2020 was technically a record, modern technology is likely a reason including the ability to see storms over the open oceans of the central and eastern Atlantic with satellites that would not have been seen and counted in the pre-satellite era. See 2020 season similarity to late 1800s here. See a perspective on deadly 2021 CAT4 hurricane Ida and a similarity to Camille in 1969 here. See the summary on 2018 here. See the story through 2023 here.
See this Daily Signal interview of David Legates about hurricanes. See the summary of 2024 and 2025 here See 2025 Update here.
Fact Check as of: 04/05/25
----------
Claim: Global warming is causing increased tornado activity
Fact Check: More active months and seasons occur when unseasonable cold spring patterns are present. Warmer cycles feature fewer big tornado seasons. The number of strong tornadoes has declined dramatically over the last half century. That will reverse as we go into the next cold phase. Even with a major, deadly outbreak and long track storm in December, 2021, the year ended in the lowest 25th percentile for tornadoes. Through October, 2022 also fell in the lower 25th percentile for tornadoes with no level EF5 major tornadoes now for the last 11 years, the longest stretch in the entire record despite better detection. A return to more active seasons would eventually occur as the earth cools with the colder Pacific and low solar. See in the full updated story how the 2022 started strong early but has quieted to below the 25th percentile here.act Check: More active months and seasons occur when unseasonable cold spring patterns are present. Warmer cycles feature fewer big tornado seasons. The number of strong tornadoes has declined dramatically over the last half century. That will reverse as we go into the next cold phase. Even with a major, deadly outbreak and long track storm in December, 2021, the year ended in the lowest 25th percentile for tornadoes. Through October, 2022 also fell in the lower 25th percentile for tornadoes with no level EF5 major tornadoes now for the last 11 years, the longest stretch in the entire record despite better detection. A return to more active seasons would eventually occur as the earth cools with the colder Pacific and low solar. See in the full updated story how the 2022 started strong early but has quieted to below the 25th percentile here See 2025 Update here.
Fact Check as of: 04/05/25
----------
Claim: Droughts and Floods are becoming more severe worldwide due to global warming.
Fact Check: Droughts and floods here has shown no statistically significant trends. Each year wet and dry areas are seen but their locations change, related to ocean warm and cold pools that drive atmospheric patterns that persist for months at a time. This year, the Atlantic and Pacific ocean configurations supported drought issues in the central which verified. See details here. See how claims that drought from climate change is causing Lake Mead water levels to plunge us wrong on both counts here. See Viv Forbes reports on La Nina floods in Australia in Floods and Droughts are Nothing New here.
Fact Check as of: 10/16/22
----------
Claim: Wildfires are increasing due to drought and increasing heat.
Fact Check: Wildfires diminished very rapidly in size and numbers after the very active 1800s. The increase in damage in recent years is due to population growth in vulnerable areas and poor forest management. See details here. See this analysis that shows how public lands are ablaze but private lands are not because they are properly managed here. See A Growing Sea of Snags: North Umpqua River Wildfires, 2002-2022 - Risks and Recommendations here. See a telling media story on the deadly Maui wildfires real causes here and more here. See Australia Wildfire story here See the story here detailing how record snows (up to 900 inches) in California and surrounding areas of the west resulted in a big drop in the areas burned.
Fact Check as of: 04/06/25
----------
Claim: Snow is decreasing as the earth warms, threatening the winter sports industry.
Fact Check: This is one claim that has been repeated for decades even as nature showed very much the opposite trend with unprecedented snows even to the big coastal cities. Every time they repeated the claim, it seems nature upped the ante more. Alarmists have eventually evolved to crediting warming with producing greater snowfall, because of increased moisture but the snow events in recent years have usually occurred in colder winters with high snow water equivalent ratios in frigid arctic air. The eastern United States as an example had 28 high impact winter snowstorms in the 10 years ending on 2019/20. No prior ten-year period since 1950 had more than 10. Winters in the last decade or so produced snow records and snowcover that lasted well into the spring. Snowcover in the Northern Hemisphere, North America and Eurasia has been increasing since the 1960s in the fall and winter but declining in the spring. However, as NOAA advised around 2000 might be the case, snowcover measurement methodology changes (automated instead man/machine) at the turn of this century may be responsible for most of the warm season differences. “Warming is not causing snow to disappear.” See a summary of snow trends here. See more including record western US mountain snows here. See the historic snows on the Gulf Coast in 2025 here
Fact Check as of: 4/05/25
----------
Sea levels are rising at an alarming rate threatening coastal cities
Fact Check: The rate of global sea level rise on average has fallen by 40% the last century. Where today, it is increasing - local factors such as land subsidence are to blame. See how sea level trends are being adjusted here. to better fit the theory. Climate Discussion Nexus’s Dr. John Robson presents the global facts here. See how between 1985 and 2015, satellite observations indicate the world’s coasts gained 13,565 km2 more land area than they had lost to the seas (Donchyts et al., 2016). See the full details here
Claim: Ice in the arctic, Greenland and Antarctic is melting at an alarming rate.
Fact Check: The polar and glacial ice varies with multidecadal cycles in ocean temperatures. Current levels are comparable to or above historical low levels. Arctic ice returned to higher levels with a very cold winter in 2019/20. Ice was highest level since 2013. See details here. See update here on the AMO, PDO ocean cycles, the Solar cycles and Arctic temperatures. See here how the South Pole had its coldest winter on record last season (with readings averaging -78F at the South Pole Vostok station!). Records began in 1957 here. Note the polar ice is this season (2021/22) is the 16th lowest on record with a nice rebound. NSIDC continues to hide data before 1979 which shows the changes are cyclical.
The alarmists jump on any yearly anomalies if they suit their theories. See the latest claims here. See the real story here and here. See the Alaskan winter temperature extremes that are characteristic of La Ninas with long brutal cold spells and warm spikes. The media ignore the extreme cold but focus on the warm days shown here. Also see the failures of the arctic’s demise in this post on “Is the Arctic Ice to Disappear?” in Human Progress here. See how the polar bears are thriving even in the warmer periods here.
See Tony Heller’s check on NYT’s Paul Krugman’s latest flawed article on the heat and Norway warmth.
See this analysis of Antarctic ice cover which has increased.
Fact Check: The vitality of global vegetation in both managed and unmanaged ecosystems is better off now than it was a hundred years ago, 50 years ago, or even a mere two-to-three decades ago thanks in part to CO2. A greening of the planet has resulted and the Sahara desert has shrunk by 8%. CO2 has reduced the vitality of plant life and reduced the water need. A greening of the planet has resulted and the Sahara desert has shrunk by 8%. CO2 has reduced the vitality of plant life and reduced the water need. See the update here. See also in Science how growing forests provide conflicting effects on the temperatures here. See Patrick Moore’s interview here.
Fact Check as of: 09/26/21
----------
Claim: Carbon pollution is a serious and growing health hazard.
Fact Check: The term “carbon pollution” is a deliberate, ambiguous, disingenuous term, designed to mislead people into thinking carbon dioxide is pollution. Thanks to the use of clean burning natural gas and other measures, the amount of particulate matter and other criteria pollutants identified by the EPA have declined over 77% and are well below the standards set. The United States had in 2020 the cleanest air in the world according to NASA and the World Health Organization (WHO). See details here. See this detailed scientific proof that Particulate Matter in Indoor/Outdoor Air Does NOT Cause Death here.. See here the real story in California where the governor is pushing efforts to shut down reliable energy sources to allegedly save lives here.
Fact Check as of: 05/09/24
----------
Claim: Rising atmospheric CO2 concentrations are causing ocean acidification, which is catastrophically harming marine life.
.
Fact Check: Ocean acidification (really only slightly reduced alkalinity) is often found to be a non-problem, or even a benefit. Numerous scientific studies have demonstrated the robustness of multiple marine plant and animal species to ocean acidification when they are properly performed under realistic experimental conditions. See more here. See also Peter Ridd’s recent finding of a New Record High Coral Cover of the Great Barrier Reef here.
Fact Check as of: 02/03/19
----------
Claim: There is a 97% Consensus of the world’s scientists that climate change is serious and man-made.
Fact Check: The claim of a 97% scientific consensus is a contrived fiction. CO2 is not a pollutant but a beneficial gas, particulate matter is. But as shown above, small and large particulate matter is not an issue. As also shown above all the claims of dangerous effects on the climate are also shown to be exaggerated or outright falsifications. See details here.
Fact Check as of: 11/22/22
----------
Each section details claim and links to a detailed scientific analysis with supporting graphics and links.
See how the global deaths related to all the extremes have declined dramatically the last century.
The challenge of distinguishing reality from fantasy
“The greatest challenge facing mankind is the challenge of distinguishing reality from fantasy, truth from propaganda”… Michael Crichton
Thursday April 6th, 2023
Why are we in such a huge hurry to dismantle what we know works for something that is very likely impossible to do?
Certainly China and India aren’t falling for the most recent UN claim that “This is our last chance” to do something to stop climate change. They are continuing to build coal fired power plants. Oh, China may give lip service to reducing carbon dioxide emissions but their actions speak much louder than their words! Weather balloons my ass!
The UN has been saying “This is our last chance” for forty years. You would think by now someone in government and the news media would realize that crying wolf when there is none should call into question the credibility of those doing so.
Whenever the UN IPCC (Intergovernmental Panel on Climate Change) comes out with another dooms day report as they recently did, it’s treated as a sacred cow. Virtually no major media outlet ever questions the motives of the people behind the curtain at the UN.
Are they completely unaware of why the IPCC was created in the late 1980s? Have they not read the words of those in charge? Are they unaware that the true goal of the UN is to destroy free markets and in doing so eliminate freedom itself?
Below is an article from February 10th, 2015 published by Investors Business Daily. It spells it out clearly what the UN is really up to.
The alarmists keep telling us their concern about global warming is all about man’s stewardship of the environment. But we know that’s not true. A United Nations official has now confirmed this.
At a news conference last week in Brussels, Christiana Figueres, executive secretary of U.N.’s Framework Convention on Climate Change, admitted that the goal of environmental activists is not to save the world from ecological calamity but to destroy capitalism.
“This is the first time in the history of mankind that we are setting ourselves the task of intentionally, within a defined period of time, to change the economic development model that has been reigning for at least 150 years, since the Industrial Revolution,” she said.
Referring to a new international treaty environmentalists hope will be adopted at the Paris climate change conference later this year, she added: “"This is probably the most difficult task we have ever given ourselves, which is to intentionally transform the economic development model for the first time in human history.”
The only economic model in the last 150 year that has ever worked at all is capitalism. The evidence is prima facie: From a feudal order that lasted a thousand years, produced zero growth and kept workdays long and lifespans short, the countries that have embraced free-market capitalism have enjoyed a system in which output has increased 70-fold, workdays have been halved and lifespans doubled.
Figueres is perhaps the perfect person for the job of transforming “the economic development model” because she’s really never seen it work. “If you look at Ms. Figueres’ Wikipedia page,” notes Cato economist Dan Mitchell: Making the world look at their right hand while they choke developed economies with their left.
Figueres has also said that even if the whole science of climate change is wrong we would still be doing the right thing. The right thing? The right thing to her and those around her is to eliminate freedom of choice and bow to the UN and its way of running the world. A one government world with no regard to what most people want, freedom.
The letter below makes a lot of good points.
Letter to the Editor from the Waterbury Republican American 4/5/23
AMERICANS ARE BEING BLINDSIDED IN THEIR CHASE OF ELECTRIC VEHICLES
In pre-industrial times, you knew who the butcher, baker, candlestick maker were. You knew where your meat and potatoes came from.
Even in the early 20th century, you knew that Henry Ford made your Model T in his factory in Dearborn, Mich. You knew the gas came from Texas.
Today, few of us consumers have a clue or even care where our meat and potatoes come from, and few folks complain about their iPhones being made in China or the stores being full of imported stuff.
The same is true of electricity. Who makes it? Where is it made? How is it made? How does it make it to the marketplace?
The vast majority of the public is unaware or doesn’t care. As long as the lights stay on and they don’t get a shut-off notice, it’s all good.
Today, the problem I see with such an uneducated public is they have less than zero understanding of the electric power industry, and they are taken in by the green crowd who are scaring us with horror stories that we must go green by 2030, or the earth will be “over the tipping point” (according to a recent United Nations press release) if we don’t give up oil.
I think electric vehicles (EVs) are OK if they are kept to 5-10% of the U.S. market; the grid could probably support that, but it is uneducated madness to expect that in 10 years vehicles must go 100% electric.
After the meltdown accident at Three Mile Island in 1979, Chernobyl in 1986, and in Fukushima, Japan in 2011, it’s not likely the U.S. public will support new zero-emission nuclear power plants. Even if we started building a network of them today, it would be decades before they could be operational, due to lengthy approvals, local opposition, lawsuits, and very expensive, lengthy construction times.
Even the very green-leaning Bill Gates has stated that nuclear power is the only system that can crank out enough power to juice up 300 million EVs in the U.S.
I highly doubt any new, massive hydroelectric power plants will ever be built. Who wants to flood a pristine valley?
Solar and wind, have proven to be unreliable for mass consumption, and not all regions receive enough wind or sunlight.
The new 350-foot deep pit mine now being dug in Nevada to unearth the lithium needed for EV batteries will only supply 5% of the U.S. market; the rest must be imported from China on - you guessed it - oil-guzzling container ships! Ask how many more ships will need to be built to transport the millions of tons of raw materials needed to build 300 million EV batteries. (And no, those ships will run on diesel fuel, not batteries or solar panels.)
Do the math. Where and how do you mine, transport, and manufacture 300 million 1000-pound batteries for the 300 million new EVs needed to replace every gas-powered car in the country? And how would you do this in the next decade?
Aren’t most of the rare metals and chemicals in each new EV battery not recyclable?
Mindless groupthink is never a good thing ... General Patton once said, “If everyone is thinking alike, someone isn’t thinking.”
I think the average American consumer had better wake up and start asking questions about not just where their meat and potatoes come from, but where their electric power comes from. Then they should ask if EVs are really that green, and if we are creating a cure worse than the alleged problem we are being sold.
Trump’s EPA has started the process to rescind the EPA’s authority to regulate CO2 and other alleged greenhouse gasses. It would remake our nation and shake a Western civilization already being pummeled by green madness. These regulations, both here and abroad, have been stalking horses for socialism and vehicles for fraud. graft, and funding left-wing actors on a scale unseen in human history.
On the international stage, the move to declare CO2 a pollutant and man its evil cause agent began in the 1970s with the first communist billionaire in the west, Maurice Strong. In 1988, Strong was instrumental in creating the United Nations Intergovernmental Panel on Climate Change (UN IPCC), an organization that had as its primary purpose proving that “human activities” were increasing CO2 and to plan reparations for poor nations caused by western polluters.
Until 2007, the US resisted the claim that CO2 was a pollutant that could be regulated to adjust the world’s climate. That year, five activist Supreme Court Justices donned white lab coats of climate scientists in Massachusetts v. EPA to hold that the Clean Air Act was written so broadly that it gave the EPA, created simply to clean up pollution, almost unlimited authority to regulate carbon dioxide, an essential, albeit minute, part of our atmosphere.
This judicial overreach mattered because even a super-majority of congressional Democrats had rejected a law that would have authorized the EPA to regulate CO2. Armed with this Supreme Court ruling, Obama’s EPA acted unilaterally in 2009 to declare CO2 a pollutant it could regulate. How’s that for spitting in the face of Art. 1, Section 1 of the Constitution, which holds that the power to legislate is vested solely in Congress?
Today, according to those steeped in the canard of global warming, we sit at the edge of climate catastrophe. The climate is warming at an unprecedented rate. Sea levels will rise to inundate the lands. Floods and hurricanes are increasing in number and severity.
Perhaps worst of all, the evil little troll, Greta Thunberg, is mad at us
That’s the narrative: We are in a climate crisis and humanity itself is in danger. The WEF tells us that the cost of failing to respond to climate change will bankrupt the world. The only solutions are to adopt socialism and transfer the wealth of the US to the UN, where it can be redistributed as a form of green reparations.
Except...all of that is hot garbage.
Climate science is little more than modern Lysenkoism. It has been subject to decades of gatekeeping in universities, grant-making entities, the UN, and science journals, all working together to suppress any challenges to “the anthropogenic climate change consensus.” All too often, “climate modeling has transformed from a scientific tool into a mechanism for manufacturing hysteria.”
The climate models used to forecast doom in the coming decades are a canard. They have uniformly and grossly overstated the actual warming trends.
The temperature records have been reworked repeatedly over the past decades to create a warming trend far in excess of the raw historic data, and which data is, itself, questionable.
Many climate studies rely on questionable peer review as ostensible proof of their reliability rather than reproducing the studies.
Notably, there has been no increase in the number or severity of weather-related disasters for decades. The actual trendline, according to Roger Pielke, Jr., is completely flat.
[T]he completely false notion that global weather and climate disasters have increased and will continue to increase is commonly reported in the legacy media, buoyed by the promotion of false information by organizations that include the United Nations. In 2020 the U.N. claimed falsely of a “staggering rise in climate-related disasters over the last twenty years.”
Yet despite all of the above - much of it known for well over a decade - the climate change juggernaut has ignored it all and rolled on. The twin benefits to those pushing this canard are increased government power and access to almost limitless wealth.
By Joseph DAleo, CCM Co-Chief Meteorologist Weatherbell Analytics, LLC
Climate alarmists have consistently said we could look forward to more frequent and stronger hurricanes, thanks to climate change. Our climate is always changing but the changes are driven by natural cycles. Ocean temperature events like El Nino and La Nina and longer-term cycles like the Pacific Decadal Oscillation (PDO) and Atlantic Multidecadal Oscillation (AMO) determine where hurricanes are most likely to occur and how strong and damaging they may become.
In 2023, in the Pacific, a strong El Nino developed in the eastern Pacific after a 3 year stubborn La Nina, favoring more and stronger storms in the Pacific. Meanwhile, a record warm tropical and subtropical Atlantic created a conducive environment for the continuation of overall above-normal Atlantic hurricane seasons. However, the El Nino played a role in keeping all but one Atlantic storm (Idalia) out at sea.
A great example of the roles of the oceans has been observed the last half century. When the Atlantic was cold in the 1960s to early 1990s (negative AMO or Atlantic Multidecadal Oscillation) Atlantic storms were much less frequent and landfalls mostly limited to the Gulf Coast. When the Atlantic swung into its multi-decadal warm mode in the late 1990s, the activity in the Atlantic more than doubled on average.
The Atlantic temperatures spiked in 2023 as the planet readjusted after 3 years of La Nina. Some scientists believe that Hunga Tonga-Hunga Ha’apai erupted in January 2022, shot 146 metric megatons of water into the stratosphere potentially contributing to atmospheric warming according to a new study published in Nature Climate Change.
THE PACIFIC OCEAN CYCLE - EL NINOS VS LA NINAS
Activity tends to be higher in the Atlantic Basin when the Atlantic is warm and when La Ninas and the negative (cold) Pacific Decadal Oscillation (PDO) are in place in the tropical Pacific. The cold eastern Pacific waters in La Ninas reduce hurricane development in that region but do not affect Atlantic activity.
When El Ninos and the warmer Pacific Decadal Oscillation (PDO) are present, hurricanes become more likely there but the east Pacific storms produces shear in the upper atmosphere in the Atlantic that disrupts developing storms.
Gray 1984 found that of the 54 major hurricanes striking the U.S. coast between 1900 and 1983, only 4 occurred in 16 El Nino years in contrast to 50 making landfall during the 68 non El Nino years. This is a rate of 0.25 major hurricanes during El Nino and 0.74 per year in non-El Nino years, almost a 3 to 1 ratio. Tartaglione etal in 2002 showed there was a 71% greater chance of an impact on the east coast in La Nina years
When a three-year La Nina faded this spring and summer, expectations were that the warm water would generate super storms in the Pacific Basin.
Indeed Hurricane Hillary on late August became the first tropical cyclone to make landfall in California in over eight decades. Death Valley, known for being the hottest place on earth, received a year’s worth of rain in 24 hours, had its wettest day in history. Otis followed in late October intensifying a full five categories, from a tropical storm to a Category 5 hurricane - the highest level - in less than 24 hours before landfall on Mexico.
For the Atlantic, record warm ocean temperatures August to October resulted in 20 named storms, 4th highest for the U.S. but thanks to El Nino, only Hurricane Idalia made landfall with max winds of 110 kt the strongest hurricane to make landfall in the Big Bend region of Florida since 1896.
The Accumulated Cyclone Energy Index, the best measure of the seasons activity shows the active period starting in the middle 1990s with the Atlantic AMO in it’s warm mode.
The late season was characterized by sinking motion and no storm development in the Caribbean during September, often a busy time of year. Without tropical activity, drought conditions prevailed in the western Gulf States.
The El Nino was biased to the eastern Pacific during the early to mid tropical season, which kept the overall numbers down in the western Pacific region.
It should be noted that the 2023 season was characterized by unusual rapid intensification of some of the storms that impacted land as well as unusual landfall locations. Dr. Phil Klotzbach, one of the many star students of the late great Dr. Bill Gray continues his fine work at CSU. See his excellent detailed review of this unusual season here.
Record snows in California brought water levels back to near normal. That continues into 2024.
-----------
The media is promoting disinformation on the cause of the reservoir’s record-low level.
Lake Mead (Michael Vi/Shutterstock)
The water level in Lake Mead is reaching record lows and the popular narrative maintains that drought brought on by human-caused climate change is to blame. But the government’s own data from the Bureau of Reclamation shows this is not true.
Imagine a large city has been built in the middle of the Sahara Desert. Since no precipitation falls there, a large man-made reservoir is created with water piped in from a thousand miles away. The desert city grows over time, but the water supply does not. Over the years, the desert city must ration water as the reservoir is drained due to overuse. In this hypothetical situation, would it be rational to blame the water shortage on drought and global warming? No.
Yet, this is the situation we have with Lake Mead.
As can be seen in the Bureau of Reclamation’s official estimate of the yearly natural water flows into Lake Mead, there has been no long-term trend in water flow into the reservoir.
Yearly natural water flows into Lake Mead at Lees Ferry, Nevada, since 1930. The measured flows have been corrected for upstream diversions created over time to provide a best estimate of whether climate change has caused drought-induced reductions in water supply to Lake Mead. Details of those corrections are described here. Data source here.
Most of the water supplying the Colorado River at this location comes from snowmelt in the upper Colorado River watershed. The April snowpack in that region also shows no trend.
Upper Colorado River watershed snowpack as estimated each April from 1938 to 2022. Department of Agriculture data source here.
So, why is Lake Mead losing so much water? The answer is overuse. The Colorado River Basin Water Supply and Demand Study, published in 2012, showed that water demand from Lake Mead increased rapidly over the decades but remained less than water supply until around 2000, after which usage exceeded the available water supply in most years. This is what can be expected when we build cities in the desert (e.g. Las Vegas) and grow crops on arid land where there is insufficient natural precipitation.
That virtually every news story we read blames the water crisis on climate change or drought leads to widespread disinformation on the causes of falling water levels in Lake Mead. This then leads to expensive and misguided solutions to the problem. For example, on July 22, Forbes published an article titled “Why Is Lake Mead Shrinking? Climate Change Is a Major Reason.” Also in July, NASA published ”Lake Mead Keeps Dropping,” in which the agency stated the reservoir “provides a stark illustration of climate change.”
In fact, climate change does not even predict reductions in precipitation in the region that feeds water to Lake Mead.
CMIP6 climate model projections of yearly precipitation over the upper Colorado River watershed. Climate model data archived here.
Rational approaches to climate change, to the extent it exists, must be informed by accurate data. This is why Dr. John Christy and I created and continue to maintain and update a satellite-based global temperature dataset at the University of Alabama in Huntsville. That global dataset shows less global warming than scattered surface-based thermometers, which are prone to increasing spurious heat sources over time.
But in the case of Lake Mead, the datasets (such as those in the three graphs above) are not even in question. The problem is that lazy and biased reporting - even in some scientific reports - has led to the widespread misperception that climate change is responsible for Lake Mead losing water. It’s not.
Lake Mead is being drained. It’s not climate change.
Roy W. Spencer is a Ph.D. meteorologist and climate researcher at the University of Alabama in Huntsville, and was formerly an award-winning NASA Senior Scientist for Climate Studies.
Following two back-to-back hurricanes that severely pummeled the Southeastern United States, climate activists have swooped in like vultures, blaming political conservatives for the destruction wrought by Helene and Milton. At MSNBC, Chris Hayes spouts, “We have known for decades that our planet is warming and that we would start seeing the brutal effects. But conservatives remain so deep in their denial that they are flailing around for anyone or anything else to blame.”
While many attempt to falsely connect hurricanes to anthropogenic climate change, the truth is these monster storms are a natural and necessary function of our planet’s atmosphere. But that didn’t prevent CNN from posting a piece wildly declaring, “Helene was supercharged by ultra-warm water made up to 500 times more likely by global warming.”
Hurricane season in the Atlantic Ocean traditionally begins on June 1, as the equatorial waters warm to near-80 degrees Fahrenheit, the minimum temperature required for a hurricane to form. Water temperature is often considered the fuel for a hurricane because as the warm water evaporates it subsequently condenses within the storm releasing latent heat. However, there are a multitude of other factors that must be present for hurricane formation including a storm’s distance from the equator, light winds blowing into the center of the storm, high humidity values, and something we refer to as the “saturated adiabatic lapse rate” which is basically the rate at which saturated air cools with altitude. When all of these ingredients are in perfect sync, a hurricane begins to form.
Dr. Neil Frank, longtime head of the National Hurricane Center, contends the total number of hurricanes each year ebbs and flows in sixty-year cycles. On the average, each year there are ten tropical storms (wind speeds less than 74 mph) that develop over the Atlantic Ocean, Caribbean Sea, and Gulf of Mexico. Six of these storms become hurricanes (wind speeds of 74 mph or more). In an average three-year period, roughly five hurricanes strike the United States coastline, killing approximately 50 to 100 people anywhere from Texas to Maine. Of these, two are typically major hurricanes (winds greater than 110 mph).
The cover endorsement for my recent book, Climate Cult: Exposing and Defeating Their War on Life, Liberty and Property, was written by Dr. Frank. He contends there is no evidence suggesting we are seeing more hurricanes than ever (over the past 170 years of records), and he insists the frequency and intensity of hurricanes has not changed over years. Additionally, Dr. Frank reminds us that hurricanes are a beneficial component of the overall global atmosphere as they act as mechanisms which draw hot air from the earth’s equatorial regions into the jet stream which then transports the natural warmth to the colder latitudes. This allows for expansive and comfortable temperate zones, where most of us live.
But why do recent storms seem worse than ever?
The answer is threefold.
First, there is no doubt property damage, in terms of dollars, is on the rise. This trend is driven by the continued development of expensive property along the coasts putting more value at risk of wind and water damage. Also, flooding has increased due to residential and commercial properties edging right up to the water’s edge. Under these modern circumstances, any given hurricane would cause more damage than it would have in the past. Sadly, the same could be said for the number of lives lost during these storms.
Second is media coverage. Back when I was presenting the weather for both CBS-TV News and KPIX-TV in San Francisco, content producers knew severe weather gains eyeballs. Its still true on TV today.
Third, there is the ad nauseam, agenda-driven propaganda put forth by activists attempting to pin their climate fiction hoax on deadly hurricanes.
But why is Florida seemingly often in the crosshairs?
Because the “Sunshine State” is a sitting duck. It’s a 500-mile long, 160-mile-wide peninsula extending into the warm waters of the Atlantic and Gulf of Mexico with 1,146 miles of coastline and an average elevation of a mere 100-feet. Given that the average hurricane is about 300-miles-wide, the Florida peninsula is a prime target for potential disaster. As a result, during this 2024 season, of the nine hurricanes formed to date, four have hit the United States with two terribly striking Florida.
Brian Sussman is an award-winning meteorologist, former San Francisco radio talk host, and bestselling author.
I traveled to Oregon last week at the invitation of a CO2 Coalition supporter. Besides being completely off the grid at a lodge on the scenic Rogue River, I gave a presentation to about 50 people from southern Oregon after returning from the wilderness. As you can imagine, the climate zealots are in full-on crisis mode in the Beaver State. For my talk, I examined Oregon-specific temperature data. The top image shows Annual Mean Temperature that reveals about a 1-degree Fahrenheit (F) increase since 1895 which is hardly a crisis.
Interestingly, maximum temperatures were basically flat going back 125 years, while the low temperature readings had increased by 2.0 degrees F. Increasing night-time low temperatures benefits agriculture by extending growing seasons. Sleep well, Oregonians. There is no climate crisis.
So, what will the citizens of Oregon get for going to net zero? Analysis using the MAGICC simulator indicates that, had the state attained zero emissions in 2010, the warming averted in 2050 and 2100 would be 0.0007 and 0.0018 degrees Fahrenheit, respectively. These are theoretical effects that could not be measured and would make no difference.
Oregonian scientist Dr. Gordon Fulks commented.
“About ten years ago, I downloaded this chart from NOAA ‘Climate at a Glance:’”
Tony Heller responds: “The reason for the change in graphs is that NOAA is now cooling Pacific Northwest temperatures prior to 2008 between 0.5 and 1.F, and warming recent temperatures by 0 to 0.5F”
I’ve been studying Neftel, et al. (1988). CO₂ record in the Byrd ice core 50,000-5,000 years bp. Nature 331(6157), 609-611.
It’s a fine-grained record of dO-18 and ice core CO₂ across the Holocene transition. I digitized the CO₂ and dO-18 depth data from their Figure 4 and then used to conversion expressions in Hammer, et al., (1994) Electrical conductivity method (ECM) stratigraphic dating of the Byrd Station ice core, Antarctica. Annals of Glaciology 20,115-120 to convert meters to years.
A polynomial fit to each data set followed by taking first derivatives of the fits, allowed estimation of the timing of phase turnover for CO₂ and dO-18 presaging the Holocene.
The result is the attached figure. Air temperature (dO-18) rose about 1000 years before CO₂ began to rise.
Neftel, et al., themselves say, “The dO-18 record is shifted by 12m towards greater depth to compare the same age for both records. This assumes an age difference of 600 years between the ice and the mean age in the bubbles. The dO-18 ratio starts to increase between 200 and 1,200 years before the CO₂ concentration starts to increase. At the time the CO₂ starts to rise, the dO-18 ratio increase is already 20-30% of the total shift at the glacial/interglacial transition. According to these results the ?...” (my underline).
Neftel, et al., was published on 1 February 1988, 4 months before Jim Hansen’s 23 June 1988 testimony before Congress sparked the CO₂ frenzy.
So in June 1988, scientists in the field already knew that the only good hard data in hand disconfirmed the CO₂-temperature connection. And they pretended surprise when the later VOSTOK record appeared, confirming the Byrd result.
Did Jim Hansen know? Did he go ahead with his testimony knowing it had been empirically contradicted? That seems to be a very fair question, going to integrity.
------------
UPDATES:
Professor Valentina Zharkova said this about CO2:
CO2 is not a bad gas,” says Valentina Zharkova, a professor at the Northumbria University in Newcastle, UK. On the contrary, she points out, every garden centre uses it in its greenhouses to make plants lush and green. “We actually have a CO2 deficit in the world, and its three to four times less than the plants would like,” she notes, adding that the proportion of CO2 in the atmosphere has been at much higher levels throughout our planet’s history than it is now.
In fact, over the last 140 million years, the amount of CO2 in the atmosphere has been steadily decreasing and only now slightly starting to rise. It is currently around 420 parts per million (ppm), or 0.042%. 140 million years ago, it was estimated at 2,500 ppm (0.25%), or about six times higher. And it also meant a greener and more biodiverse world. If CO2 were to fall below 150 ppm (0.015%), it would already mean the extinction of vegetation and all other life. We came close to that during the last glacial maximum when it was at 182 ppm (0.018%).
Zharkova says that the fact that CO2 levels in the atmosphere are now increasing is a good thing. “We don’t need to remove CO2 because we would actually need more of it. It’s food for plants to produce oxygen for us. The people who say CO2 is bad are obviously not very well educated at university or wherever they studied. Only uneducated people can come up with such absurd talk that CO2 should be removed from the air,” says Zharkova.
------------
International Journal of Geosciences
Jacques Bourgois here wrote on The Sword of Damocles behind the Curtain of the Earth’s Global Warming: A Review
The “mainstream” climatology (MSC) i.e. which includes the Intergovernmental Panel on Climate Change (IPCC) community-considers the present day massive release of greenhouse gases into the atmosphere as the main cause of the current global warming trend. The main inference from this stance is that the increase in temperature must occur after the release of greenhouse gases originating from the anthropic activities. However, no scientific evidence has been provided for this basic notion. Earth paleoclimatic records document the antecedence of temperature over CO 2 levels. For the past 65 Ma, the temperature parameter has controlled the subsequent increase in CO 2. This includes the three rapid aberrant shifts and extreme climate transients at 55 Ma, 34 Ma, and 23 Ma.
The simple fact of their existence points to the potential for highly nonlinear responses in climate forcing. Whatever these shifts and transients are, CO 2 remains a second order parameter in their evolution through time. Confronted with the past, a suitable response must therefore be given to the unresolved question of whether the CO 2 trends precede the temperature trends in the current period, or not. The assertion that the current global warming is anthropogenic in origin implicitly presupposes a change of paradigm, with the consequence (the increase in CO 2 levels) that occurred in Earth’s past being positioned as the cause of the warming for its present day climatic evolution. The compulsory assumption regarding the antecedence of CO 2 levels over the temperature trends is associated with the haziness of the methodological framework-i.e. the paradigm-and tightens the research fields on the likely origins of global warming. The possible involvement of an “aberrant” natural event, hidden behind the massive release of greenhouse gases, has not been considered by the MSC.
----------
Oe of the real factors, ocean cycles
was shown by interns of Weatherbell.
Trump gives hope to derailment of the establishment’s plans (both parties) for a New World Order - which would cede our rights and control over our lives including a redistribution of any wealth to the UN.
Update: see the whole story behind the story in their own words in Global Warming Quotes & Climate Change Quotes: Human-Caused Global Warming Advocates/Supporters by C3 Headlines.
Quotes by H.L. Mencken, famous columnist: “The whole aim of practical politics is to keep the populace alarmed - and hence clamorous to be led to safety - by menacing it with an endless series of hobgoblins, all of them imaginary.” And, “The urge to save humanity is almost always only a false face for the urge to rule it.”
We start with Mencken’s quotes because they are so well known from the past, but yet still so relevant so many years later. His past insights to those whose lives are addicted to the seeking of power, or control, or fame, or money is still as valid today, as it was 70 years ago. Below are quotes from the powerful; the rich; the religious; the studious; the famous; the fanatics; and, the aspiring, all sharing a common theme of keeping “the populace alarmed” to further their own personal, selfish goals.
The threat to the world is not man-made global warming or climate change. The threat to the world, as is always the case, is a current group(s) of humans who want to impose their values and desires on others. The people below represent such a group, and they are not saints as individuals; in fact, quite the opposite, unfortunately.
Once you read the below quotes, come back and re-read the previous paragraph. The threat to the world is not man-made global warming or climate change. The threat to the world, as is always the case, is a current group(s) of humans who want to impose an ‘Agenda’ based on their elite values and self-importance. The people below represent such a group, and they are not saints as individuals; in fact, quite the opposite, unfortunately.
Australia PM’s adviser: climate change is UN hoax to create new world order
Maurice Newman, chairman of Tony Abbott’s business advisory council, says UN is using debunked climate change science to impose authoritarian rule.
The Australian prime minister’s chief business adviser has accused the United Nations of using debunked climate change science to lead a new world order - provocative claims made to coincide with a visit from the top UN climate negotiator.
Christiana Figueres, who heads the UN framework convention on climate change, touring Australia this week, urged the country to move away from heavily polluting coal production.
Under Tony Abbott’s leadership, Australia has been reluctant to engage in global climate change politics, unsuccessfully attempting to keep the issue off the agenda of the G20 leaders’ summit in Brisbane last year.
Maurice Newman, the chairman of Abbott’s business advisory council and a climate change sceptic with a history of making provocative statements, said the UN was using false models showing sustained temperature increases to end democracy and impose authoritarian rule.
“The real agenda is concentrated political authority,” Newman wrote in an opinion piece published in the Australian newspaper. “Global warming is the hook. It’s about a new world order under the control of the UN....
“It is opposed to capitalism and freedom and has made environmental catastrophism a household topic to achieve its objective.”
Figueres used an address in Melbourne to urge Australia to move away from coal, the country’s second-largest export, as the world grapples with global warming.
“Economic diversification will be a challenge that Australia faces,” she said.
Abbott has described coal as “good for humanity” and the “foundation of prosperity” for the foreseeable future.
Figueres also urged Australia to play a leading role at the climate summit in Paris in December, a call unlikely to be heeded given Abbott’s track record.
At the Brisbane G20 meeting, he warned that the Paris summit would fail if world leaders decided to put cutting carbon emissions ahead of economic growth.
At home, Abbott, who in 2009 said the science behind climate change was “crap”, repealed a tax on carbon pricing and abolished the independent Climate Commission advisory body.
Asked on the Canberra leg of her trip if the politics around renewable energy was as toxic elsewhere in the world, Figueres said: “No. At the global level what we see is increased participation of renewables, increased investment in renewables, increased excitement about renewables.”
Abbott’s office and the UN did not immediately respond to requests for comment.
-----------
An orchestrated movement:
Puppet masters (Government agencies, NGOs, billionaires and politicians), many who believed the world has too many people that consume too much of the world’s resources decided to move us towards one world government to control both.
They use the UN as the organization that would unify the word around their agenda using the lure of money (redistribution of wealth). They take control of the science through funding.
They take control of the universities and research labs again through funding efforts that supported their agenda, purging or silencing the faculty not tenured and making life miserable for those that were tenured who did not go along, firing lab employees who resisted. Take control of the curriculum from K-8 to college on science and social issues.
Take control of the professional societies - easy to do since most were academics riding the grant gravy train - have many work on statements endorsing their theory as fact never voted on by their members.
Take control of the major journals used by scientists, removing editors who allowed papers that challenged the tenets of the theory, ensuring at least one reviewer would be assigned to every submitted challenging paper who would reject it.
Take control of the media (easy since 95% are sympathetic to the ‘cause’. The Society of Environmental Journalists actually published a handbook on how to deal with doubters and slant their coverage. The NJOS, WH, Media Matters provide talking points to the media after official reports are issued.
They demonize skeptics - using words like climate change deniers, claim they were funded by big oil (when big oil was funding their side - BP $500M to UC Berkeley, Exxon $100M to Stanford and all told well over 1 Trillion.. They claim we don’t publish in the major journals they control, though many thousands have published real science in journals that they do not control.
Updated: Public and many to most real scientists are unconvinced.
From: Malcolm Roberts [mailto:malcolmr@conscious.com.au]
Sent: Friday, 24 April 2015 12:07 PM
To: UQ VC OFFICE
Cc: John Cook; Ove Hoegh-Guldberg; FORBES VIV; Carter Bob; Plimer Ian; Jennifer Marohasy
Subject: D15/7927: Complaint of serious corruption of science by UQ’s John Cook and Ove Hoegh-Guldberg
Dear Professor Hoj:
As an honours engineering graduate from the University of Queensland I am inquiring of you as to the reasons our university supports the work of John Cook who serially misrepresents climate and science? Specifically, why is our university wasting valuable funds to mislead the public through a free course and by producing associated international video material? Course
Please refer to the lower half of page 4 of Appendix 5, here.
It details John Cook’s fabrication of an unscientific ‘consensus’. Science is not decided by claims of consensus. Resorting to claims of consensus is unscientific and contradicts the scientific process.
Fabricating false claims of scientific consensus is not honest.
Science is decided by empirical scientific evidence. John Cook has repeatedly failed to provide any such evidence that use of hydrocarbon fuels is causing the entirely natural climate variability we experience.
A succinct summary of John Cook’s fabrication of a consensus, and of the corruption of science upon which his claims rely and that is furthered by his claims, and of the empirical scientific evidence he blatantly contradicts, are discussed in pages 6-18 of my report to federal MPs Senator Simon Birmingham and Bob Baldwin. It is available at this link.
My seven years of independent investigation have proven that there is no such empirical scientific evidence anywhere in the world. Climate alarm is unfounded and is a purely political construct pushing a political agenda. Please refer to Appendices 2, 6, 6a, 7 and 8 at this link.
John Cook’s core public climate claims are false and blatantly contradict empirical scientific evidence. Please refer to appendix 4 at the same link.
Further, John Cook and / or his employer are receiving funds in return for his deceiving the public, politicians and journalists and I’m wondering if that would make his work a serious offense.
As you likely know, John Cook works closely with the university’s Ove Hoegh-Guldberg who reportedly has many serious conflicts of financial interest surrounding his false climate claims. These are discussed on pages 54-59 of Appendix 9 at this link and briefly on pages 16 and 17 of my report to Senator Birmingham and Bob Baldwin MP.
I draw your attention to my formal complain dated Wednesday 10 November 2010 to the university senate about the work of Ove Hoegh-Guldberg misrepresenting climate and science. That was not independently investigated by then Vice Chancellor Paul Greenberg who was subsequently dismissed over another event, reportedly for a breach of ethics. My formal complaint is discussed on pages 57 and 58 of Appendix 9 at this link.
Ove Hoegh-Guldberg’s responses to my request for empirical scientific evidence of human causation of climate variability have repeatedly and always failed to provide such evidence.
This email is openly copied to both Ove Hoegh-Guldberg and John Cook and to reputable Australian scientists and academics expert on climate and to Viv Forbes an honours graduate in geology from our university. Viv Forbes understands the key facts on climate and on the corruption of climate science by beneficiaries of unfounded climate alarm perpetrated falsely by Ove Hoegh-Guldberg and John Cook.
Please stop John Cook’s misrepresentations and restore scientific integrity to our university. I please request a meeting with you to discuss our university’s role in deceiving the public and to discuss restoring scientific integrity. I would be pleased for that meeting to be in the company of John Cook and Ove Hoegh-Guldberg if that suits you.
Pages 19-26 of my report to Senator Birmingham and Bob Baldwin discuss the serious damage to our nation and to humanity and our natural environment worldwide as a result of unfounded climate alarm spread by our university’s staff. I hope that you will fulfill your responsibility for investigating and ending such corruption. To neglect to do so will mean that you condone such damage and dishonesty. I seek confidence that you will restore the university’s scientific integrity and look forward to your reply.
Yours sincerely,
Malcolm Roberts
BE (Hons) UQ, MB U Chicago, Member Beta Gamma Sigma Honours Society
The 97% “consensus” study, Cook et al. (2013) has been thoroughly refuted in scholarly peer-reviewed journals, by major news media, public policy organizations and think tanks, highly credentialed scientists and extensively in the climate blogosphere. The shoddy methodology of Cook’s study has been shown to be so fatally flawed that well known climate scientists have publicly spoken out against it,
“The ‘97% consensus’ article is poorly conceived, poorly designed and poorly executed. It obscures the complexities of the climate issue and it is a sign of the desperately poor level of public and policy debate in this country [UK] that the energy minister should cite it.”
Mike Hulme, Ph.D. Professor of Climate Change, University of East Anglia (UEA)
Only 65 Scientists of 12,000 Make up Alleged 97% on Climate Change and Global Warming Consensus According to Breakdown of Cook et al study, say Friends of Science
In response to multiple inquiries from media and global warming advocates, Friends of Science issue this release to expose the statistical manipulation evident from the break down of the Cook et al paper. Friends of Science decry the linking of this flawed study with alleged danger from man-made carbon dioxide emissions (CO2) as there has been no global warming in 16 years despite a rise in CO2 levels; Friends of Science say the sun and oceanic oscillations are the main drivers of climate change, not CO2.
The following is a list of 97 articles that refute Cook’s (poorly conceived, poorly designed and poorly executed) 97% “consensus” study. The fact that anyone continues to bring up such soundly debunked nonsense like Cook’s study is an embarrassment to science. See the list here.
----------------------
See the Galileo Movement here.Visit Then click on the blue text: “9.2.12 Evidence of Political Fraud - Malcolm Roberts”
----------
See Dr. Doug Hoyt’s Greenhouse Scorecard on Warwick Hughes site here.
-----------
From Jack Black’s Climate Change Dictionary
PEER REVIEW: The act of banding together a group of like-minded academics with a funding conflict of interest, for the purpose of squeezing out any research voices that threaten the multi-million dollar government grant gravy train.
SETTLED SCIENCE: Betrayal of the scientific method for politics or money or both.
DENIER: Anyone who suspects the truth.
CLIMATE CHANGE: What has been happening for billions of years, but should now be flogged to produce ‘panic for profit.’
NOBEL PEACE PRIZE: Leftist Nutcase Prize, unrelated to “Peace” in any meaningful way.
DATA, EVIDENCE: Unnecessary details. If anyone asks for this, see “DENIER,” above.
CLIMATE SCIENTIST: A person skilled in spouting obscure, scientific-sounding jargon that has the effect of deflecting requests for “DATA” by “DENIERS.’ Also skilled at affecting an aura of “Smartest Person in the Room” to buffalo gullible legislators and journalists.
JUNK SCIENCE: The use of invalid scientific evidence resulting in findings of causation which simply cannot be justified or understood from the standpoint of the current state of credible scientific or medical knowledge
--------
Speaking of junk science, see Lubos Motl’s excellent point by point counter to the John Cook 104 talking points document attacking the skeptical science here.
NOTE:
See all the talks at the latest ICCC9 Conference in Las Vegas in 2014 here.
Heartland has the presentations and powerpoints posted for the Heartland ICCC IV. If you could not go, there is plenty to see there. Please remember the goldmine of videos and PPTs at the Heartland ICCC proceeding sites for 2008 NYC here, 2009 NYC here and 2009 DC here. Here is a PPT I gave at the Heartland Instutute ICCC Meeting in 2008 and here is the follow up in 2009. Here is an abbreviated PPT in two parts I presented at a UK conference last month: Part 1, Part 2.
----------------------
See C3 Headlines excellent collection of graphs and charts that show AGW is nonsense here.
-----------------------
See Climate Theater with a collection of the best climate skeptic films and documentaries here. See additional scientific youtubes here.
The left loves to reference desmogblog.com when any skeptic produce an analysis or paper challenging CAGW - see the real story about this looney left green PR firm here.
“The above papers support skepticism of “man-made” global warming or the environmental or economic effects of. Addendums, comments, corrections, erratum, replies, responses and submitted papers are not included in the peer-reviewed paper count. These are included as references in defense of various papers. There are many more listings than just the 900-1000 papers. Ordering of the papers is alphabetical by title except for the Hockey Stick, Cosmic Rays and Solar sections which are chronological. This list will be updated and corrected as necessary.”
The less intelligent alarmists have written a paper allegedly connecting the scientists to Exxon Mobil. Here is the detailed response from some of the featured scientists. Note that though this continues to be a knee jerk reaction by some of the followers, there is no funding of skeptic causes by big oil BUT Exxon has funded Stanford warmists to the tune of $100 million and BP UC Berkeley to $500,000,000. Climategate emails showed CRU/Hadley soliciting oil dollars and receiving $23,000,000 in funding.
Many more papers are catalogued at Pete’s Place here.
The science and economics of global warming are not too complicated for the average person to consider and make up his or her own mind. We urge you to do that. Go here and view some of the articles linked under “What’s New” or “A Primer on Global Warming.” Or go here and read about the new report from the Nongovernmental International Panel on Climate Change (NIPCC), which comprehensively rebuts the claims of the United Nation’s Intergovernmental Panel on Climate Change (IPCC). Go here for the sources for the factual statements in the ads.
---------------
Go to and become a member of WeatherBell Analytics here.
Website of the Nongovernmental International Panel on Climate Change (NIPCC) here. It’s 2013 report detailed information from almost 4,000 papers.
Science and Public Policy Institute here. SADLY BLOCKED ACCESS NOW.
Intellicast Dr. Dewpoint Library here. REMOVED AND REPLACED BY ZERO VALUE NONSENSE FROM the radical WEATHER UNDERGROUND
The Weather Wiz here. See how they have added THE WIZ SCHOOL (UPPER LEFT) to their website. An excellent educational tool for teachers at all class levels. “Education is the kindling of a flame, not the filling of a vessel” - Socrates (470--399 BC)

 See samples on WeatherBELL Facebook
Support Icecap efforts to combat scientific fraud and environmental fanaticism with generous donation via a secure access to Paypal
See samples on WeatherBELL Facebook
Support Icecap efforts to combat scientific fraud and environmental fanaticism with generous donation via a secure access to Paypal


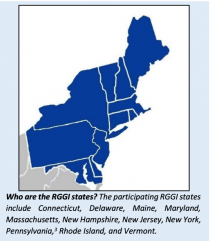
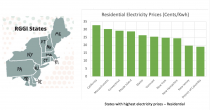
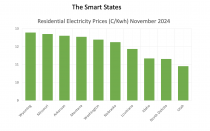
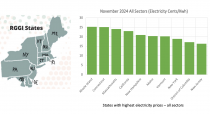
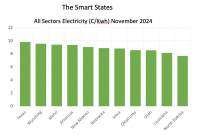
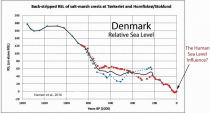
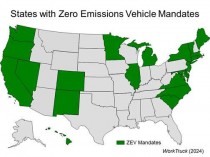

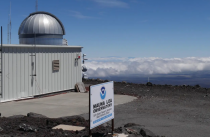
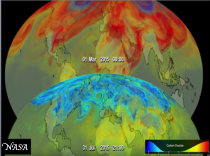
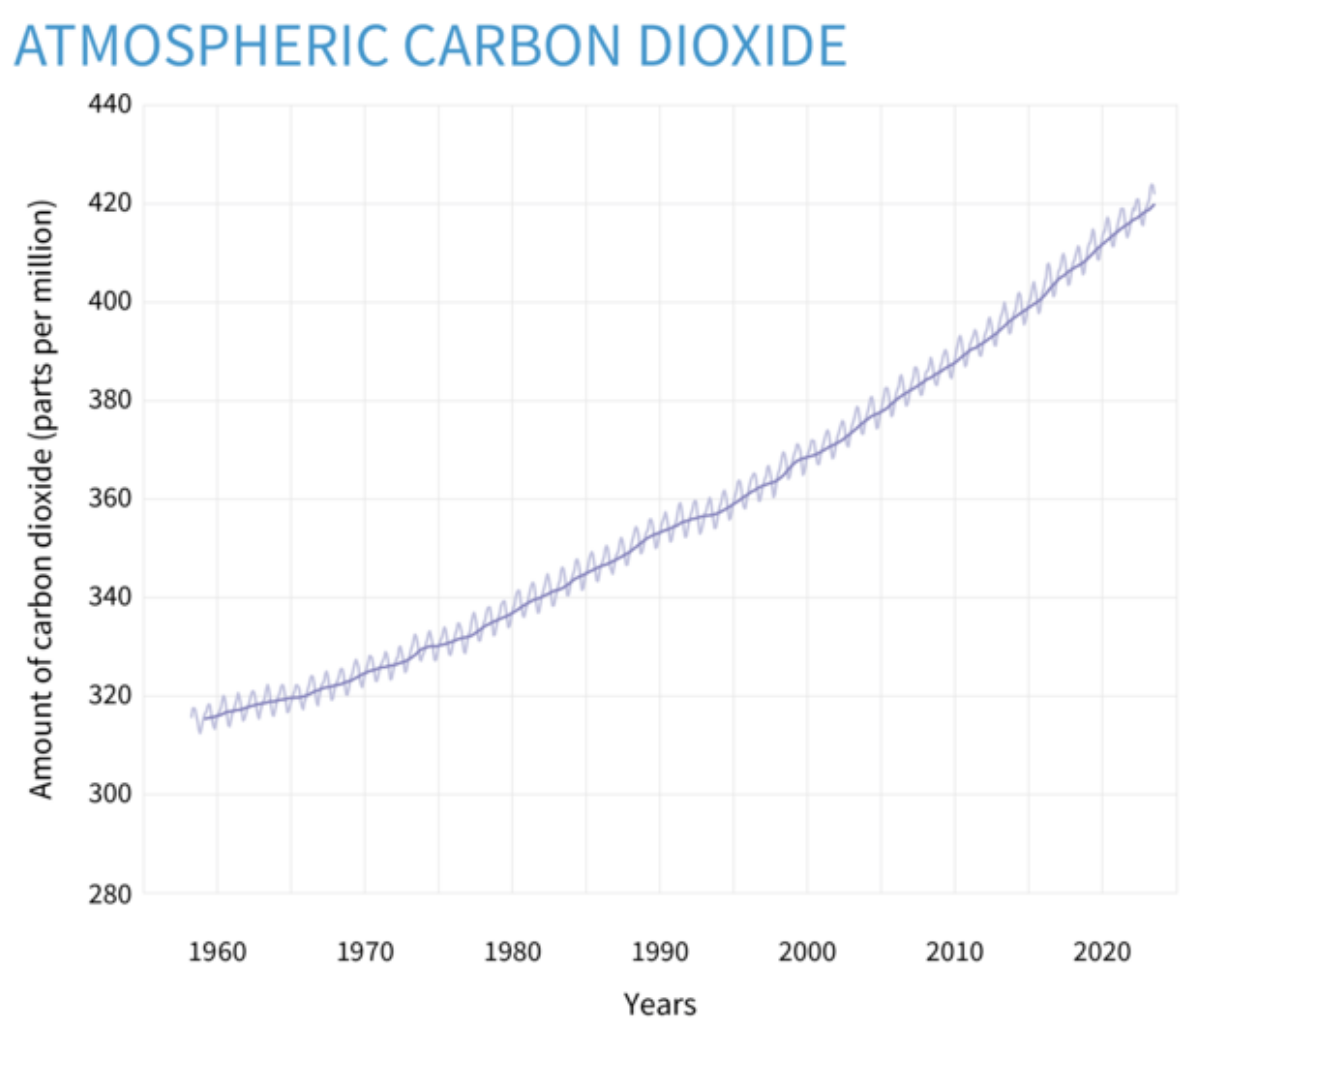

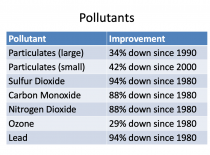
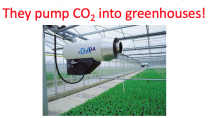
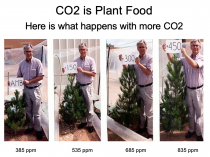


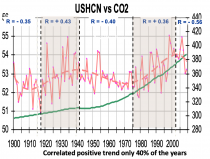

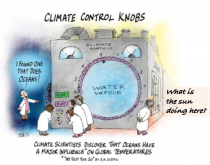
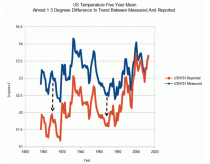


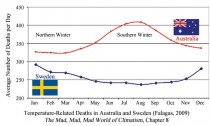
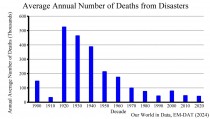
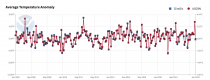
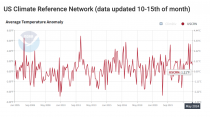
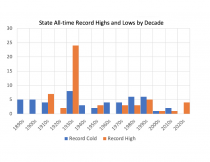


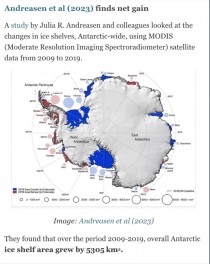
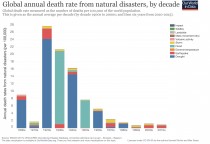


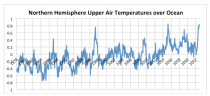

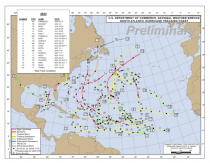
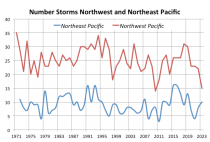
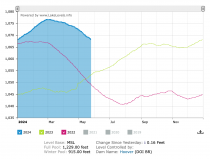

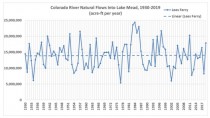
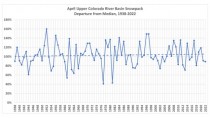
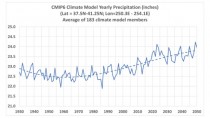

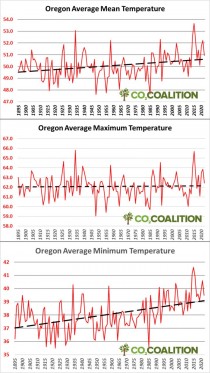
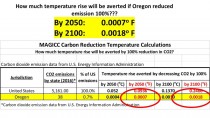
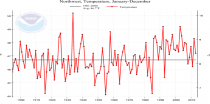
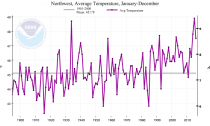
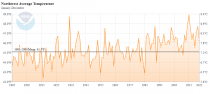
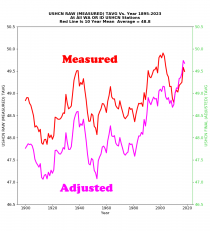

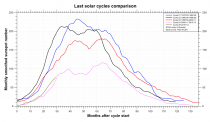
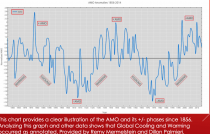

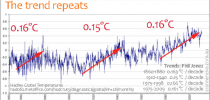

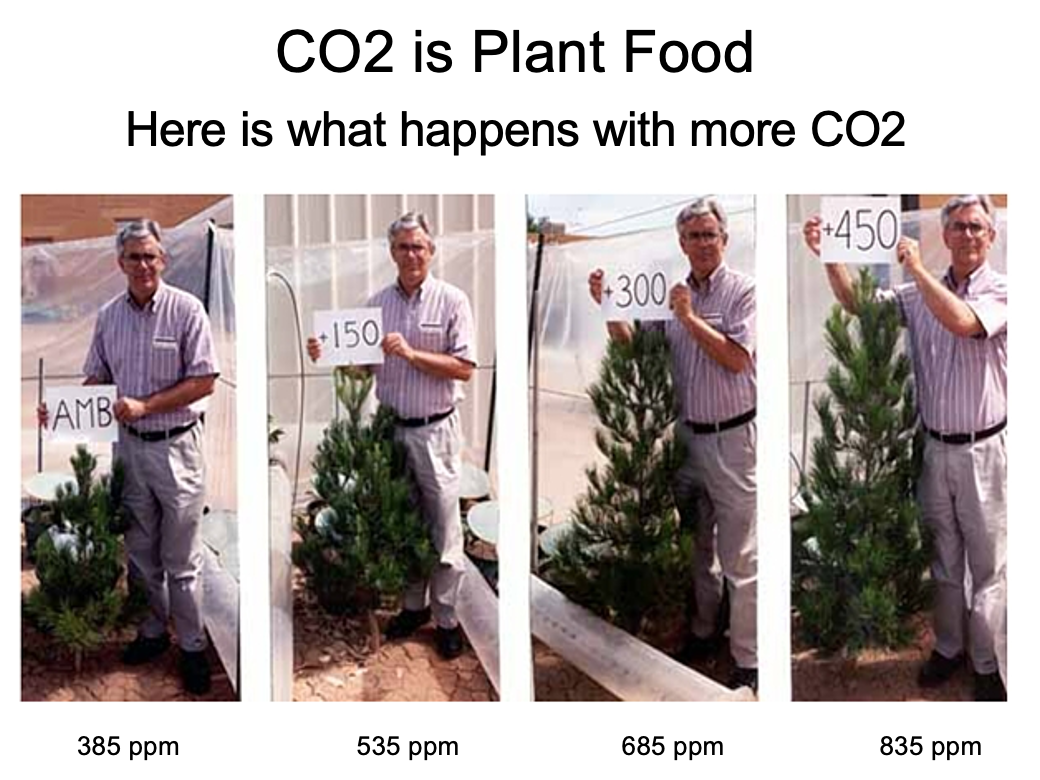
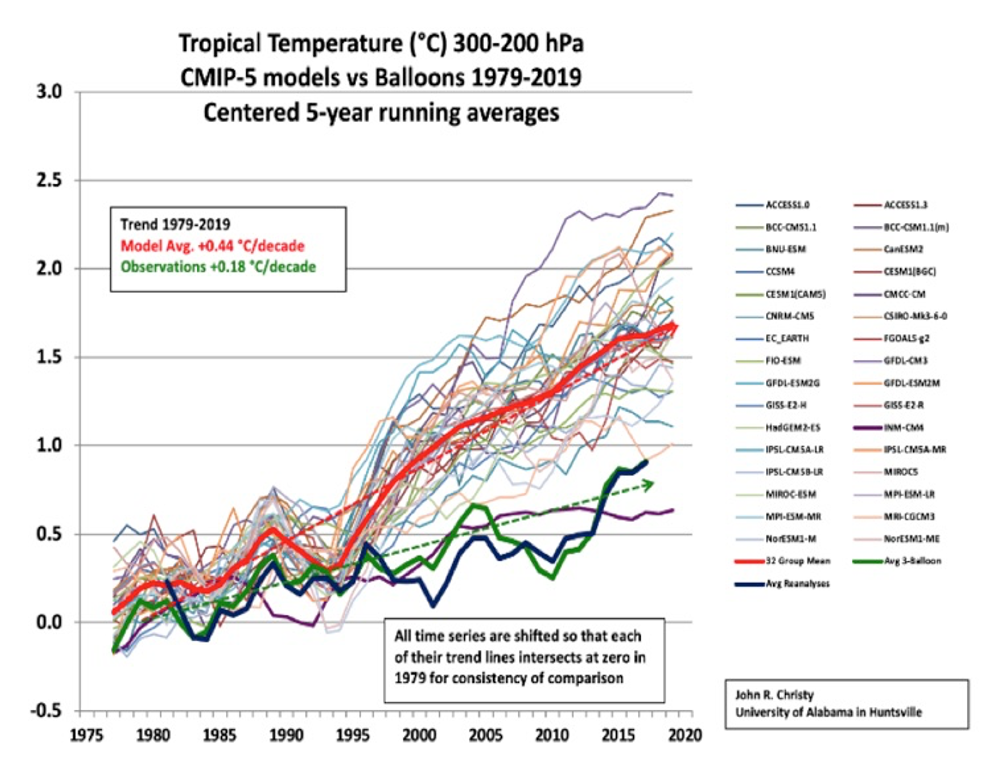
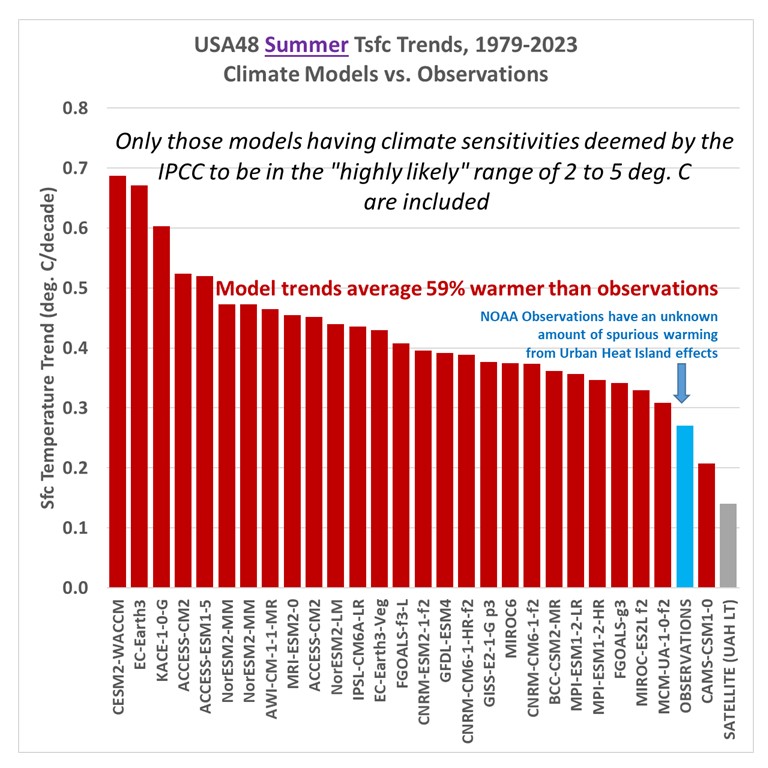
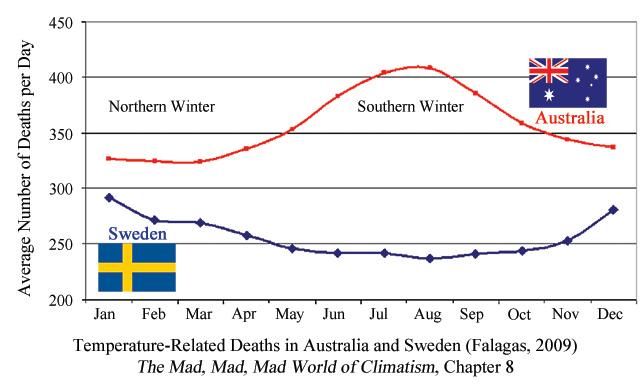
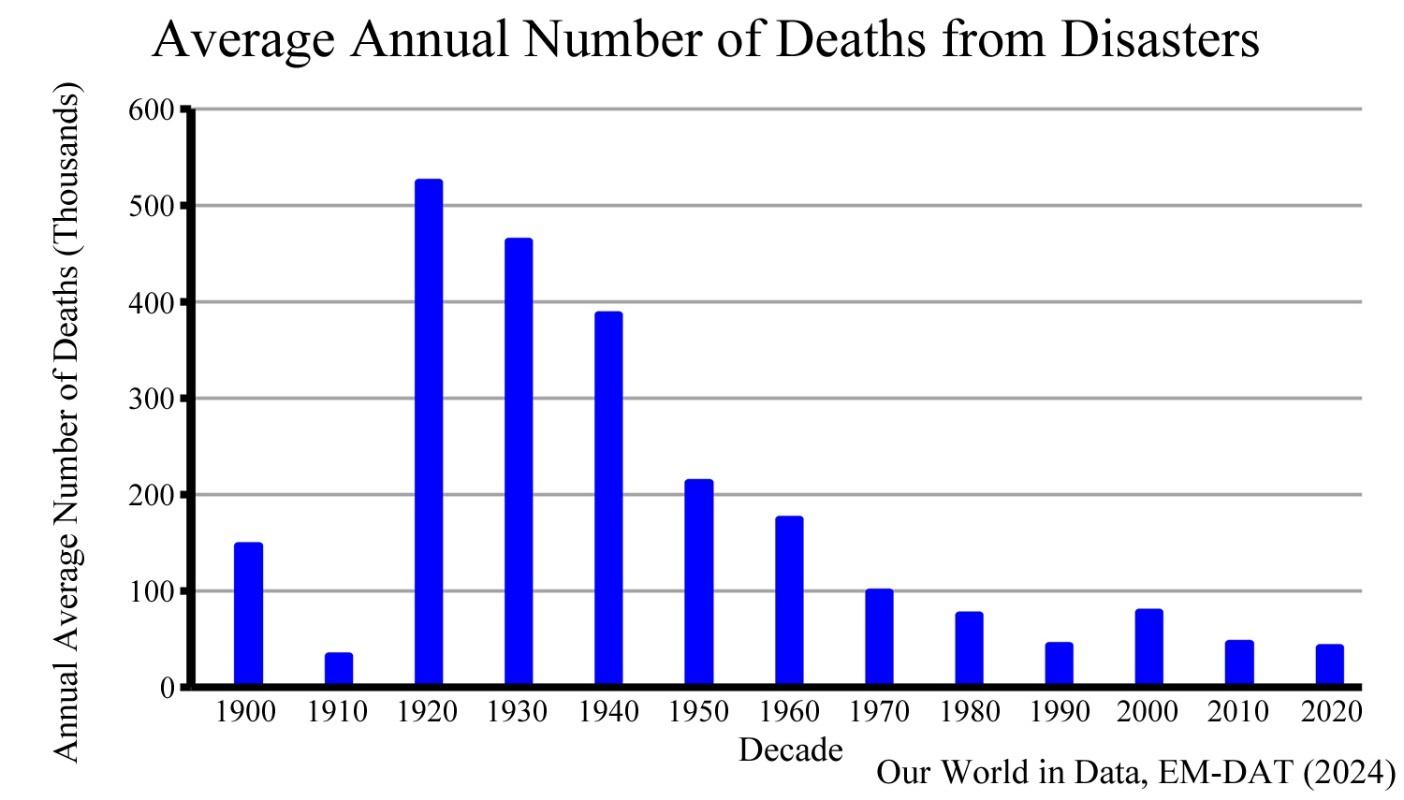
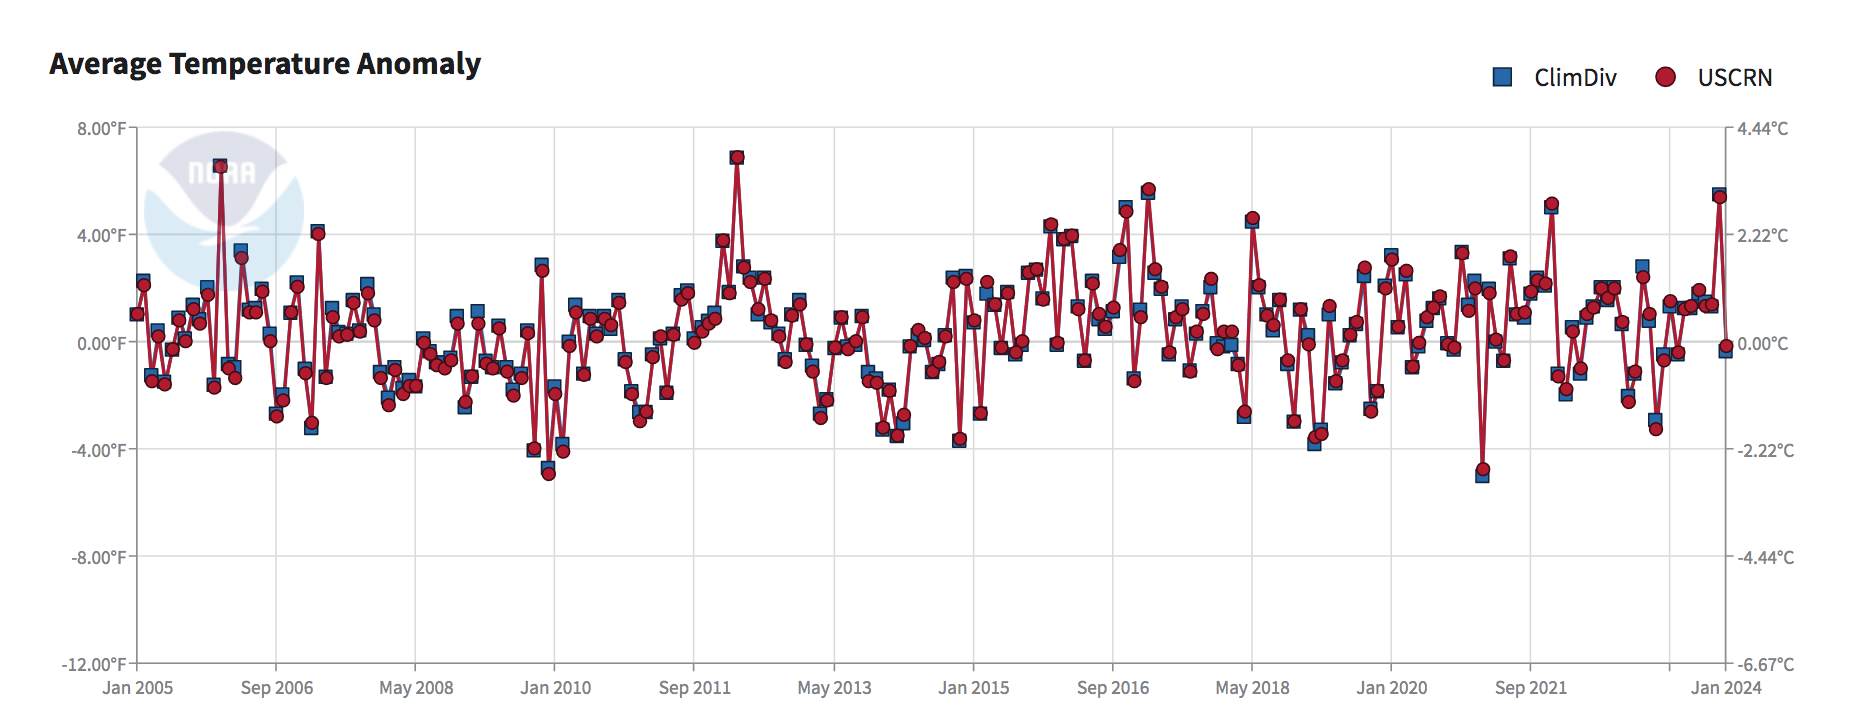
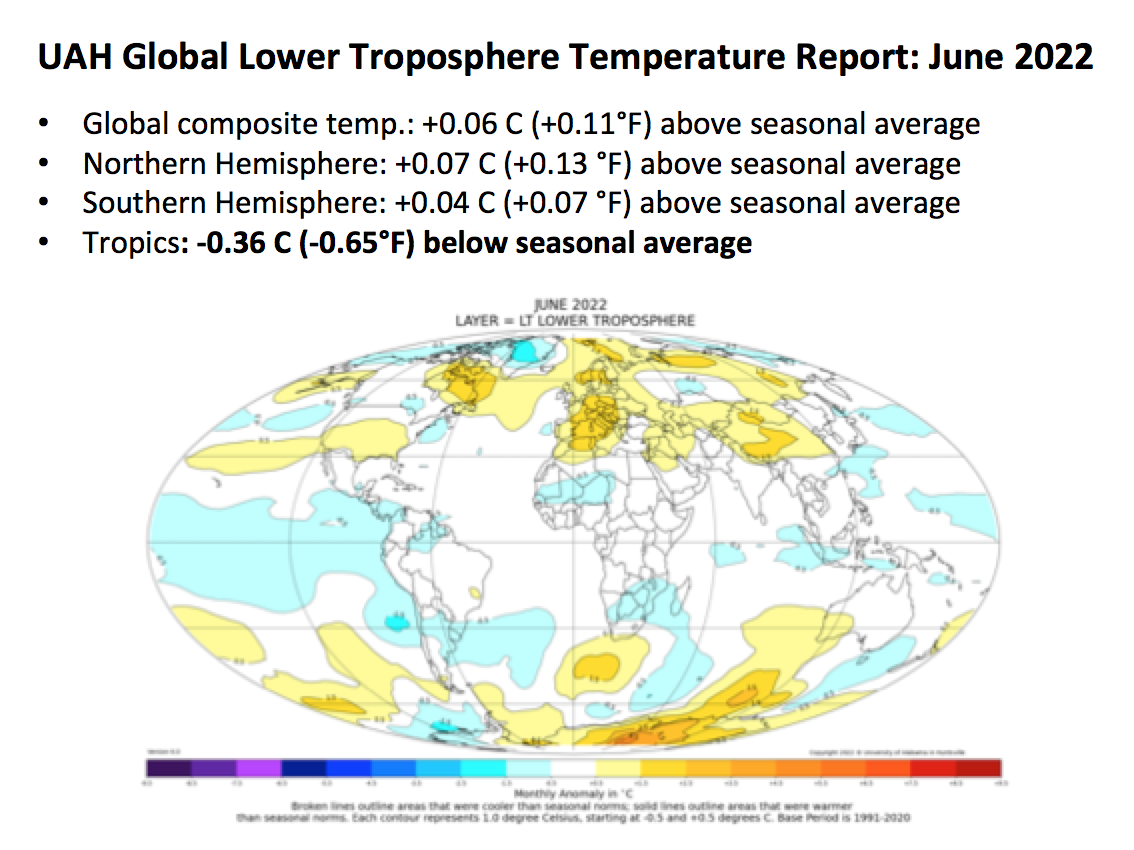
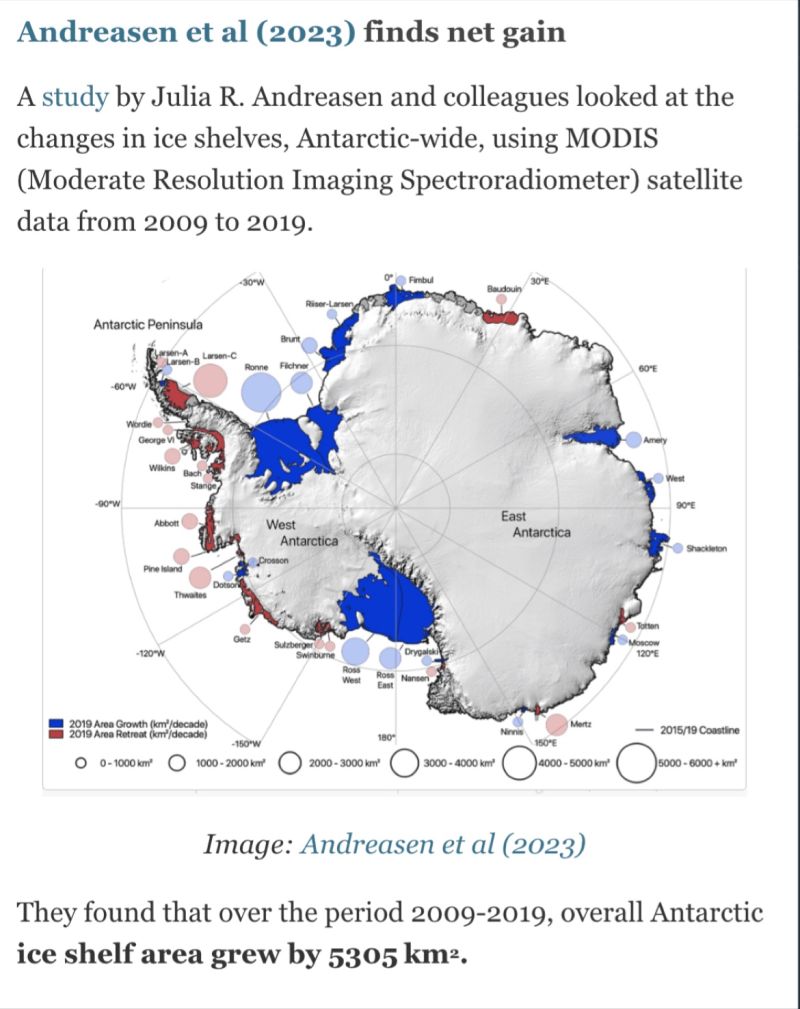
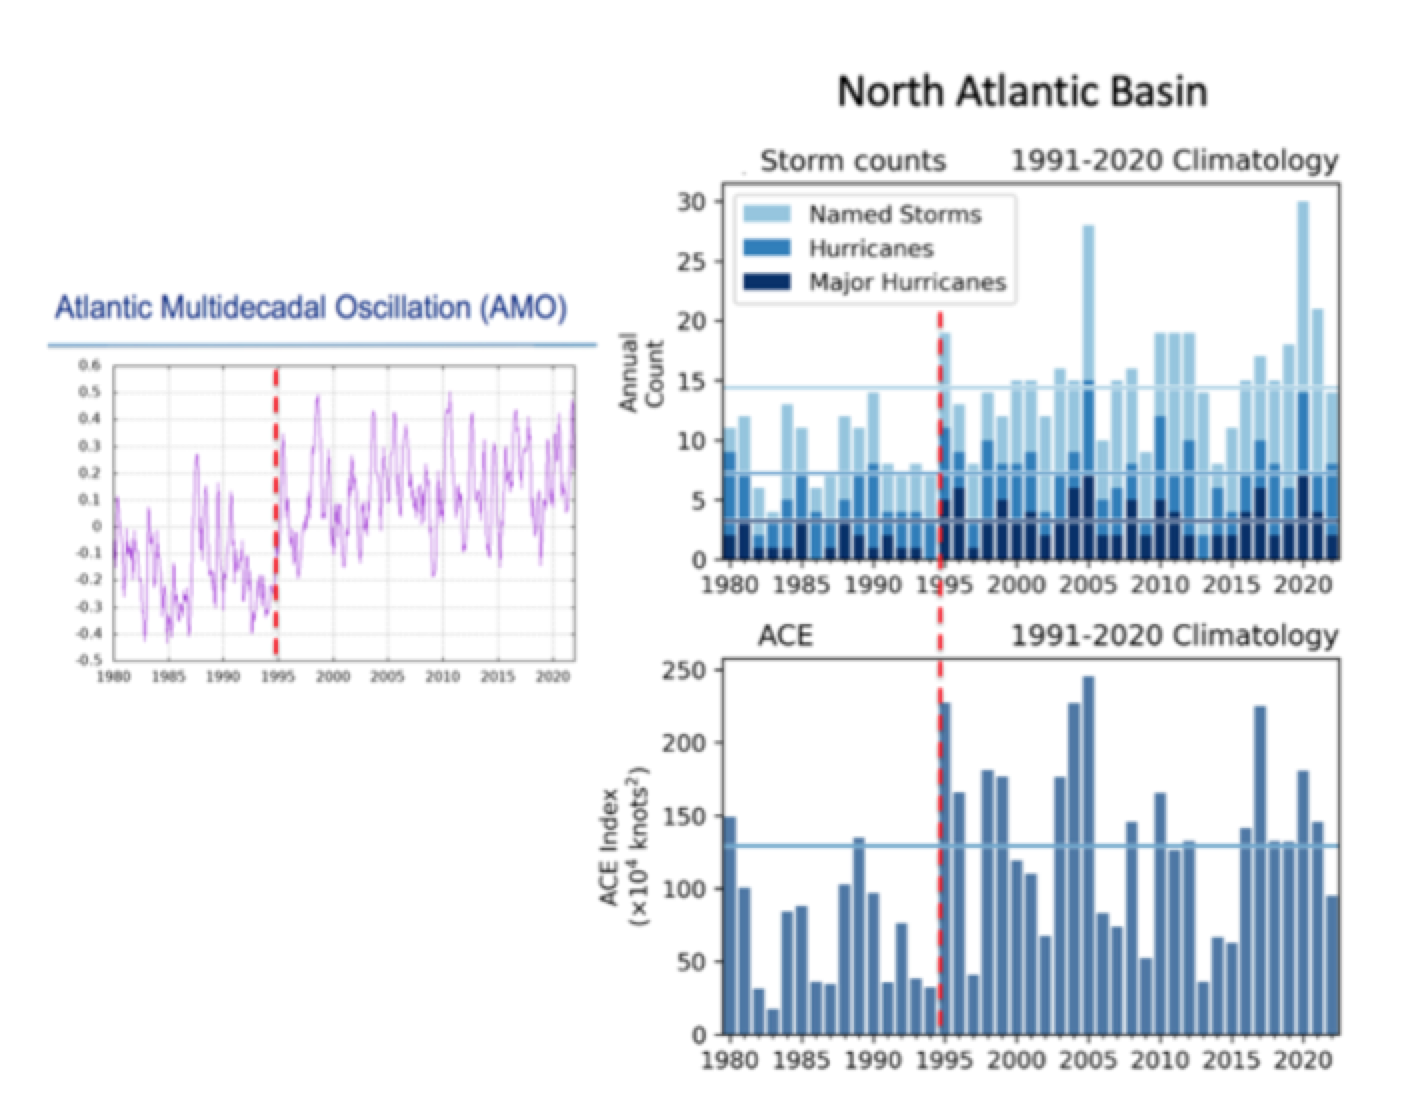
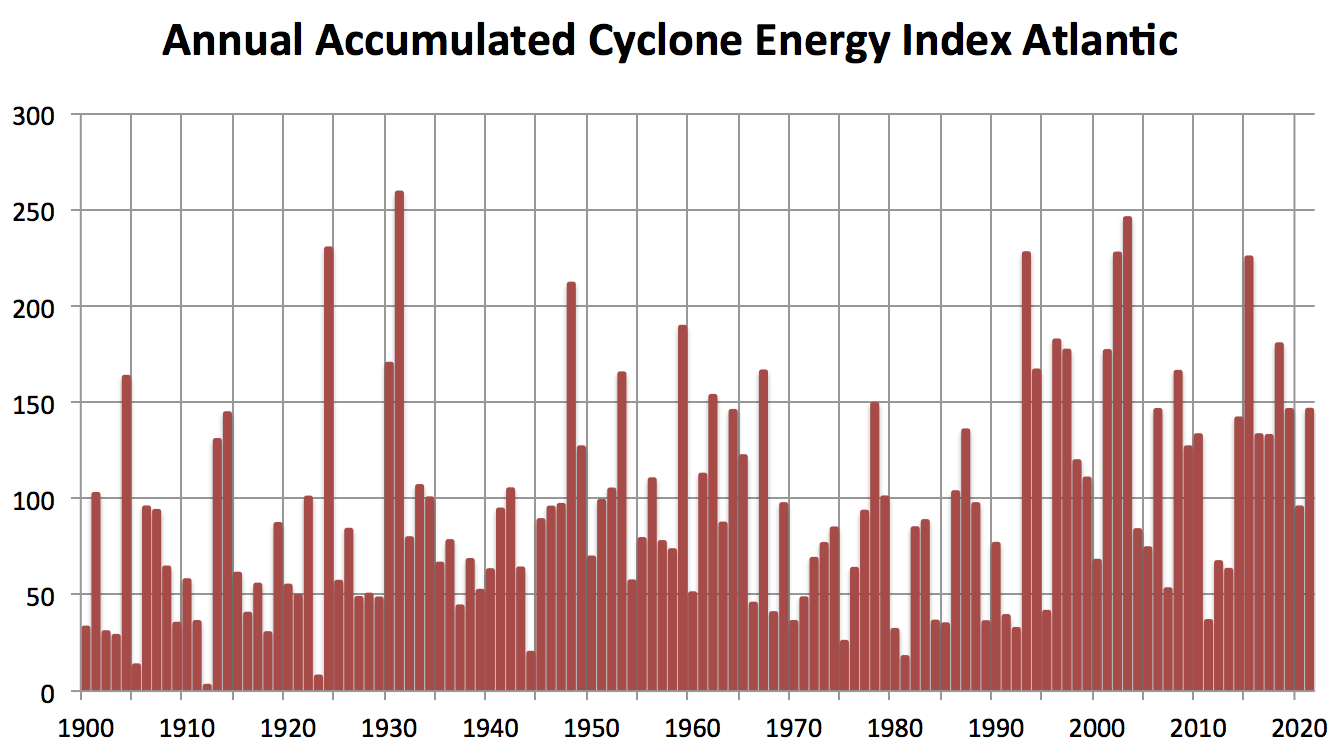
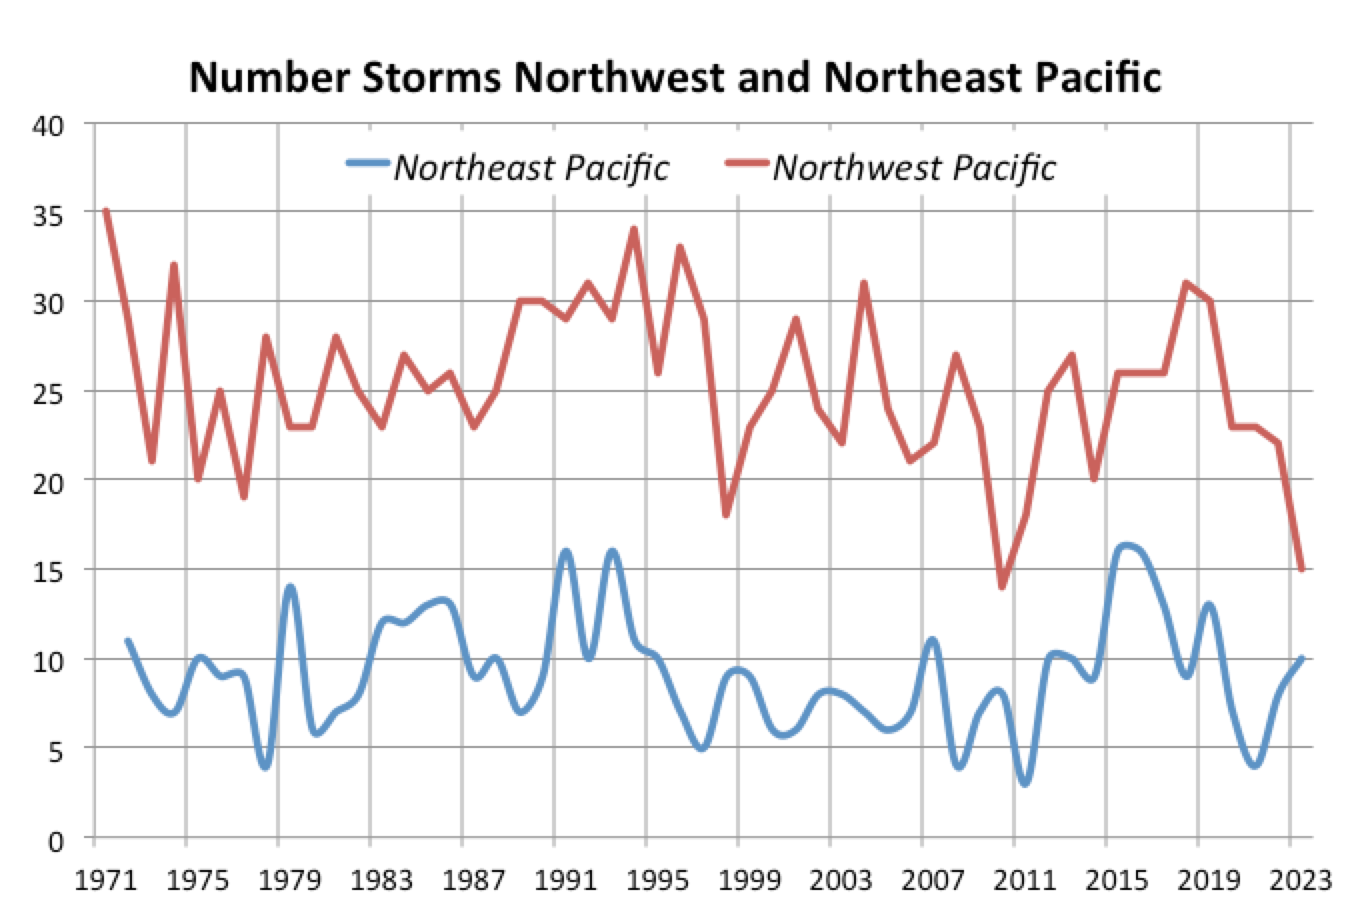
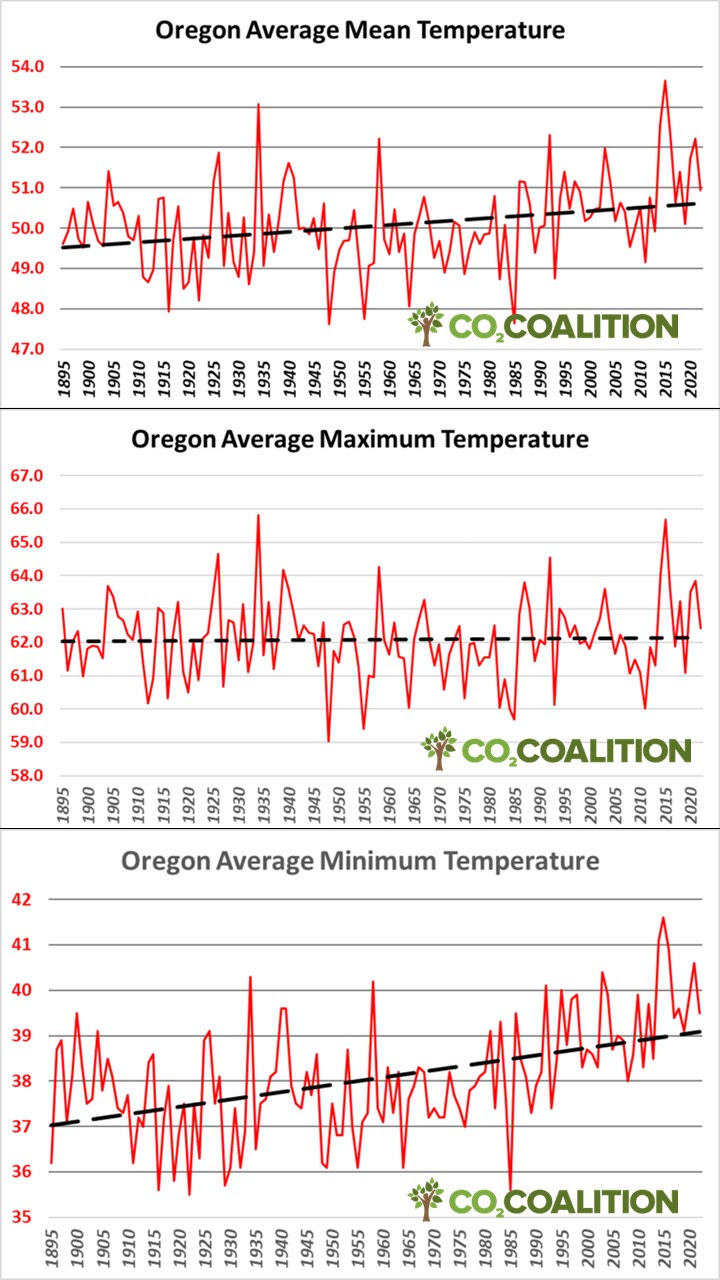
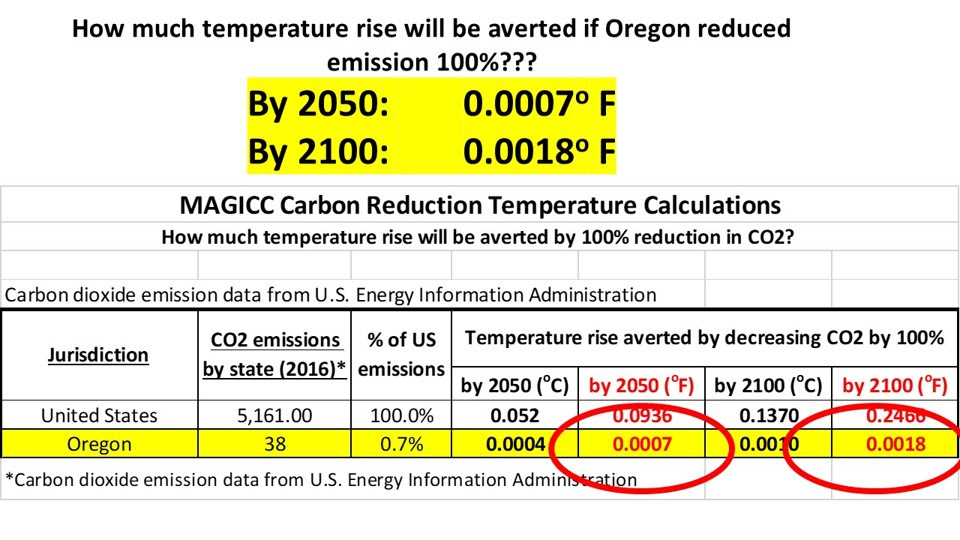
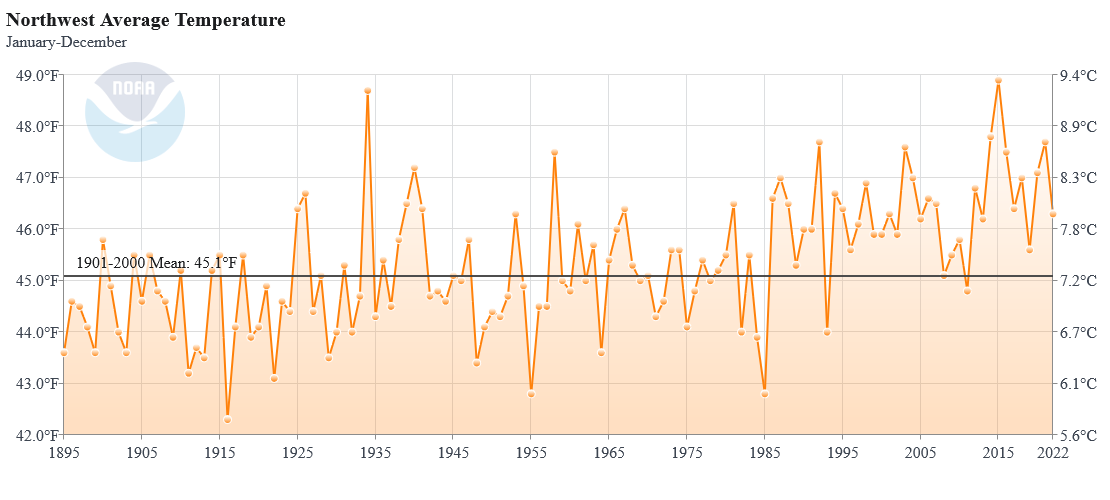
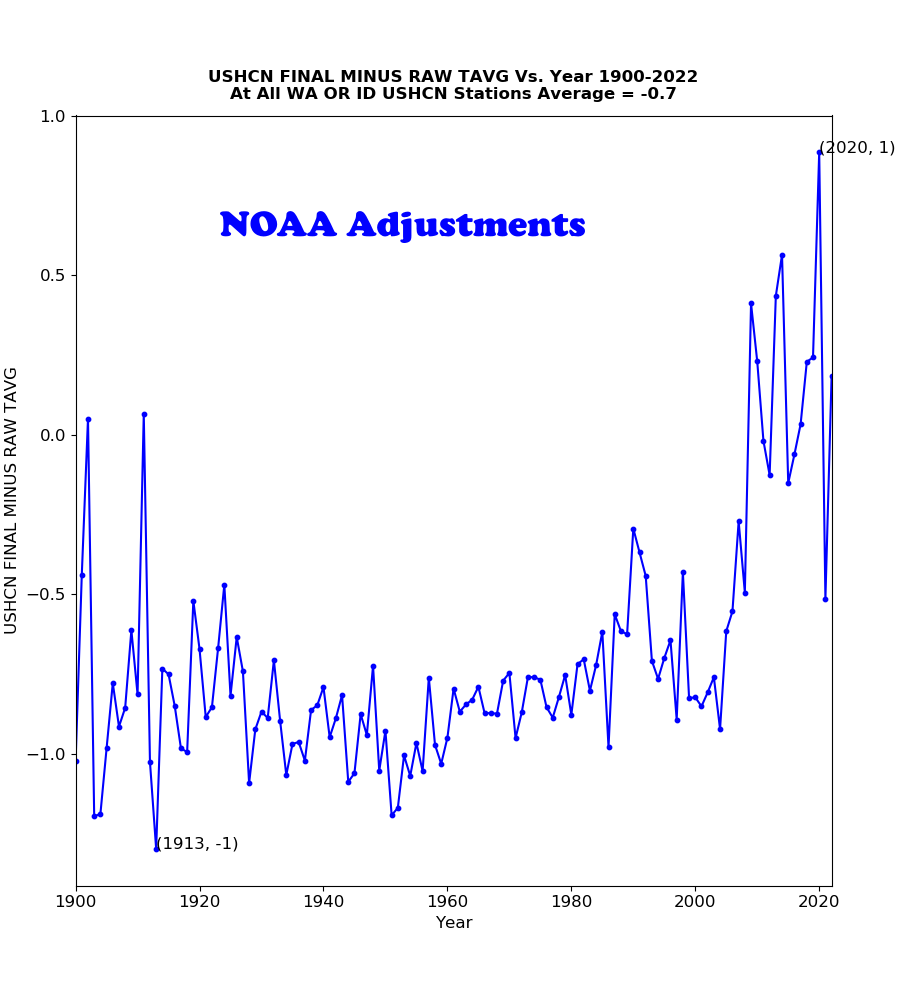