


By Charles Krauthammer, Washington Post
House Speaker Nancy Pelosi opposes lifting the moratorium on drilling in the Arctic National Wildlife Refuge and on the Outer Continental Shelf. She won’t even allow it to come to a vote. With $4 gas having massively shifted public opinion in favor of domestic production, she wants to protect her Democratic members from having to cast an anti-drilling election-year vote. Moreover, given the public mood, she might even lose. This cannot be permitted. Why? Because, as she explained to Politico: “I’m trying to save the planet; I’m trying to save the planet.”
A lovely sentiment. But has Pelosi actually thought through the moratorium’s effects on the planet?
Consider: 25 years ago, nearly 60 percent of U.S. petroleum was produced domestically. Today it’s 25 percent. From its peak in 1970, U.S. production has declined a staggering 47 percent. The world consumes 86 million barrels a day, the United States, roughly 20 million. We need the stuff to run our cars and planes and economy. Where does it come from?
Places such as Nigeria, where chronic corruption, environmental neglect and the resulting unrest and instability lead to pipeline explosions, oil spills and illegal siphoning by the poverty-stricken population—which leads to more spills and explosions. Just this week, two Royal Dutch Shell pipelines had to be shut down because bombings by local militants were causing leaks into the ground.
Compare the Niger Delta to the Gulf of Mexico, where deep-sea U.S. oil rigs withstood Hurricanes Katrina and Rita without a single undersea well suffering a significant spill.
The United States has the highest technology to ensure the safest drilling. Today, directional drilling—essentially drilling down, then sideways—allows access to oil that in 1970 would have required a surface footprint more than three times as large. Additionally, the United States has one of the most extensive and least corrupt regulatory systems on the planet.
Does Pelosi imagine that with so much of America declared off-limits, the planet is less injured as drilling shifts to Kazakhstan and Venezuela and Equatorial Guinea? That Russia will be more environmentally scrupulous than we in drilling in its Arctic?
The net environmental effect of Pelosi’s no-drilling willfulness is negative. Outsourcing U.S. oil production does nothing to lessen worldwide environmental despoliation. It simply exports it to more corrupt, less efficient, more unstable parts of the world—thereby increasing net planetary damage. Read the whole artilce here.
By Roger Pielke Sr., Climate Science
The Draft report Global Climate Change Impacts in the United States has been released. There is an announcement of the Public Review Draft of the Unified Synthesis Product Global Climate Change in the United States. Public comments are due by August 14 2008 [Climate Science readers are urged to submit comments].
This US Climate Change Science Program (CCSP) report is Co-Chaired by Thomas R. Karl, Jerry Melillo, and Thomas C. Peterson with the Senior Editor and Synthesis Team Coordinator Susan J. Hassol. These are the same individuals who have led past CCSP reports (e.g. see and see), with Tom Karl and Tom Peterson deliberately excluding scientific perspectives that differ from their viewpoints (i.e. see). Susan Hassol was writer of the HBO Special “To Hot Not to Handle”. This HBO show clearly had a specific perspective on the climate change issue, and lacked a balanced perspective. The HBO Executive Producer was Ms. Laurie David. A clear real conflict of interest is obvious.
As a result, this report continues the biased narrow perspective of the earlier CCSP reports, as has been reported on a number of times on Climate Science and in other communications (e.g. see and see). As just one example of the bias, the Karl et al report starts with the text
The Future is in Our Hands: “Human-induced climate change is affecting us now. Its impacts on our economy, security, and quality of life will increase in the decades to come. Beyond the next few decades, when warming is “locked in” to the climate system from human activities to date, the future lies largely in our hands. Will we begin reducing heat trapping emissions now, thereby reducing future climate disruption and its impacts? Will we alter our planning and development in ways that reduce our vulnerability to the changes that are already on the way? The choices are ours.”
This statement perpetuates the rejected perspective on the role of humans in the climate system that the human influence [on the climate system] is dominated by the emissions into the atmosphere of greenhouse gases, particularly carbon dioxide. The perspective that is, however, supported by a wide body of scientific evidence (e.g. see) is that natural variations are more important than recognized in the Karl et al CCSP synthesis report and that the human influence involves a diverse range of first-order climate forcings, including, but not limited to the human input of CO2.
The remainder of the Karl et al CCSP report necessarily miscommunicates climate information since it is built on their incorrect focus on “reducing heat trapping emissions”, rather than also on the role of natural variations as observed in the past, and on the other first order climate forcings such as the role of aerosols in precipitation, nitrogen deposition and land use/land cover change (e.g. see).
For example, their claim that “Historical climate and weather patterns are no longer an adequate guide to the future” is not supported by the observational evidence (e.g. see where an example is presented of past data that we should use to plan for the future). Thus the conclusion is that the US CCSP Program has failed in its mission. These reports have become stale and in-bred, since the same people are repeating their perspective on the climate issue. Read this important post in its entirety here.
Also see Anthony Watts correct assessment of the issue in his post ”NCDC Changes from National Record Keeper to Advocacy Group”.
By Joseph D’Aleo, CCM, Fellow of the AMS
Joseph Romm, chief alarmist at Climate Progress and a former Acting Assistant Secretary of the U.S. Department of Energy in the Clinton Gore Administration is trying to save his former boss from further embarrassment. Recall that Gore in An Inconvenient Truth about 20 foot sea level rises this century using a huge crane in a large studio to show how high 20 feet was, when even with the IPCC forecast he could have saved a lot of expense and used a small step stool.
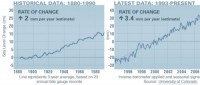
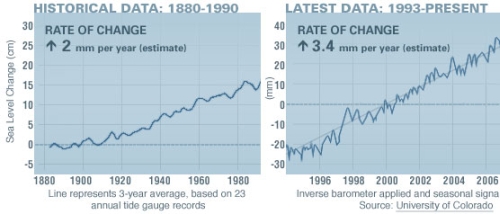
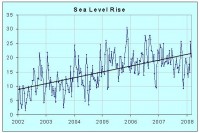
In this post on Grist, Romm notes that sea levels were accelerating upward using JPL satellite derived measurements. The apparent “jump” is a rate of change from 2mm/year from ~1880 to 1990 to 3.4mm/year from 1993 to the present. Romm says “So sea levels are now rising about 1.3 inches a decade. This is not yet worrisome, but if current emissions trends continue and the rate of sea level rise merely continues the same relationship to global temperature rise that it has had in recent decades, then we could see a total rise of up to five feet by 2100, at which point the rate of sea level rise would exceed six inches a decade.”
See larger image here
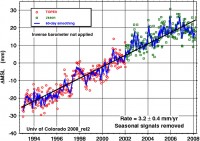
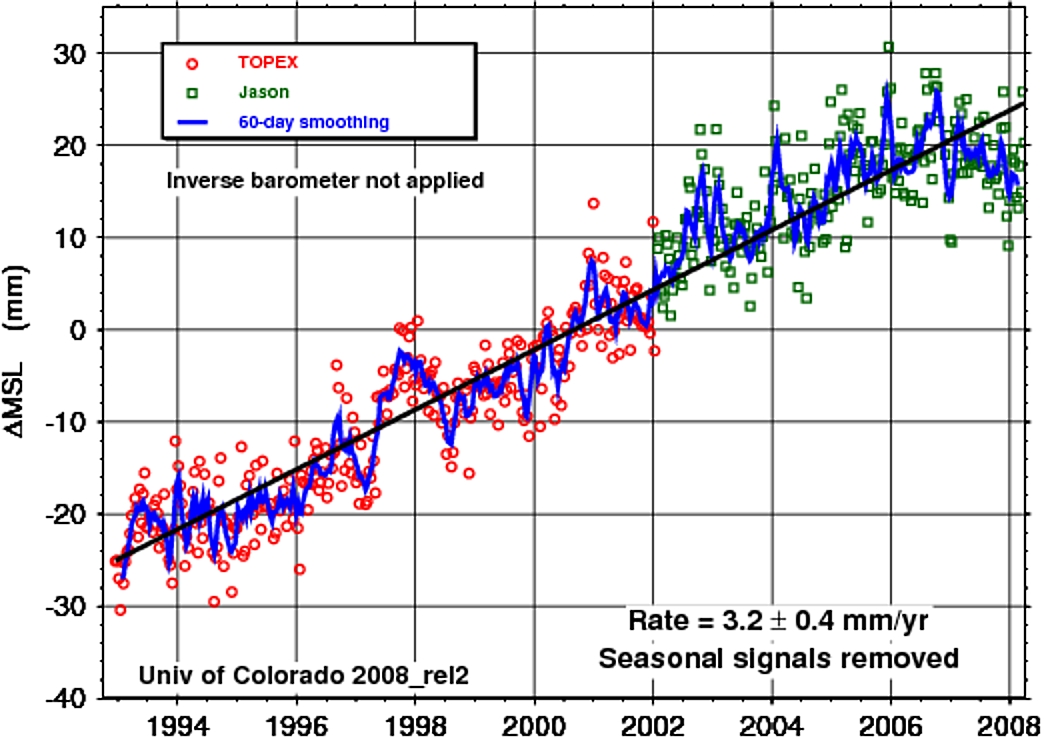
In the same post he plots this image we showed recently.
See larger image here
We had noted that sea level rise has slowed dramatically as the oceans and the globe cooled (the oceans contract when they cool, expand when they warm). In fact the chart below shows the rate of increase has declined to 1.94mm/year over the past 223 months since the cooling began in 2002, a little less than the 1880 to 1990 average. They were flat or even declined this past year thanks to the La Nina accelerated ocean cooling.
See larger image here
Romm gets one thing right. If the cooling which began continues as we believe it will, this new JPL site will be invaluable in showing the accelerating sea level rise indeed is no threat. The rate of sea level rise varies with time but it has been rising since the last ice age and there has been no significant alteration to the rate of sea level rise for about 10,000 years.
Update: Romm who must be running for a position in the Obama Administratation also attacked Joel Achenbach who posted on Weather Extremes on the Washington Post. See how Roger Pielke Jr. viewed Achenbach and Romm in this post here. Romm who clearly knows nothing substantive about climate or weather, cites of all people, Ross Gelbspan a former equally vacuous newsman turned alarmist/opportunist as source and inpiration. Romm is no match for Roger Pielke Jr. who spent his whole career focused on extremes and impacts of weather. Who would you trust on this one?
By Steve McIntyre, Climate Audit
Bernie draws our attention to an article in the Globe and Mail on another break-off of the Ellesmere Island ice shelf: The Globe and Mail has an excellent map of the “collapse” of this ice sheet. Apparently its collapse has been proceeding for about 100 years.
Update- The break is said to be unprecedented since as long ago as 2005:” Scientists say the break, the largest on record since 2005 but still small when compared with others “
This topic is in the news from time to time - there was another similar story in a couple of years ago. At the time, I looked into the matter and wrote several posts on the topic of Ellesmere Island ice shelves, which people interested in this topic may wish to re-visit. Ellesmere Island Ice Shelves, Ellesmere Island Driftwood, Ayles Ice Shelf, and Ice Island T-3.
Bradley and England 2008 , “The Younger Dryas and the sea of ancient ice”, is a highly readable and interesting discussion of Ica Age climate, which, inter alia, contains an account of late 19th century descriptions of the Ellesmere Island ice shelves, which Bradley and England 2008 propose as an analogue for the much larger “paleocrystic ice” that they propose for the LGM. Their Figure 1 is an 1878 watercolor of an Ellesemere Island ice shelf about which they say: “We believe this painting provides an eye-witness view of some of the paleocrystic floes that formed during the Little Ice Age, but were breaking up by the end of the 19th century.” Sere more of Steve’s blog and comments here.
Also Anthony Watts did an arctic update “There is Still a Lot of Ice Up There” here.
See large image here
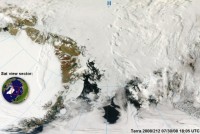
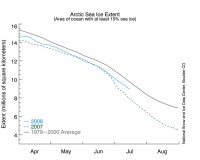
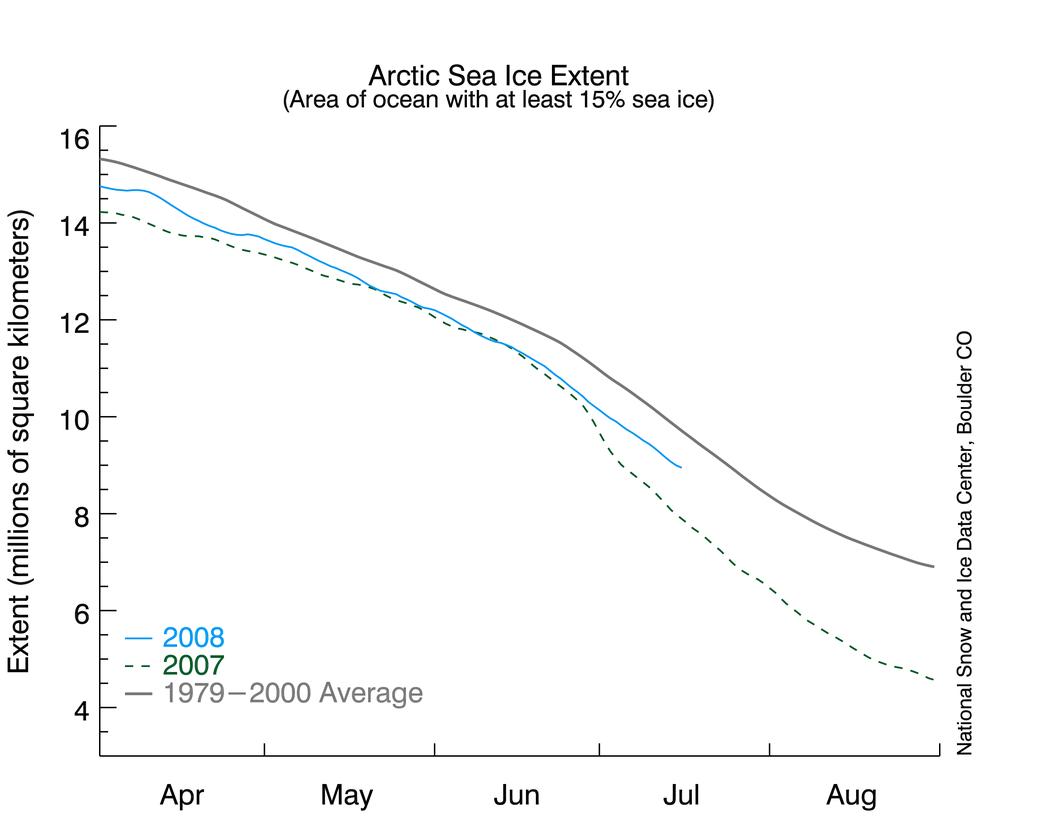
As NSIDC reported ”Arctic sea ice extent on July 16 stood at 8.91 million square kilometers (3.44 square miles). While extent was below the 1979 to 2000 average of 9.91 square kilometers (3.83 million square miles), it was 1.05 million square kilometers (0.41 million square miles) above the value for July 16, 2007” As the University of Illinois Cryosphere showed it up to date
See full size imge here.
By Joseph D’Aleo, CCM, AMS Fellow
The New York Times Magazine published a story “Ice Free” by Stephan Faris, hawking his new book “Forecast: The Consequences of Climate Change, From the Amazon to the Arctic, From Darfur to Napa Valley”, to be published in January.
In the article, Faris notes “Greenland’s ice sheet represents one of global warming’s most disturbing threats. The vast expanses of glaciers- massed, on average, 1.6 miles deep - contain enough water to raise sea levels worldwide by 23 feet. Should they melt or otherwise slip into the ocean, they would flood coastal capitals, submerge tropical islands and generally redraw the world’s atlases. The infusion of fresh water could slow or shut down the ocean’s currents, plunging Europe into bitter winter.”
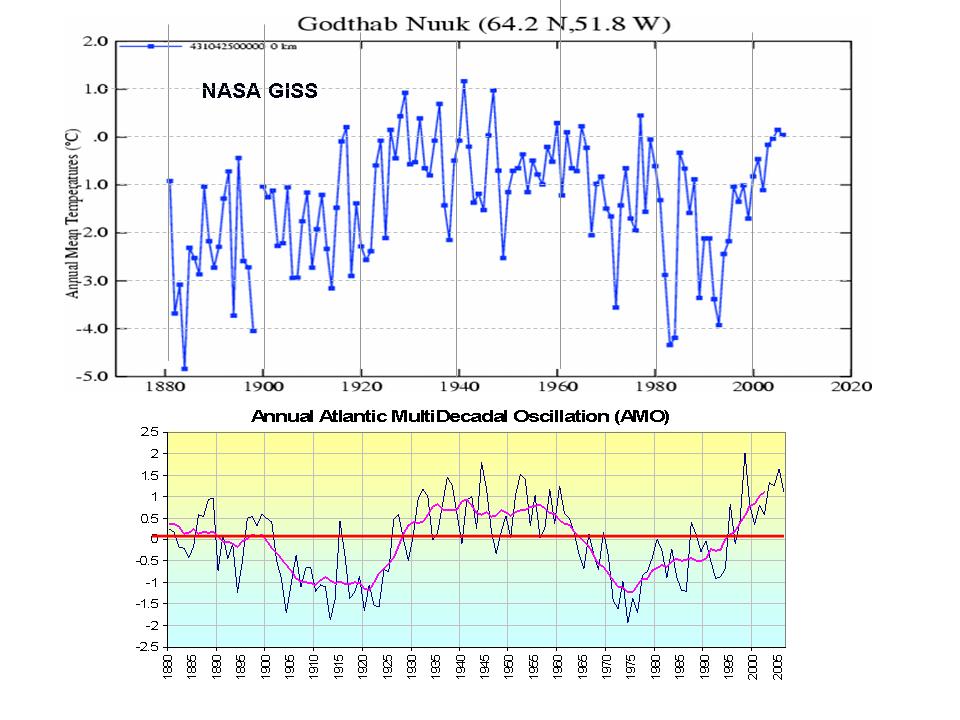
There is little recognition in the media and by the author of history. Greenland actually was warmer in the 1930s and 1940s than it has been in recent decades. For the period from the 1960s to the 1990s, temperatures actually declined significantly as the Atlantic went through its multidecadal cold mode. The temperature changes up and down the last few centuries were closely related to these multidecadal ocean cycles.
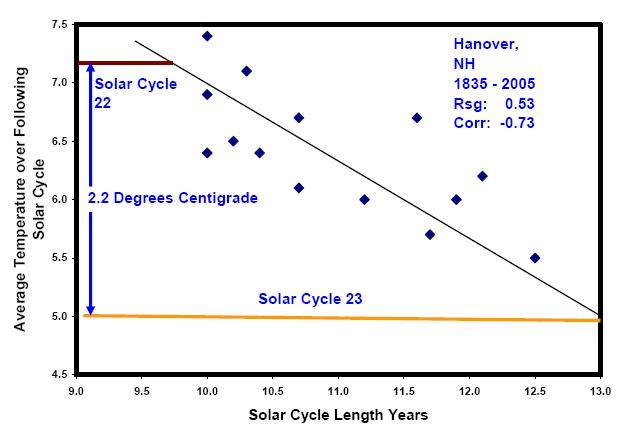
Shown below is the temperature plot for Godthab Nuuk in southwest Greenland. Note how closely the temperatures track with the AMO (which is a measure of the Atlantic temperatures 0 to 70N). It shows that cooling from the 1940s to the late 1990s even as greenhouse gases rose steadily, a negative correlation over almost 5 decades. The rise after the middle 1990s was due to the flip of the AMO into its warm phase. They have not reached the level of the 1930s and 1940s.
See larger graphs here
Temperatures cooled back to the levels of the 1880s by the 1980s and 1990s. In a GRL paper in 2003, Hanna and Cappelen showed a significant cooling trend for eight stations in coastal southern Greenland from 1958 to 2001 (-1.29ºC for the 44 years). The temperature trend represented a strong negative correlation with increasing CO2 levels.
Many recent studies have addressed Greenland ice mass balance. They yield a broad picture of slight inland thickening and strong near-coastal thinning, primarily in the south along fast-moving outlet glaciers. However, interannual variability is very large, driven mainly by variability in summer melting and sudden glacier accelerations. Consequently, the short time interval covered by instrumental data is of concern in separating fluctuations from trends. But in a paper published in Science in February 2007, Dr. Ian Howat of the University of Washington reports that two of the largest glaciers have suddenly slowed, bringing the rate of melting last year down to near the previous rate. At one glacier, Kangerdlugssuaq, “average thinning over the glacier during the summer of 2006 declined to near zero, with some apparent thickening in areas on the main trunk.”
Dr. Howat in a follow-up interview with the New York Times went on to add: “Greenland was about as warm or warmer in the 1930’s and 40’s, and many of the glaciers were smaller than they are now. This was a period of rapid glacier shrinkage world-wide, followed by at least partial re-expansion during a colder period from the 1950’s to the 1980’s. Of course, we don’t know very much about how the glacier dynamics changed then because we didn’t have satellites to observe it. However, it does suggest that large variations in ice sheet dynamics can occur from natural climate variability.” For more on this issue see this full post here. SPPI has also posted a response here. EPW compiled a series of papers here.
Snow in Queensland, soft hail or snow in Sydney and icy delays in Adelaide. It has snowed in Queensland, and it will pay to rug up because even colder weather is expected tomorrow. Snow, sleet, wind and rain ripped through the state’s Granite Belt and southern Darling Downs, bringing freezing conditions yesterday. See photos here. The big chill was felt across virtually all over the eastern seaboard and the ski fields at Perisher in the New South Wales Snowy Mountains enjoyed a 15cm dump of snow.
Meanwhile, one of Adelaide’s coldest mornings forced the delay of flights yesterday as ice formed on the wings of planes. Adelaide Airport managing director Phil Baker said up to 400 passengers were due to leave about 7am but their flights were delayed until about 8.15am, when the air temperature increased. For Adelaide it was the coldest temperature since 1982.
Yesterday, Granite Belt Wine Country marketing director Michele Cozzi said snow was reported at Eukey, south of Stanthorpe, and at Sugarloaf Forest to the east while sleet was recorded at Stanthorpe, Glen Aplin and Applethorpe.
And the ground turned white in Sydney. It looked like snow, and it felt like snow, but in what may come as a disappointment to Sydneysiders, today’s winter whiteness was just soft hail. Just after 3.30pm (AEST) this afternoon the area around Lindfield, Roseville and Killara became blanketed in white as a thunderstorm brought a winter wonderland to parts of northern Sydney. It’s given a very European feel to Roseville,” one Roseville woman told the Seven Network. “I think the snow here is better than Perisher,” a man from the same suburb told the ABC. But despite some hope that metropolitan Sydney had experienced its first recorded snowfall since 1836, the Bureau of Meteorology said northern Sydney had just been blanketed in hail. “It was soft hail,” senior forecaster Peter Zmijewski said.

As an emailer said some of the places where snow fell were the equivalent of a snow in Buenos Aires as they experienced last year for the first time in many years. Speaking of South America, the UN had to rush aid to Peruvian farmers who are suffering from unusual cold and snow . a combination of unseasonable low temperatures, frosts, snow and hail that damages crops and the high-altitude pastures on which alpacas graze, according to Marc Vandersmissen, FAO’s Emergency Coordinator in Peru. This year, the cold arrived well ahead of the usual season - in March and April, instead of June - and many small-scale farmers have not been able to harvest their crops.
Monckton’s litanyBy Peter Gallagher
Christopher, Viscount Monkton of Brenchley, is a good scholar and a fine writer. This is from an address by The Viscount Monckton of Brenchley to the Local Government Association, Bournemouth, 3 July 2008. Thanks to Dr Benny Peiser’s newsletter where this was first published.This clever recital pulls no punches but you may feel like responding ‘amen’. Here is a short sample of his comments. For more see.
Canute couldn’t stop sea level rising. Officials can’t stop it either.
Even if global temperature has risen, it has risen in a straight line at a natural 0.5C/century for 300 years since the Sun recovered from the Maunder Minimum, long before we could have had any influence (Akasofu, 2008).
Even if warming had sped up, now temperature is 7C below most of the past 500m yrs; 5C below all 4 recent inter-glacials; and up to 3C below the Bronze Age, Roman & mediaeval optima (Petit et al., 1999; IPCC, 1990).
Even if today’s warming were unprecedented, the Sun is the probable cause. It was more active in the past 70 years than in the previous 11,400 (Usoskin et al., 2003; Hathaway et al., 2004; IAU, 2004; Solanki et al., 2005).
Even if the sun were not to blame, the UN’s climate panel has not shown that humanity is to blame. CO2 occupies only one-ten-thousandth more of the atmosphere today than it did in 1750 (Keeling & Whorf, 2004).
Even if CO2 were to blame, no “runaway greenhouse” catastrophe occurred in the Cambrian era, when there was ~20 times today’s concentration in the air. Temperature was just 7 C warmer than today (IPCC, 2001).
Even if CO2 levels had set a record, there has been no warming since 1998. For 7 years, temperatures have fallen. The Jan 2007-Jan 2008 fall was the steepest since 1880 (GISS; Hadley; NCDC; RSS; UAH: all 2008).
Even if the planet were not cooling, the rate of warming is far less than the UN imagines. It would be too small to cause harm. There may well be no new warming until 2015, if then (Keenlyside et al., 2008).
Even if warming were harmful, humankind’s effect is minuscule. “The observed changes may be natural” (IPCC, 2001; cf. Chylek et al., 2008; Lindzen, 2007; Spencer, 2007; Wentz et al., 2007; Zichichi, 2007; etc.).
Even if our effect were significant, the UN’s projected human fingerprint - tropical mid-troposphere warming at thrice the surface rate - is absent (Douglass et al., 2004, 2007; Lindzen, 2001, 2007; Spencer, 2007).
Even if the human fingerprint were present, climate models cannot predict the future of the complex, chaotic climate unless we know its initial state to an unattainable precision (Lorenz, 1963; Giorgi, 2005; IPCC, 2001). Even if computer models could work, they cannot predict future rates of warming. Temperature response to atmospheric greenhouse-gas enrichment is an input to the computers, not an output from them (Akasofu, 2008).
Therefore, extravagant, futile schemes by the State and its organs to mitigate imagined “global warming” will have no more effect than King Canute’s command to the tide not to come in and wet the Royal feet. We must get the science right or we shall get the policy wrong. There is no manmade “climate crisis”. It is a non-problem. The correct policy approach to a non-problem is to have the courage to do nothing.
By John Brignell, Numberwatch
I disapprove of what you say, but I will defend to the death your right to say it. Voltaire (attributed)
That’s what we used to call it - refereeing. The term “peer review” seemed to spring up and take over at about the same time as the rise of political correctness. It was a burden that most senior academics and some industrial engineers and scientists were expected to bear as part of their duty to their profession, and an onerous one it was too. It took up many hours of one’s week, with no recognition and certainly no payment. Many of us would now have a more comfortable retirement if we had devoted the time to fee earning.
The duties of the referee were mainly concerned with preserving the integrity of the institution and its publications, to identify provable errors and infelicities of expression. It did not involve rewriting an author’s paper, changing its slant or imposing an opinion. The European tradition of refereeing was that it was to be done with a light touch, but that curious intensity that invades some American academic institutions often resulted in little short of a demolition job. There was something of a schism, one side thinking the other was idle, while in the other direction there were mutterings of “over the top”. For what was understood was that the process was corruptible. Many referees in their early careers had experienced coteries that attempted to take over particular small areas of disciplines to enforce their own views and theories. It was, however, only in the new era of Green politics that the threat of a universal censorship emerged.
In Britain it took the form of outright nationalisation of the universities, begun under Thatcher and completed under Blair. In America it was the founding of new public institutions, richly endowed with taxpayers’ money, such as Nixon’s EPA. They had the resources and therefore the patronage. A new self-sustaining political class had formed, insulated from the laws of science and economics, yet demanding sovereignty over both. Science was no longer a democracy of scholars seeking after truth; it was now an instrument of political power and control.
The creation of the UN IPCC was a cataclysmic event in the history of science. Here was a purely political body posing as a scientific institution. Through the power of patronage it rapidly attracted acolytes. Peer review soon rapidly evolved from the old style refereeing to a much more sinister imposition of The Censorship. As [Prof. Edward] Wegman demonstrated, new circles of like-minded propagandists formed, acting as judge and jury for each other. Above all, they acted in concert to keep out alien and hostile opinion. “Peer review” developed into a mantra that was picked up by political activists who clearly had no idea of the procedures of science or its learned societies. It became an imprimatur of political acceptability, whose absence was equivalent to placement on the proscribed list. As global warming alarmism stumbles inevitably towards the later stages of Langmuir’s Laws, its defenders have become increasingly shrill. The pressure on science, both from external politicians and internal quislings, has become intense. The question of whether science can ever recover its innocence is moot. After life as a harlot on the mean streets of political imperative, a return to the sanctity of the cloister looks out of the question. If so, humanity has forever lost a bright jewel in its culture. See Numberwatch here.
By Anthony Watts, Watts Up With That
“Catastrophic Shifts in Climate Feared if Change Occurs”. In case you missed it, this article in the New York Times illustrates what some scientists believe is a very serious issue, and they are speaking out on it. Here is a snapshot of the article:
See larger image here.
The article, as seen above, was published February 20th, 1969. See the date stamp at the bottom of the PDF.

You can read the entire article in PDF form at this link
There’s just one thing wrong with this article, besides that it is flat wrong. Oh I know, there will be those that insist it may come true. However, there’s one bit of context that is worth exploring. On the flip side, here is an article from 1922 where the ice is actually melting fast: Deja Vu all over again: climate worries of today also happened in the 20’s and 30’s.
Hat tip to: John Goetz
By David Archibald
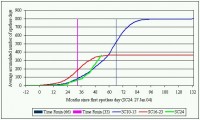
Jan Janssens of the Belgian Solar Section has kindly updated his graphs on the progression of the current minimum.
See larger image here.
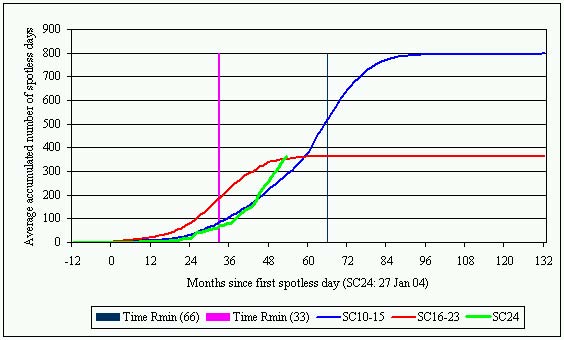
Jan Janssens’ Comments: According to the spotless-day-method, the current cycle transit mimics much better the transit of the old cycles 10-15 than that of the more recent cycles 16-23. Thus, a minimum could be expected in July 2009 +/- 6 months. According to the old-new-groups-method, SC23 seems to change tracks as expected. It is heading for a better tracking of the old cycles rather than that of the more recent ones. SC24 continues to follow the very slow rise of the old cycles. Both evolutions indicate a break-even of the old/new groups at year’s turn, with a minimum in November 2008 +/- 6 months. No change from my initial prediction on 19 April 2008.
See larger image here.
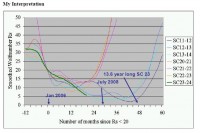
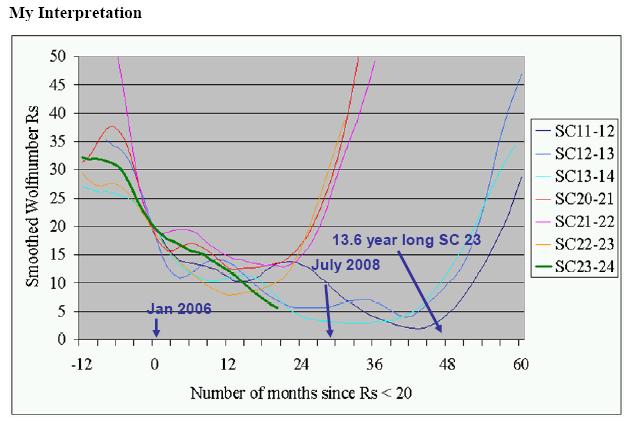
This is a Jan Janssens graph that I have annotated. Solar Cycle 23-24 minimum is tracking along with Solar Cycles 11 to 14 from the 19th Century. A 13.6 year length for Solar Cycle 23, equivalent to Solar Cycle 4, is within the realms of possibility. The reason why we are interested in the month of solar minimum is because it is the first physical sign of the potential amplitude of Solar Cycle 24, which in turn has climate consequences. It is apparent that Solar Cycle 23 is a long one. I agree with Jan Janssens’ spotless day-derived result of month of minimum being July 2009. If Solar Cycle 24 is as weak as I think it will be, then it will have a slow ramp up - much slower than the late 19th century cycles used for comparison.
This leads to another point. Solar cycles generally have four years of rise and seven years of decline. Solar Cycle 5 (the first half of the Dalton Minimum) had 6.9 years of rise and 5.4 years of decline. If Solar Cycle 24 mimics Solar Cycle 4 in this way, then year of maximum will be 2016, four years after the latest estimate from NASA’s solar prediction panel. There is another interesting parallel with the late 18th century. Solar Cycle 3 was an ultra short one at 9.2 years, much the same as Solar Cycle 22 at 9.6 years.
Climatic Impact: Each day’s passing of anemic Solar Cycle 24 sunspot activity reinforces the imminent cooling.
See larger image here. See full pdf here.
By Britt Weygandt, The Western Business Rounctable
The Western Business Roundtable urged Colorado Senator Ken Salazar (D-CO) to “check your fire on oil shale and give science and technlogy a chance to succeed so that America can achieve the tremendous promise of this huge American energy resource.” Britt Weygandt, Executive Director of the Western Business Roundtable, issued the statement in response to Senator Salazar’s continued opposition to even the issuance of preliminary environmental regulations to govern oil shale development on public lands.
Weygandt also praised the Bureau of Land Management for moving this week to increase U.S. energy security by publishing draft regulations to establish a commercial oil shale leasing program. “These proposed regulations are a critical step toward fostering the technology needed to develop this amazing resource in an environmentally and economically responsible manner,” said Weygandt. “It is dismaying that our own Senator Salazar is drawing very negative conclusions about oil shale without allowing the government to lay down the rules of the road so that technology development can proceed.”
“We are fortunate that the business sector has given strong commitments to develop this technology to address the questions concerning oil shale development,” Weygandt said. “This is very much a chicken-and-egg proposition without the government issuing preliminary environmental regulations to provide the rules of engagement, business will not be able to continue investing huge levels of capital into R&D.” “It is simply unreasonable to think that companies will be able to bear the huge capital expense involved in developing this technology to responsibly pursue oil shale resources without a viable commercial leasing program in place to justify the investment,” she added.
The Roundtable has long been a strong advocate for allowing BLM to finish its work to develop regulations providing for responsible oil shale development through commercial leasing of federal lands in the West because of the great potential oil shale offers,” Weygandt said. “This development could result in the addition of an estimated 800 billion barrels of recoverable oil from lands in the West, which represents about three times the proven reserves of Saudi Arabia,” she said. See release here.
By Sherwood, Keith and Craig Idso, CO2 Science
In a paper published in the Biological Sciences section of the Philosophical Transactions of the Royal Society in July of 2007, Morison et al. report that “agriculture accounts for 80-90% of all freshwater used by humans,” that “most of that is in crop production,” and that “in many areas, this water use is unsustainable.” As a result, they say that “farmers in many countries are now faced with legislative restrictions on use of water,” noting that the Chinese government “has set a target of a reduction of 20% in water use in agriculture by the year 2020,” such that “if food security for the region is not to be threatened, this must be achieved without a loss in production.” So how is this global food and water crisis to be met and overcome?
In their many pages of discussion of the subject, the four UK researchers examine the underlying relationships that connect crop carbon uptake, growth and water loss, noting that “much effort is being made to reduce water use by crops and produce ‘more crop per drop’.” Some of the topics they examine in the course of this discussion are designed to alter various crop characteristics that might possibly increase their water use efficiency, such as by genetic engineering, while others deal with crop management strategies, such as how and when to apply irrigation water.
Clearly, all of these approaches to getting “more crop per drop” out of our agricultural enterprises should be pursued. But what if we had a magical substance we could release to the air that would automatically lead to greater crop yields? And what if it produced those greater crop yields while using less water? And what if the many processes that put this super substance into the air were incredibly useful in their own right ... or even essential, both to our individual well-being and to the security of numerous nations?
Why, everyone would be clamoring for its release to the air, right? Wrong! Al Gore, for one, is adamantly against it. So is James Hansen, as are a host of climate alarmists, all of whom feel that the water-use-efficiency-enhancing carbon dioxide that is released to the air by the burning of coal, gas and oil—which is no different from what every one of us emits to the atmosphere with every breath we exhale—should not only not be allowed to continue to rise, but should be stopped in its tracks, all because tenuous speculations spawned by woefully inadequate computer-run climate models suggest that releasing more CO2 into the air will lead to catastrophic global warming.
Insanity is upon us, as real catastrophes lie at the doorstep, and as they are actually made worse by those who would fight imaginary ones. Read more here.
By Joseph D’Aleo, CCM, AMS Fellow
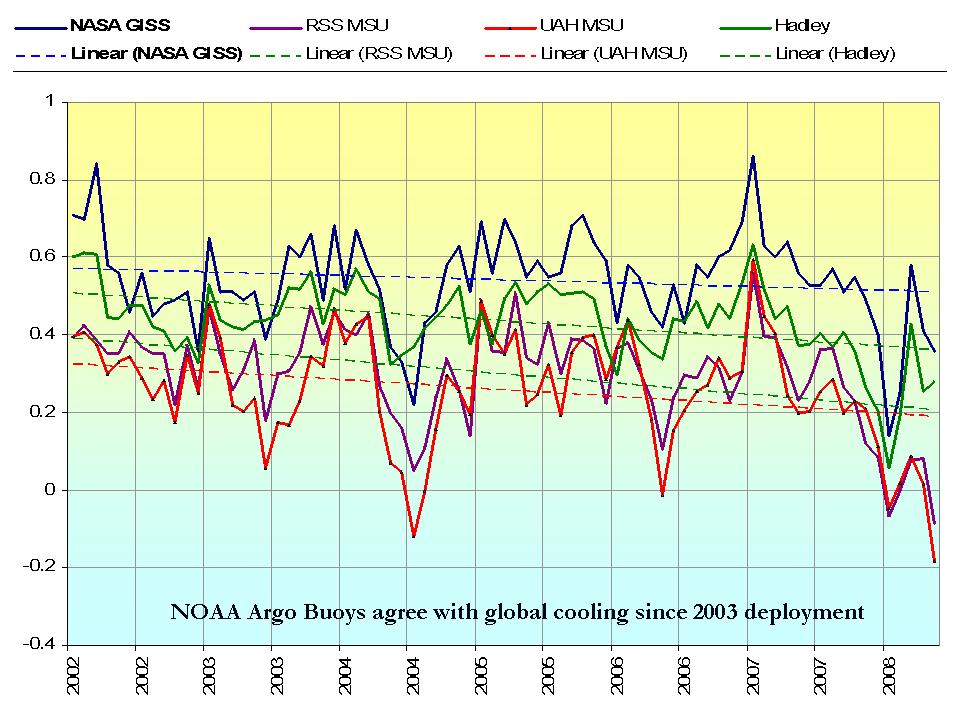
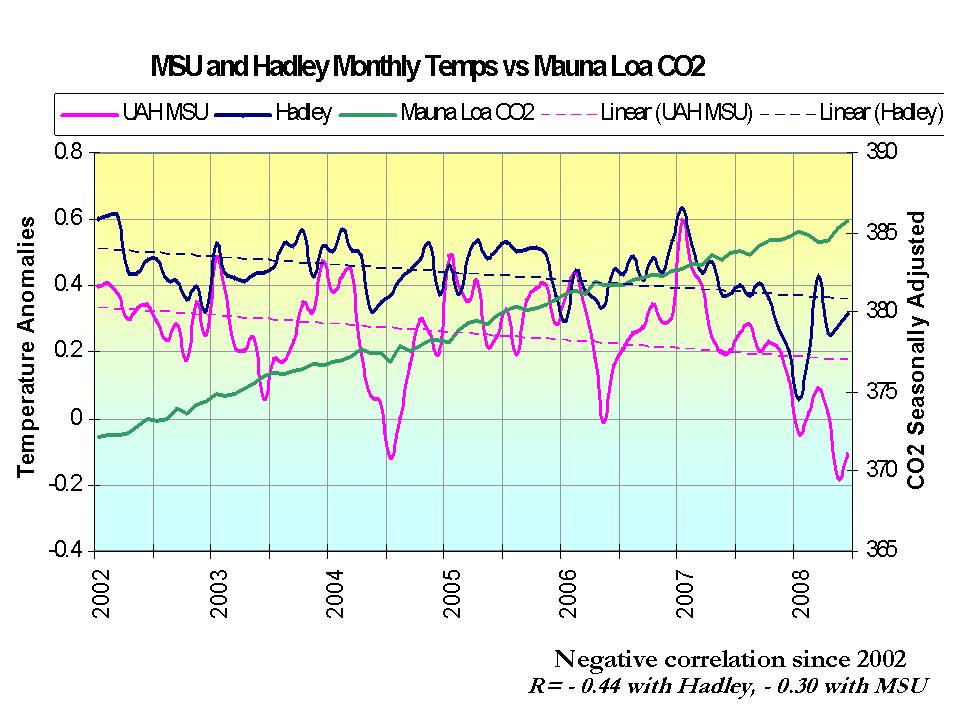
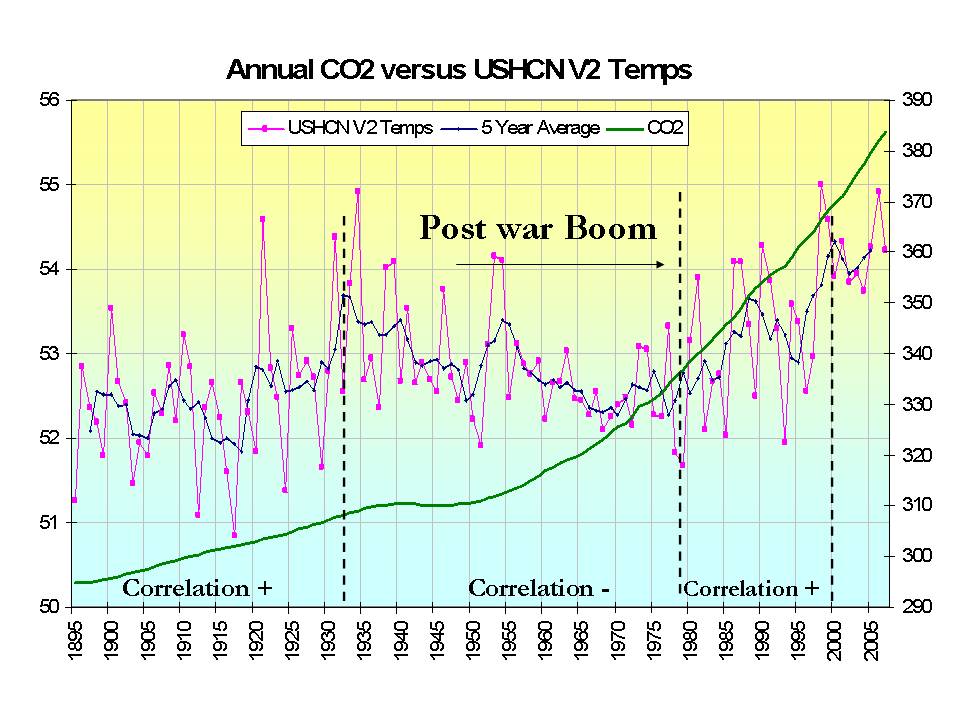
All the data sources have updated now for June. NOAA GHCN data was a clear outlier. NOAA called this the eighth warmest June on record for the globe in the 129 years since records began in 1880 with a positive anomaly of 0.5C (0.9F) for the month. The University of Alabama, Huntsville MSU satellite based global assessment reported that this June was the the 9th coldest in the 30 years of satellite record keeping (base period 1979-1998) with a value of -0.11C (-0.19F). The other NASA satellite source, RSS had June as the 13th coldest out of the last 30 years. Hadley came in today with their CRUV3 data update. They also were in disagreement with the satellite data sets with +0.316C, the 10th warmest June. However both the Hadley and MSU do show a downtrend since 2002 of 0.15 to 0.2C with a rather strong negative correlation (r = - 0.44 with Hadley) with CO2 which increased 3.5% over the period.
See larger image here
Recall the CO2 was negatively correlated for almost 4 decades from the 1940s through the 1970s. It was positively correlated from 1900 to 1930s and again 1979 to 1998. This on-again, off-again relationship suggests CO2 is not driving the climate bus but maybe a passenger in the back.
See larger image here
OK, but why the discrepancy of satellite and surface based data bases? Though there has clearly been some cyclical warming in recent decades, the global surface station based data is seriously compromised by urbanization and other local factors (land-use /land-cover, improper siting, station dropout, instrument changes unaccounted for and missing data) and thus the data bases overestimate the warming. Numerous peer-reviewed papers (referenced at end) in the last several years have shown this overestimation may be the order of 30 to 50%. I believe the recent warming is comparable or less than the warming in the 1930s and is now over. See a detailed analysis of this issue here.
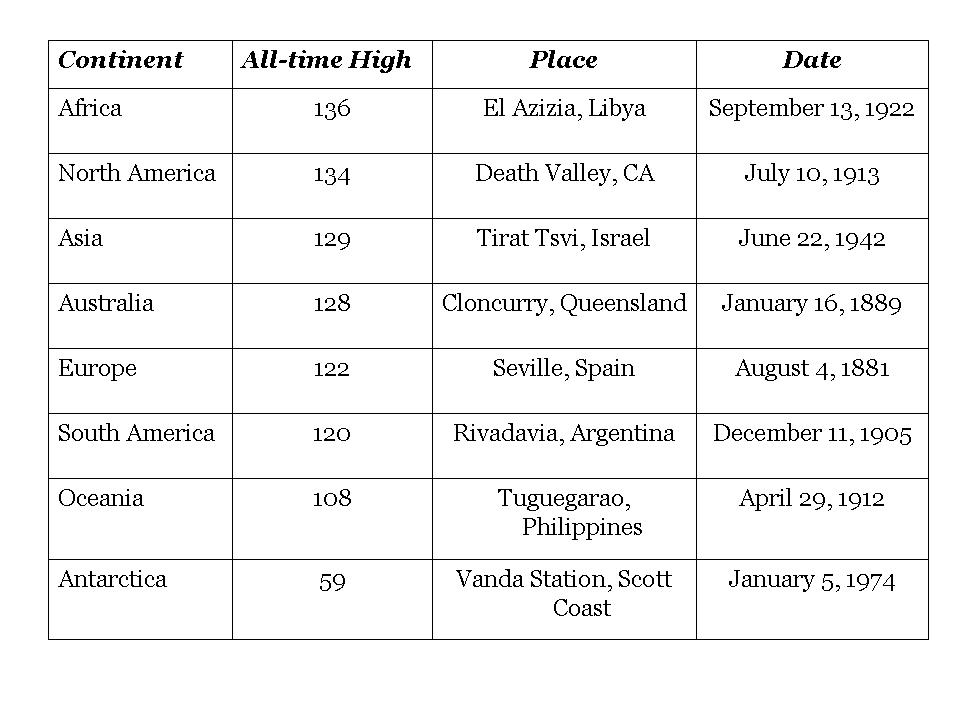
Even the global continental extremes show no recent decade represented. All the heat records were before 1950 with the exception of Antarctica which showed its warmest temperature in 1974. There probably was very little monitoring in prior years there.

See larger image here. See much more here.
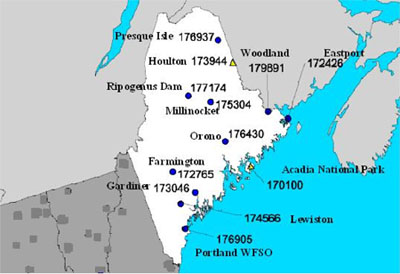
As a follow-up to the posting on the NOAA/NASA data debacle, three posts worth your attention courtesy of posters and commenters on Watts Up With That. First John Goetz has another excellent post called Cedarville Sausage. Then there is a guest post from an old-time observer Fabricating Temperatures on the DEW Line. The third is this post about data in the State of Maine by a volunteer John Simmons, for surfacestations.org, working with the Kristen Byrnes foundation.
Everyone has heard the term, “creating something from thin air.” Now there is a new term, “creating climate data from junk.” Last summer, volunteers from the Kristen Byrnes Science Foundation completed surveys of the United States Historic Climate Network (USHCN) temperature stations in Maine that are used to measure Global Warming. The results of the station surveys were astonishing and reinforced results from the rest of the country; there is a huge quality problem with data used to support the current global warming theory. Over 44% of the 1221 USHCN stations have been surveyed, and 89% of those are improperly located. Additionally, a statistical analysis of the remaining stations shows them to be warmer, so the worst are yet to be surveyed.
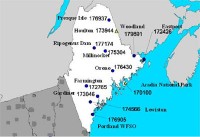
Map of Maine with temperature stations by name and NCDC ID #. See larger map here.
None of the stations in Maine were free of microclimate or urbanization biases. 8 examples are provided along with images in this post. The station at Orono, Maine pictured below is located on the roof of a 4 story university building near a, chimney and furnace exhaust, and above several window mounted air conditioners.

One USHCN station that KBSF did not survey was station number 17714, Ripogenus Dam in Maine, a station that closed 13 years ago. The last original observers report filed was for the month of November, 1995. Despite being closed in 1995, USHCN data for this station is publicly available until 2006 at the CDIAC website. The plot below was taken directly from the CDIAC website and clearly sources the data to some of the most prominent climate scientists in the world.
See larger graph here.
So how is that? The station closed in 1995 but the data continues until 2006? Did some of the world’s leading climate scientists create the data from thin air? Well, not exactly. Part of the USHCN data is created by a computer program called “filnet” which estimates missing values. According to the NOAA, filnet works by using a weighted average of values from neighboring stations. Filnet is applied after a homogeneity adjustment which is not designed to find many of these problems. Imagine that, the worlds leading climate scientists creating temperature data from surrounding stations which are biased by barbecues, bodies of water, wind blocks, jet engines, pavement, roof tops, air conditioner exhausts, inversion layers, non-standard equipment, urban heat islands, automobiles and chimneys.
They didn’t create climate data from thin air; they created it from junk. Again see this full post.
By P.J. Gladnick, Newsbusters
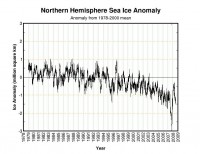
Good news! Despite the recent global warming alarmism in the media that Arctic ice might melt away completely from the North Pole this summer, the latest scientific observations show that Arctic ice has actually increased by nearly a half million square miles over this time last year. This is in stark contrast to the Chicken Little hysteria that was being promoted less than a month ago on the CBS Early Show as reported by Kyle Drennen on June 27 here in NewsBusters: On Friday’s CBS “Early Show,” co-host Maggie Rodriguez teased an upcoming interview with former British Prime Minister Tony Blair about global warming: “Also ahead this morning, we’ll talk about a disturbing new report from some scientists in Colorado who say that there is the very real possibility that for the first time we will see the ice in the North Pole melt away completely during the summer.”
Well, the latest information on Arctic ice conditions is just in from the National Snow and Ice Data Center and Maggie Rodriguez can breath easy: Arctic sea ice extent on July 16 stood at 8.91 million square kilometers (3.44 square miles). While extent was below the 1979 to 2000 average of 9.91 square kilometers (3.83 million square miles), it was 1.05 million square kilometers (0.41 million square miles) above the value for July 16, 2007. So why the increase in the ice shelf over last year despite the MSM hysteria on this topic? An explanation is given: How is this different from what we saw in the record-breaking year 2007? In early July 2007, an atmospheric pattern developed that featured high pressure over the Beaufort Sea. This pattern promoted especially strong sea ice loss. The pattern that has dominated the summer of 2008, so far, seems less favorable for ice loss.
See larger graph here
So won’t Maggie Rodriquez and other global warming alarmists be excited over this news about increased ice in the Arctic this summer? Don’t hold your breath. Rodriguez and others in the MSM will probably just let their original dire global warming predictions stand without any later corrections when the scientific facts prove them wrong. Read more here.