


By Anthony Watts, Watts Up with That
After going days without counting the August 21/22 “sunspec” SIDC Brussels now say it was NOT a spotless month!
They officially counted that sunspeck, after all. It only took them a week to figure out if they were going to count it or not, since no number was assigned originally.
But there appears to be an error in the data from the one station that reported a spot, Catania, Italy. No other stations monitoring that day reported a spot. Catania reports a spot in the southern hemisphere that day, but there was not one seen by anyone else.
For example, at the 150 foot solar solar tower at the Mount Wilson Observatory, the drawings from those dates show no spots at all: See those drawings here and here.
Inquires have been sent, stay tuned. Here is an exchange in comments from Leif Svalgaard.
REPLY: So What gives Leif? You yourself said these sunspecks weren’t given a number. I trusted your assessment. Hence this article. Given the Brussels folks decided to change their minds later, what is the rationale ? - Anthony
The active region numbering is done by SIDC, not by Brussels. The Brussels folks occasionally disagree. In this case, they did. Rudolf Wolf would not have counted this spot. Nor would I. What puzzles me is this:
21 7 4 3
22 8 4 4
The 3rd column are ‘spots’ in the Northern hemisphere, and the 4th column are ‘spots’ in the Southern hemisphere [both weighted with the ‘k’-factor: SSN = k(10g+s)]. But there weren’t any in the south. The Catania spot was at 15 degrees north latitude, IIRC. Maybe the last word is not in on this.
Hmm. Apparently there’s some backstory to this. - Anthony. See more here.
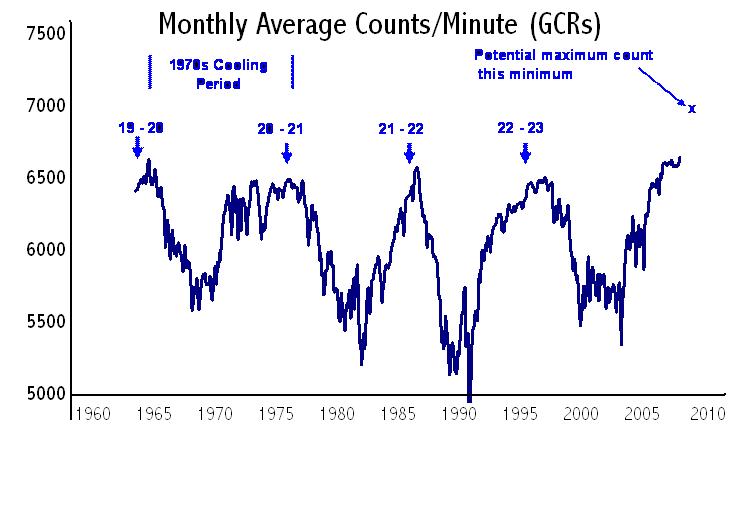
Icecap Update: The official SIDC number may come in at 0.2 which has occurred twice since 1913 in 1933 and 1954. I received this interesting e-mail from David Archibald today about the cosmic rays which are at the highest levels since 1963 do to this low solar activity and likely to go higher. More cosmic rays provide more seed nuclei for clouds in Earth’s atmosphere. More clouds mean a greater albedo and less terrestrial solar radiation, which translates to lower temperatures.
“One thing to keep up with is the neutron monitor count. I follow Oulu. The month of August has had the highest count since 1963. We are still nine months off solar minimum and the count might continue to rise for a year after that. I am predicting a maximum count for this solar minimum of 6,900 in mid-2010.
See larger image here
The delay from solar minimum is because it takes a year, not a village, for the solar wind to get to the heliopause, and for the GCRs to come back in. The solar minima are marked. Note the high solar count associated with the 1970s cooling period. Real world application of Svensmark’s theory is happening now.”
by Joseph D’Aleo, CCM, Fellow
The Sun is a variable star with changes in levels of activity including brightness and eruptive activity that varies on periods of 11, 22, 53, 88, 106, 213, and 429 years. Direct and indirect solar factors affect the earth’s temperatures. Some arrogantly discount the importance of the sun in observed global temperature changes, promoting the idea that man is responsible for our climate extremes and variability. Whereas we do have influence on a local and regional basis through urbanization and land use changes, the big global scale changes are natural and ultimately are solar driven.
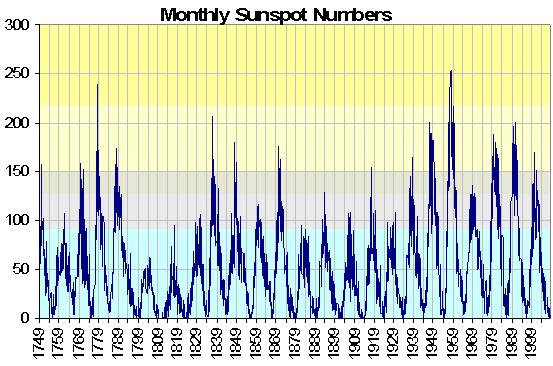
The oldest measure of solar variance is the number of sunspots visible on the sun observed since the days of Galileo and the first telescopes on a daily basis. Sunspots are dark spots (cooler than the photosphere average, which lower irradiance by 0.1%). They are accompanied by bright flares and faculae which are warmer than the average surface (and increase irradiance by 0.2%). The net result of an active sun is that it is a little brighter (0.1%) and thus warmer. The cycles of the monthly sunspot number is quite evident on the following plot with data from NOAA’s National Geophysical Data Center (NGDC).
See larger image here.
The 11 year cycle can be seen to vary in its amplitude and length (in the range from 9-14 years). The longer cycles tend too be associated with and followed by cycles of smaller amplitude. Cycle 23 which peaked in 2000 is ending. But uncharacteristically, cycle 24 has yet to assert itself, although there were a few months back a few small spots with cycle 24 polarity (the polarity reverses across the solar equator and from one cycle to the next (why there is a 22 year cycle).
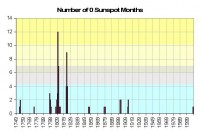
This month (August 2008) has had an international sunspot number of 0 through the reports this morning of the 31th. If that continues the rest of the day, it will mark the first time since 1913, we have had a 0 sunspot calendar month (there have been more 30 day intervals without sunspots as recent as 1954 but they have crossed months). Following is a plot of the number of months with 0 sunspots by year over the period of record - 23 cycles since 1749.
See larger image here.
Note that cluster of zero month years in the early 1800s (a very cold period called the Dalton minimum - at the time of Charles Dickens and snowy London town and including thanks to Tambora, the Year without a Summer 1816) and again to a lesser degree in the early 1900s. These correspond to the 106 and 213 year cycle minimums. This would suggest that the next cycle minimum around 2020 when both cycles are in phase at a minimum could be especially weak. Even David Hathaway of NASA who has been a believer in the cycle 24 peak being strong, thinks the next minimum and cycle 25 maximum could be the weakest in centuries based on slowdown of the plasma conveyor belt on the sun.
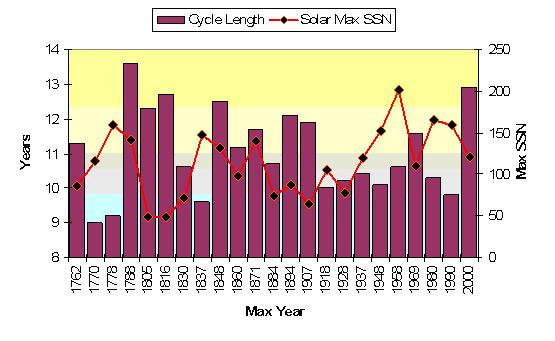
In this plot of the cycle lengths and sunspot number at peak of the cycles, assuming this upcoming cycle will begin in 2009 show the similarity of the recent cycles to cycle numbers 2- 4, two centuries ago preceding the Dalton Minimum. This cycle 23 could end up the longest since cycle 4, which had a similar size peak and also similarly, two prior short cycles.

See larger image here.
See much more in this updated pdf story here.
By Mike Coppock, Newsmax
Sarah Palin has emerged as John McCain’s vice-presidential running mate. Palin talked to Newsmax magazine for its upcoming September 2008 issue about Alaskan oil, global warming, and John McCain. Alaska Gov. Sarah Palin is a God-fearing, gun-toting former beauty queen who could just become America’s next vice president. In Alaska, the right to bear arms means staying on top of the food chain. Palin, a lifelong member of the National Rifle Association, hunts, shoots, and fishes. Husband Todd holds a commercial fishing license for salmon. In the mid-1990s, when Todd got a job working on Alaska’s North Slope, Palin decided to occupy herself by becoming mayor of Wasilla, the state’s fastest-growing community.
As mayor, she gradually grew frustrated with Alaska’s “good ol’ boy” style of governance—so she decided to do something about it. She ran for governor in 2006 and won, defeating popular former Democratic Gov. Tony Knowles. Palin’s victory made her Alaska’s first female chief executive, and its youngest. Now, many insiders believe this 44-year-old mother of five would add a strong conservative presence to the GOP ticket. Palin tells Newsmax that it’s high time Congress allows the development of Alaska’s wealth of oil and gas. She doubts global warming stems from human activity, and she considers herself both a fiscal and social conservative.
How did you pull off your election victory as governor?
Alaska was ready for a positive change and tired of the good ol’ boy network. It caused many Alaskans to lose faith in their government. People want faith in their government. I have been able to pass a comprehensive reform law and place the state’s checkbook online. You can be a reformer and also be a conservative.
And your stand on abortion?
I’m pro-life. I’ll do all I can to see every baby is created with a future and potential. The legislature should do all it can to protect human life.
Politically, how would you describe yourself?
Fiscally and socially, I am a conservative. My respect for the three different branches of government and the balance between them has been my guide.
If you were running for president, what causes would you champion?
I would push for a strong military and a sound energy policy. I believe that Alaska can help set an example on energy policy.
Speaking of energy, how much oil and gas does America really have?
We have billions and billions of barrels of oil and trillions of feet of natural gas. We have so much potential from tapping our resources here in Alaska. And we can do this with minimum environmental impact. We have a very pro-development president in President Bush, and yet he failed to push for opening up parts of Alaska to drilling through Congress—and a Republican-controlled Congress, I might add. I thought when we hit $100 a barrel for oil it would have been a psychological barrier that would have caused Congress to reconsider, but they didn’t. Now we are approaching $200 a barrel. It’s nonsense not to tap a safe domestic source of oil. I think Americans need to hold Congress accountable on this one.
What is your take on global warming and how is it affecting our country?
A changing environment will affect Alaska more than any other state, because of our location. I’m not one though who would attribute it to being man-made.
See Newsmax here. See also this CNBC video interview of Governor Palin. See Palin battle North Carolina Rep. Brad Miller over the listing of the polar bear as an endangered species here.
By Dr. Michael J. Economides and Art Horn in the China Daily
The Beijing Olympics came and went spectacularly, as most of us China watchers had expected, and most Chinese are understandably proud of their country and pleased with how it came through during the Games. But some Chinese cannot resist the temptation to shout to the world, to all those doubting pre-Olympic Thomases: Where were the terrorists? How many people died from our food? How many athletes were impaired by the smog with more world records broken than at any other Olympics in recent memory?
Surely many Chinese and perhaps even government officials may attribute the pre-Games adverse publicity to agitators or to people that hate China or racists or even those jealous of the country’s recent achievements. But that would be too simplistic and the entire sordid affair may be too hard to understand across cultures. In fact, China’s recent headache may actually translate into a cancer and, surprisingly, not in that country but in the West. It says a lot about the press and how it can be relied upon for many things, not just the Beijing Olympics.
It may shock many people but the major television networks, newspapers, magazines and other media in the West are not in the truth business, they are in the news business. This is not to say they are in the habitual lying business but what they consider to be news and truth is blurred due to the need to produce a profit in a “climate” of shrinking revenues. “If it bleeds it leads” meaning if the story has blood and drama it will be the first one on the news. For example, global warming stories are now bleeding all over the headlines. So you are telling me all those stories about drowning polar bears, bigger hurricanes, more droughts, increased wild fires and melting polar caps might not be true? Right.
News as a money-making private business is by its very nature a compilation of dramatic, captivating and often tragic events. Without those events a newscast would be rather boring to a great many people. Dramatic pictures of life and death events make news exciting and compelling. All of these events are bad news for humanity and the planet but good news for the news business. News organizations are in the bad news business.
Ever since the early 1980s the numbers of people watching the major networks, especially in the United States, have been dropping. The introduction of cable TV was a double-edged sword. It gave the networks a better, more consistent, picture to viewers but on the other hand helped introduce competition from smaller channels like CNN, the Weather Channel and ESPN. Then came the Internet allowing people to go even further away. The result is fewer viewers and lower revenue.
Disasters real or, especially imagined, are just too good a hook to throw away with objective reporting. Crisis is a word used over and over again. There is a real crisis developing but it is not in AIDS, global warming or the Beijing Olympics. It is in the credibility of magazines, newspapers and television. The tragedy is that presumably responsible politicians and leaders in many Western countries become hostage of alarmist news and thus some outrageous nonsense becomes indistinguishable from reality. Read full story here.
Michael J. Economides is the editor-in-chief of the Energy Tribune, and Art Horn is a meteorologist who has worked for CBS, ABC, NBC and PBS
By William Livingston and Matthew Penn, National Solar Observatory, Tucson, AZ
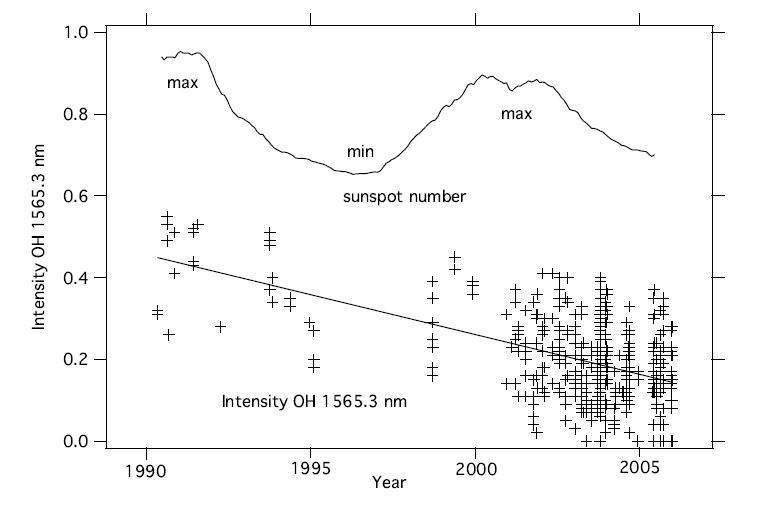
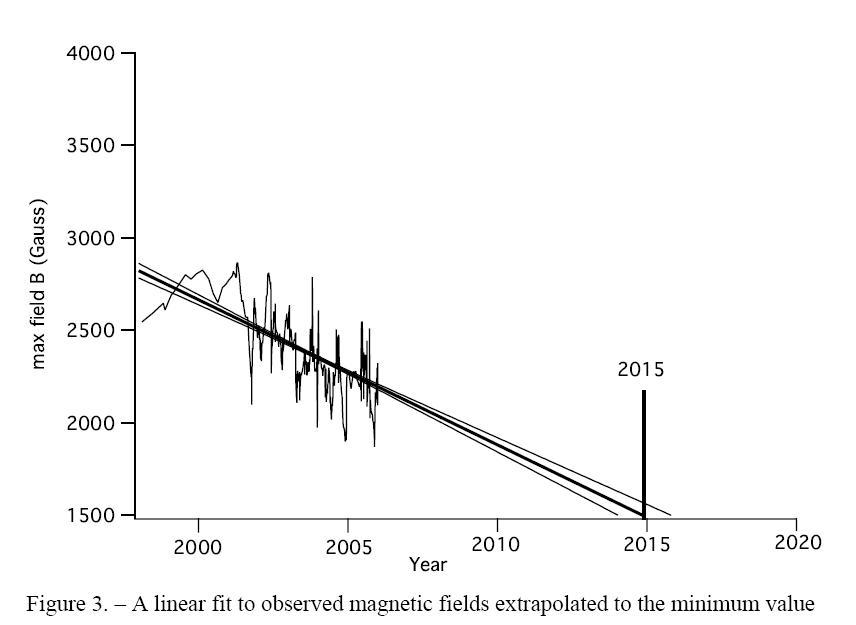
We have observed spectroscopic changes in temperature sensitive molecular lines, in the magnetic splitting of an Fe I line, and in the continuum brightness of over 1000 sunspot umbrae from 1990-2005. All three measurements show consistent trends in which the darkest parts of the sunspot umbra have become warmer (45K per year) and their magnetic field strengths have decreased (77 Gauss per year), independently of the normal 11-year sunspot cycle. A linear extrapolation of these trends suggests that few sunspots will be visible after 2015.
Sunspots are cool dark regions on the solar surface with strong magnetic fields. There have been few direct measurements of changes in the physical parameters of sunspots, but here we present a study which shows that sunspots are becoming warmer and have weaker magnetic fields. The number of sunspots visible on the Sun normally shows an 11-year periodicity, and the current sunspot cycle (cycle 23) had a maximum in 2001, and is entering a minimum phase with few sunspots currently visible. Our data show that there are additional changes occurring in sunspots, independent of the sunspot cycle, and these trends suggest that sunspots will disappear completely. Such an event would not be unprecedented, since during a famous episode from 1645-1715, known as the Maunder Minimum, the normal 11-year periodicity vanished and there were virtually no sunspots visible on the solar surface (Eddy 1976). Recent studies of the appearance rate and latitudinal drift of sunspots (Hathaway et al., 2004) and of the solar magnetic field (Svalgard etal, 2005) predict that the number of sunspots visible in future cycles will be significantly reduced. Finally the occurrence of prolonged periods with no sunspots is important to climate studies, since the Maunder Minimum was shown to correspond with the reduced average global temperatures on the Earth (Foukal et al., 1990).

The line depth of OH 1565.3 nm for individual spots. The upper trace is the smoothed sunspot number showing the past and current sunspot cycles; the OH line depth change seems to smoothly decrease independently of the sunspot cycle. See full size image here
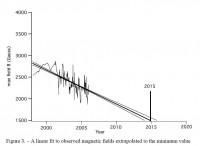
A linear fit to observed magnetic fields extrapolated to the minimum value observed for umbral magnetic fields. See full size image here
Leif Svalgard noted on Solar Cylce 24 forum relative to this paper that “There was a tiny pore on Aug 22nd, 2008. Bill Livingston measured its magnetic field and tells me today that it was 1931 Gauss. You may verify for yourself that that falls straight on his projected line. BTW, he has many other data points now between the last data shown on the plot and this latest one, and they also confirm the trend.”
See full paper here and Astroengine.com review of it here.
By David Dilley, Meteorologist
In the peer reviewed book “Global Warming—Global Cooling, Natural Cause Found”, meteorologist and climate researcher David Dilley utilizes nearly a half million years of data linking long term gravitational cycles of the moon explain the recent global warming, rises in carbon dioxide levels, and for 2200 global warming cycles during the past half million years.
The gravitational cycles are called the Primary Forcing Mechanism for Climate (PFM), and act like a magnet by pulling the atmosphere’s high pressure systems northward or southward by as much as 3 or 4 degrees of latitude from their normal seasonal positions, and thus causing long-term shifts in the location of atmospheric high pressure systems.
Research by Mr. Dilley shows a near 100 percent correlation between the PFM gravitational cycles to the beginning and ending of global warming cycles. Global warming cycles began right on time with each PFM cycle during the past half million years, as did the current warming which began 100 years ago, and it will end right on time as the current gravitational cycle begins its cyclical decline.
Global temperatures have cooled during the past 12 months. During 2008 and 2009 the first stage of global cooling will cool the world’s temperatures to those observed during the years from the 1940s through the 1970s. By the year 2023 global climate will become similar to the colder temperatures experienced during the 1800s.
Mr. Dilley of Global Weather Oscillations has found seven different types of recurring gravitational cycles ranging from the very warm 460,000 year cycle down to a 230 year recurring global warming cycle. All of the gravitational cycles coincide nearly 100 percent with 2200 global warming events during the past half million years. This includes the earth’s current warming cycle which began around the year 1900, and the first stage of global cooling that will begin during 2008 and 2009.
The release of the book “Global Warming- Global Cooling, Natural Cause Found” culminates 19 years of research clearly linking gravitational cycles as the cause for fluctuations within the earth’s climate. The book is available as an electronic e-Book on this website. The author David Dilley is a meteorologist and climate researcher with Global Weather Oscillations Inc. (GWO), former meteorologist with the National Weather Service, and co-host of the radio program “the Politically Incorrect Weather Guys” airing weekly on RadioEarNetwork.com, an internet streaming radio program. Read more here. He also believes a moderate El Nino will occur this fall. See here.
Icecap Note: Ian Wilson has found a similar correlation between planetary/gravitational cycles and the major ocean oscillations, the PDO and NAO in this powerpoint.
Dr. Gary Sharp of Its All About time forwarded them to us with note “Two independently originated studies that provide useful insights about the future. Both studies agree well with what the Russian folks have been using to make projections about the future rise and fall of regional fisheries species - but they could not identify the causal forces - just the natural cycles. Read, learn, and enjoy the warmth - while it is still here...!”
Read more cooling stories here.
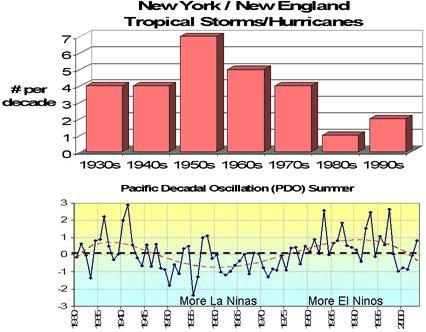
Hurricanes and the NortheastBy Joseph D’Aleo, CCM, Fellow of the AMS
Since 1995, the Atlantic has become twice as active on average as the prior 25 years, similar to the period from 1930s to 1960s. This is due to a shift to the “warm” mode of the multi-decadal scale oscillation in the Atlantic Ocean Most of the storms making landfall during the past 12 years have impacted the Mid-Atlantic region, Florida and the Gulf of Mexico. However, though not yet realized, history tells us that the risk has also increased for more populated areas to the north New York City/(Long Island and New England).
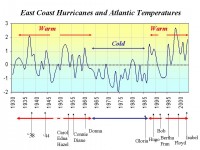
See large image here
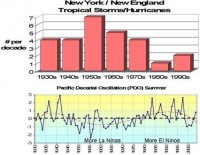
It appears the Pacific plays a role too. The cold mode of the PDO (in place this summer) favors New York and New England landfalls in large part because it favors La Nina. We had a strong La Nina this past winter into the early spring but it has in recent months, warmed in the eastern tropical Pacific. It is unclear whether that will save the east coast and the northeast one more year.
See large image here
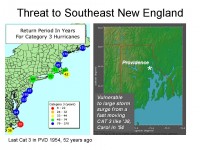
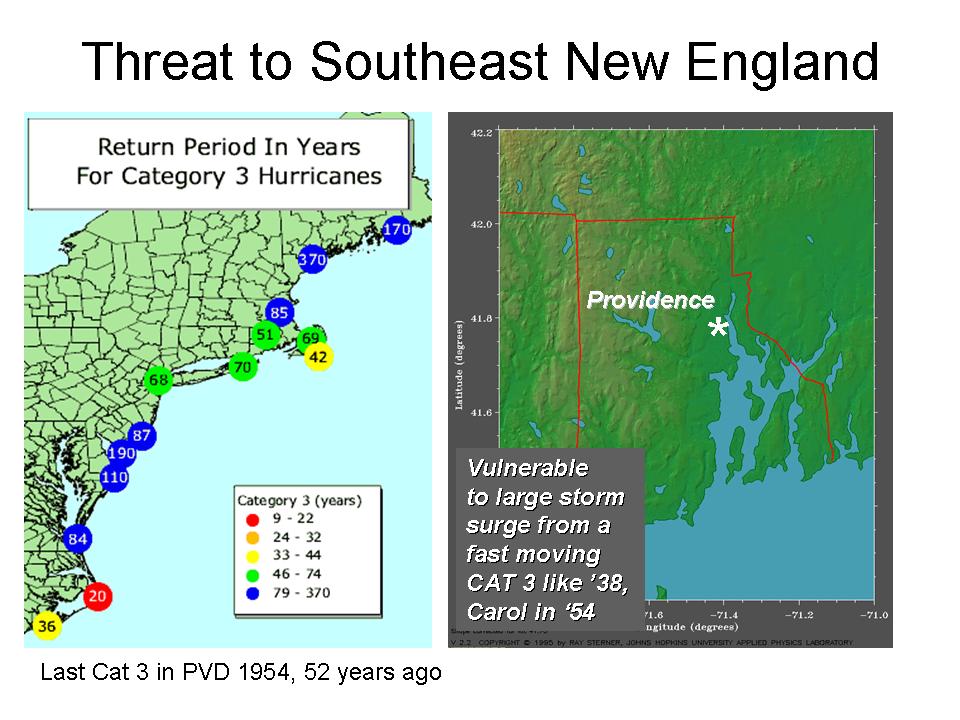
See what would happen if a hurricane of ‘38 were to repeat or worse yet land a direct hit on New York City here. Included are storm surge animations. A CAT 3 storm on such a track could be a $100 billion storm. A track more to the east into southeastern New England would do a lot of damage to the expensive real estate and commercial properties that have exploded across the areas after the last major hurricane (Carol) hit in 1954. Read more about a southeastern New England hit here.
The media would of course blame such a storm on global warming even though there have been similar storms recorded ever since America was first settled. The unprecedented cost would be the result of the explosive growth of the population in these attractive but vulnerable areas. 80% of the population in the northeast have never experienced a major hurricane. Everyone has seen on television the results of recent major storms like Katrina but many believe we can’t get a storm like that in the northeast. History says otherwise.
See large image here
Wall Street Journal
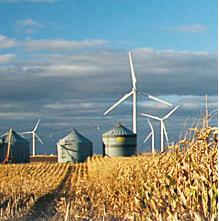
In this year’s great energy debate, Democrats describe a future when the U.S. finally embraces the anything-but-carbon avant-garde. It turns out, however, that when wind and solar power do start to come on line, they face a familiar obstacle: environmentalists and many Democrats. To wit, the greens are blocking the very transmission network needed for renewable electricity to move throughout the economy. The best sites for wind and solar energy happen to be in the sticks—in the desert Southwest where sunlight is most intense for longest, or the plains where the wind blows most often. To exploit this energy, utilities need to build transmission lines to connect their electricity to the places where consumers actually live. In addition to other technical problems, the transmission gap is a big reason wind only provides two-thirds of 1% of electricity generated in the U.S., and solar one-tenth of 1%.
Only last week, Duke Energy and American Electric Power announced a $1 billion joint venture to build a mere 240 miles of transmission line in Indiana necessary to accommodate new wind farms. Yet the utilities don’t expect to be able to complete the lines for six long years—until 2014, at the earliest, because of the time necessary to obtain regulatory approval and rights-of-way, plus the obligatory lawsuits. In California, hundreds turned out at the end of July to protest a connection between the solar and geothermal fields of the Imperial Valley to Los Angeles and Orange County. The environmental class is likewise lobbying state commissioners to kill a 150-mile link between San Diego and solar panels because it would entail a 20-mile jaunt through Anza-Borrego state park. “It’s kind of schizophrenic behavior,” Arnold Schwarzenegger said recently. “They say that we want renewable energy, but we don’t want you to put it anywhere.”
Wind power has also become contentious in oh-so-green Oregon, once people realized that transmission lines would cut through forests. Transmissions lines from a wind project on the Nevada-Idaho border are clogged because of possible effects on the greater sage grouse. Similar melodramas are playing out in Arizona, the Dakotas, the Carolinas, Tennessee, West Virginia, northern Maine, upstate New York, and elsewhere.
In other words, the liberal push for alternatives has the look of a huge bait-and-switch. Washington responds to the climate change panic with multibillion-dollar taxpayer subsidies for supposedly clean tech. But then when those incentives start to have an effect in the real world, the same greens who favor the subsidies say build the turbines or towers somewhere else. The only energy sources they seem to like are the ones we don’t have. Read more here.
By: Roger Pielke, Jr., Prometheus Blog
Here at Prometheus we have for years closely followed the controversy over the so-called temperature reconstruction “hockey stick.” So it was with some interest that I saw this blog post linked from Climate Audit, apparently written by a Scottish libertarian blogger called Bishop Hill. Hill writes of the recent years of the hockey stick debate: “The story is a remarkable indictment of the corruption and cynicism that is rife among climate scientists, and I’m going to try to tell it in layman’s language so that the average blog reader can understand it.”
And indeed Hill’s post is well-written, and accurate as far as I can tell. Of course, such stories have as many sides as there are participants, so if any of those involved including Steve McIntyre or Caspar Ammann would like to post or comment here, they’d be welcome.
Long-time readers will recall that in the fall of 2005 we issued a challenge to Steve McIntyre and Michael Mann, the lead protagonists on either side of the debate, to explain to us policy-oriented folks why we should care about their very public squabbling.
Steve McIntyre took us up on our challenge (as did his collaborator Ross McKitrick). Michael Mann declined the invitation. McIntyre explained that the debate over the hockey stick mattered not because of its direct relevance to the debate over what to do about global warming, but because of matters of what we call around here “science policy"- peer review, public confidence in science, and simply getting this right rather than wrong. McIntyre explained that if he were the head of the IPCC,
“I would be particularly angry at being placed in a position where I used this logo and wasn’t fully informed about adverse information pertaining to it. I also wouldn’t be leaving it up to some probably adversarial committee like the Barton Committee to sort this out. I’d be all over the problem so that my community, the community of climate scientists, was not further embarrassed and so that government institutions would be able to rely confidently on the opinions of IPCC.”
In response to the Bishop Hill piece McIntyre writes: “There’s a definite foolhardiness and contemptuousness of the public by the IPCC and, in particular, the core of the Hockey Team. Every step of the process has been publicly documented. You’d think that they’d have been extra diligent in their reviewing. Instead, what we see is one thing botched after another and one sly manouevre after another. If this is representative of how climate articles are written and how climate peer reviewing is done, what a pathetic performance.”
I agree. Having collaborated a bit with Steve McIntyre in recent years, and seen how the community reacts to him in the peer review process, I have seen some of the frothing and irrationality that he stirs. Further, as a long-time observer of this debate, how the more vocal climate science community has dealt with the criticisms of the Hockey Stick and McIntyre’s determined efforts is really an embarrassment to all of the hard-working and brilliant scientists who work out of the limelight trying to advance knowledge in a rigorous manner. The problem is that the behavior of the few reflects upon the community as a whole.
McIntyre may never get the recognition that he deserves from the climate science community (though some, like Peter Webster and Judy Curry have shown leadership by recognizing Steve’s legitimacy, and apparently taken their lumps for it), but within science policy circles it is becoming increasingly clear that has made a significant contribution to upholding the integrity of climate science, and for this he should be applauded.
See more and take not of comments #2 by Willis Eschenbach and others including Pat Michaels #16 here.
By Joseph D’Aleo, CCM, Fellow AMS
As Roger Pielke Sr. reported “This US Climate Change Science Program (CCSP) report is Co-Chaired by Thomas R. Karl, Jerry Melillo, and Thomas C. Peterson with the Senior Editor and Synthesis Team Coordinator Susan J. Hassol. These are the same individuals who have led past CCSP reports (e.g. see and see), with Tom Karl and Tom Peterson deliberately excluding scientific perspectives that differ from their viewpoints (i.e. see). Susan Hassol was writer of the HBO Special “Too Hot Not to Handle”. This HBO show clearly had a specific perspective on the climate change issue, and lacked a balanced perspective. The HBO Executive Producer was Ms. Laurie David. A clear real conflict of interest is obvious.”
Anthony Watts echoed Roger “To say the least, I’m shocked that NCDC’s leadership has changed from being the nation’s record keeper of weather and climatic data, to being what appears to me now as an advocacy group. The draft document reads more like a news article in many places than it does a scientific document, and unlike a scientific document, it has a number of what I would call “emotionally based graphics” in it that have nothing to do with the science.”
The hand-picked authors are all of one mind in this issue. They include Ben Santer who single handedly reversed the climate science of the IPPC 2nd Assessment and Jonathan “we have to get rid of the Medeival Warm Period” Overpeck.
Bob Davis University of Virginia suggested this preface to the CCSP:USP
“This report is not intended to be an unbiased review of climate change science; rather, it is a political document that emphasizes the worst possible theorized impacts of climate change in the hopes that the U.S. Government will use this report in support of a decision to regulate carbon dioxide emissions.”
I personally or jointly sent in 9 comments. There were hundreds of submitted comments. We have posted some on Icecap (in box “Search Icecap” insert CCSP). Another site is putting together a list of submitted comments. We will announce when that is available with link.
Comment #1: Data Integrity Problems Contaminate The Historical Record That Is The Underpinning Of The Entire Report can be found here.
Comment #2: Heat Waves can be found here.
Comment #3: Northeast Regional can be found here.
Comment #4: Key Finding #9, “The Past Can No Longer Be used to Predict the Future” can be found here.
Comment #5: “Global warming is unequivocal and is due primarily to human-induced emissions of heat-trapping gases and other pollutants” can be found here.
Comment #6: “Arctic sea ice and the large ice sheets on Greenland and parts of Antarctica are melting faster than expected” can be found here.
Comment #7: “Warming is causing sea-level to rise as land-based ice melts and the warmer oceans expand. Many of these observed changes are occurring more rapidly than projected even a few years ago” can be found here.
Comment #8: NW Regional (with George Taylor) can be found here
Comment #9: Bias Towards Negative Effects While Ignoring Benefits Of Slight Warming And Increased CO2 with Madhav Khandekar can be found here.
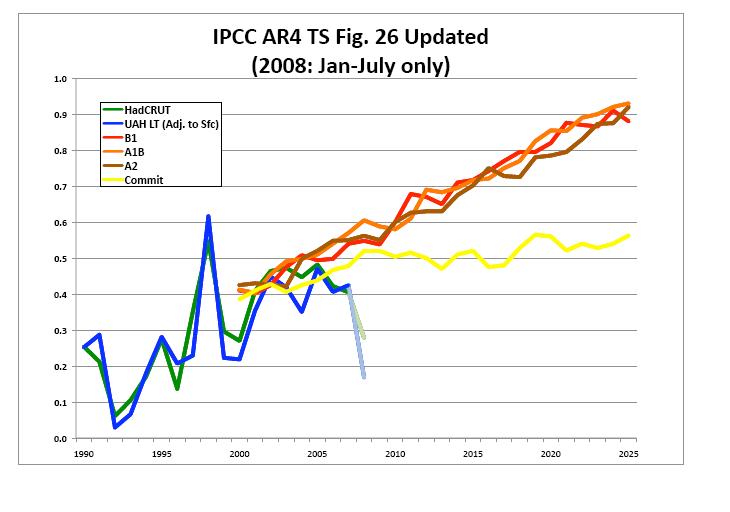
By Marlo Lewis on Planet Gore
There’s been no net global warming in the 21st century. Although seldom reported by the mainstream media, it’s quite a story, because no climate model predicted it.

See larger image here
This graph, courtesy of atmospheric scientist John Christy, shows how climate models and reality diverge. The red, purple, and orange lines are model forecasts of global temperatures under different emission scenarios. The yellow line shows how much warming we are supposedly “committed to” even if CO2 concentrations don’t change. The blue and green lines are actual temperatures as measured by ground-based (HadCrut) and satellite (UAH LT) monitoring systems.
What’s really rather remarkable, is that since 2000, the rates at which CO2 emissions and concentrations are increasing have accelerated.
According to a study in Proceedings of the National Academy of Sciences, fossil fuel and cement emissions increased by 3.3 percent per year during 2000-2006, compared to 1.3 percent per year in the 1990s. Similarly, atmospheric CO2 concentrations increased by 1.93 parts per million per year during 2000-2006, compared to 1.58 ppm in the 1990s.
And yet, despite accelerating emission rates and concentrations, there’s been no net warming in the 21st century. It don’t add up! Skeptics have long said climate models aren’t accurate enough to base policy decisions truer now than ever. See the story here.
By George Taylor, CCM
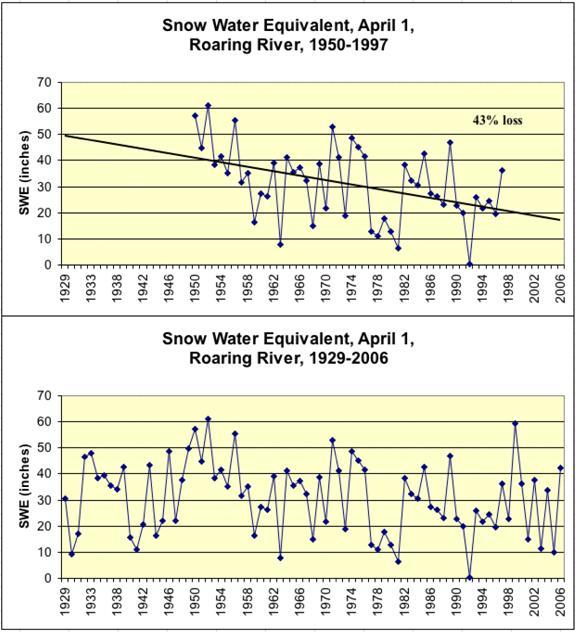
A few years ago, several papers by scientists at the University of Washington (Mote, 2003; Mote, et al, 2004; Mote, et al, 2005) suggested that snowpack in the Pacific Northwest was declining due to global warming. The Mote papers included the statement: “A study of springtime mountain snowpack in the Pacific Northwest showed widespread declines in snowpack since 1950 at most locations with largest declines at lower elevations indicating temperature effects.” This author responded with an article discussing Northwest snow trends.
Included was the following statement: “Note the starting point for this analysis; the late 1940s-early 1950s were an exceptionally snowy period in Oregon and the Pacific Northwest. The Mote, et al papers used 1950 as a starting point because snowpack measurements were “widespread by the late 1940s” (Mote, et al, 2005) and much less extensive earlier. However, in view of the fact that climate conditions prior to the late 1940s were very different, one might wonder if inclusion of longer period data sets would change the result.” They did. Period-of-record trends were very different for longer data sets than they were for the period beginning in 1950. The conclusions of that analysis: “The use of snowpack trends from 1950 through current suggests a much different (steeper) trend than if period of record measurements are used. Granted, there exist relatively few stations that extend back prior to 1940, but those stations whose records are available make it clear than monotonic decreases in snow pack do not occur through the entire period of record.”
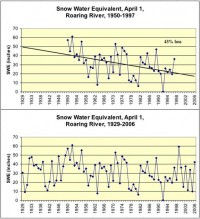
See larger image here.
Nonetheless, the idea that snows were decreasing due to global warming, and would likely keep doing so, became a common and popular one in the Northwest. Seattle’ mayor, Oregon’s Governor, and other public officials rushed to include this “fact” in their policy statements. For example, the Report to the Governor (of Oregon) from the Governor’s Advisory Group on Global Warming (December 2004) stated: “Between 1950 and 2000, the April 1 snowpack declined. In the Cascades, the cumulative downward trend in snow-water equivalent is approximately 50% for the period 1950-1995. Timing of the peak snowpack has moved earlier in the year, increasing March streamflows and reducing June streamflows. Snowpack at low-to-mid elevations is the most sensitive to warming temperatures.?”
However, in 2007 the “snow is going away” idea began to crumble. Washington Associate State Climatologist Mark Albright confirmed that there was no significant long-term trend in snowpack. The winter of 2007-08 was one of the snowiest on record. And last month, the Seattle Times published the following news piece: According to the Times, “Maybe the snow in the Cascade Mountains isn’t in such immediate peril from global warming after all.” “Despite previous studies suggesting a warmer climate is already taking a bite out of Washington’s snowpack, there’s no clear evidence that human-induced climate change has caused a drop in 20th century snow levels, according to a new study by University of Washington scientists.” It is comforting that use of appropriate data records has dispelled some “bad science” conclusions. One hopes that policymakers will recognize this and modify their policies accordingly. Read more here.
Update see this Bruce Hall story ”Telling Tall Tales with Trends” which George’s write-up inspired.
Paul Chesser, Climate Strategies Watch
One of the proud proclamations the Center for Climate Strategies makes whenever they start managing a new climate commission for a state is that their “process is fully transparent.” That can be challenged on a few different points, and none more so than the issue of how much they get paid to do their work (that is, advance their agenda) for each state and how much the alarmist foundations (like Rockefeller Brothers Fund and the Energy Foundation) are paying them.
Exhibit A is with the Kansas Energy and Environmental Policy Advisory Group (KEEP), created and populated by Gov. Kathleen Sebelius (pictured). If you read the “Process Memo” (PDF) posted at the KEEP site (which lays out the ground rules for the group and its process) you will notice that under the “Project Budget” section there is only this statement: “The estimated CCS budget for completion of startup and completion of the KEEP process covers the core facilitation process and quantification of approximately 50 policy recommendations. Changes in the number of meetings, number of policy options, or type of analysis may reduce or expand the level of budget support needed.”
As you can see, no budget numbers there for the public to easily access (as is the case in all states where CCS works). But take a look at this version (PDF) of the document that I obtained via a public records request from the governor’s office. Voila—budget numbers (PDF single page) appear! And CCS will get nearly $554,000 out of the deal, thanks to their global warming alarmist sugar daddies.
So, will a curious Topeka press corps inquire about why there’s such secrecy? Will they ask how much the enviro-foundations are each pitching in? Will KEEP leaders demand that CCS (who runs the KEEP Web site) live up to their promise of transparency? Stay tuned. See full story here. See SPPI’s Kansas Climate Profile here.
By Roger A. Pielke Sr University of Colorado,
I have submitted two comments to the draft CCSP Report Unified Synthesis Product Global Climate Change in the United States. This is comment #2 on the Entire Report
Comment #1 is just one example of the exclusion of peer reviewed studies in the draft CCSP report.
The Report is co-chaired by scientists (Tom Karl, Jerry Melillo, and Tom Peterson) who have a conflict of interest in the assessment as they are evaluating significant portions of their own research. This real conflict of interest was documented in the public comment for the first CCSP report
Pielke Sr., Roger A., 2005: Public Comment on CCSP Report ”Temperature Trends in the Lower Atmosphere: Steps for Understanding and Reconciling Differences”. 88 pp including appendices, where it is summarized for that report that:
“The process for completing the CCSP Report excluded valid scientific perspectives under the charge of the Committee. The Editor of the Report [Tom Karl] systematically excluded a range of views on the issue of understanding and reconciling lower atmospheric temperature trends. The Executive Summary of the CCSP Report ignores critical scientific issues and makes unbalanced conclusions concerning our current understanding of temperature trends.”
“Future assessment Committees need to appoint members with a diversity of views and who do not have a significant conflict of interest with respect to their own work. Such Committees should be chaired by individuals committed to the presentation of a diversity of perspectives and unwilling to engage in strong-arm tactics to enforce a narrow perspective. Any such committee should be charged with summarizing all relevant literature, even if inconvenient, or which presents a view not held by certain members of the Committee.”
The current draft CCSP report ignored this recommendation. As a result we do not have a unified synthesis product but a document that promotes a particular narrow perspective on climate science based on the prejudices of the Editors.
The recommendation in this Comment is that the Draft CCSP Synthesis Report be rejected.
A new independent assessment Committee should be appointed in order to present policymakers with an accurate assessment of the diversity of scientifically supported conclusions regarding the role of humans within the climate system. This includes the evaluation of the vulnerabilities to important environmental and societal resources from natural and human-caused climate variability and change.
See full comments here.
Icecap Note: I am busy sending in comments on this, the worst climate change summary document I have ever seen. Roger posted one of my comments here today. I will post a story with a link to each of my comments this week.
Sloppy Work by the CCSPBy Roger Pielke Jr., Prometheus
The Synthesis and Assessment Products (SAPs); of the United States Climate Change Science Program (CCSP) are supposed to represent the absolute best reviews of the state of climate science from the world-leading United States research enterprise. With more than $30 billion invested in climate research over the past two decades, the SAPs represent the most important summary documents in U.S. climate science. The CCSP explains the significance of these reports:
These reports will provide current evaluations of the identified science foundation that can be used for informing public debate, policy development, and operational decisions, and for defining and setting the future direction and priorities of the program. An unprecedented process of review was established to keep political appointees far from the reports. However, the significance of the effort and the rigorous review has not been sufficient to result in a quality synthesis report, which in its release for public comment is marred not only by incomplete analysis and selective presentation of science, but also, by plain old sloppiness.
Consider these three examples:
(1) Doctored Image: As first mentioned in the comments on this site by Mark Bahner, and shown conclusively by Anthony Watts the report contains a photoshopped image of flood damage in a section discussing precipitation. But in this case the CCSP appears to have intentionally procured a doctored image, since it is available for purchase with a clear disclaimer. Anyone should know that presenting a doctored image is not a good idea in a scientific report.
(2) Cribbed, Outdated, Misleading Figure. At Climate Audit, Steve McIntyre and his commenters indicate that the CCSP report reproduces an old figure from the Arctic Climate Assessment report that splices paleoclimate temperature proxies and the modern instrument record, despite expert views that such splicing should not be done. Setting aside the substantive objections, how can the CCSP claim to be an assessment of the latest science when it simply cribs dated materials from other another report with data ending 10 years ago, when that same record goes through the present?
(3) Hijacked Executive Summary But what is most troubling is the fact that the Executive Summary of the report repeats much of what the report’s non-governmental editor, Susan Joy Hassol calls her “Elevator Speech” of her personal political preferences on climate change. I personally agree with much of what she says, however the issue is not the details of the substance, but rather, how it is that the report’s editor was able to insert her personal policy preferences into the Executive Summary of the single most important report of the U.S. CCSP.
Lead and contributing authors of the synthesis and assessment products are scientists or individuals with recognized technical expertise appropriate to a product. Lead and contributing authors may be citizens of any country and be drawn from within or outside the Federal government (e.g., universities or other public or private sector organizations). These individuals shall be acknowledged experts, known through their publication record and relevant accomplishments and contributions to their field. Lead authors are responsible for the content of the synthesis and assessment products that are submitted to the CCSP Interagency Committee for review.
The CCSP established a rigorous process for the writing and editing of its reports in order to limit the ability of political appointees to massage the report in desired directions. But apparently the CCSP review process has left a gaping hole for a single non-governmental, non-technical, non-expert to shape the report in politically desirable ways.
On an issue as high politicized as climate change, where bloggers and others are paying close attention, the inclusion of a doctored image, the cribbing of an old, misleading figure, and the inclusion of an editor’s personal views in the guise of a science assessment is remarkable, even in a draft for public comment. Even if the excuse is plain old sloppiness, the report is a big fat black eye for the world’s leading climate science program. Read more here.