


By Allan MacRae
Many scary stories have been written about the dangers of catastrophic global warming, allegedly due to increased atmospheric concentrations of the greenhouse gas carbon dioxide (CO2) from the combustion of fossil fuels. But is the world really catastrophically warming? NO. And is the warming primarily caused by humans? NO.
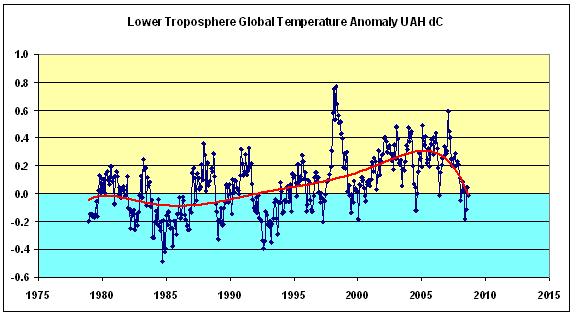
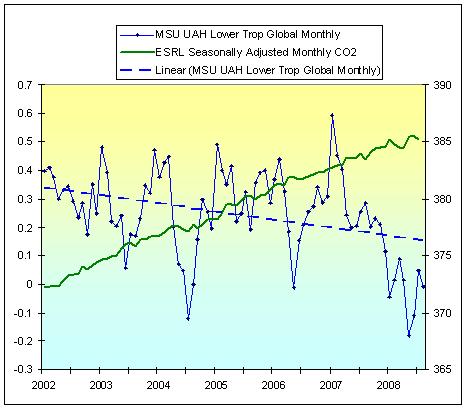
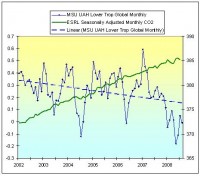
Since just January 2007, the world has cooled so much that ALL the global warming over the past three decades has disappeared! This is confirmed by a plot of actual global average temperatures from the best available source, weather satellite data that shows there has been NO net global warming since the satellites were first launched in 1979.
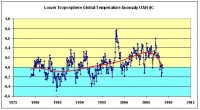
See larger image here.
Since there was global cooling from ~1940 to ~1979, this means there has been no net warming since ~1940, in spite of an ~800% increase in human emissions of carbon dioxide. This indicates that the recent warming trend was natural, and CO2 is an insignificant driver of global warming.
Furthermore, the best fit polynomial shows a strong declining trend. Are we seeing the beginning of a natural cooling cycle? YES. Further cooling, with upward and downward variability, is expected because the Pacific Decadal Oscillation (PDO) has returned to its cool phase, as announced by NASA this year.
Global warming and cooling have closely followed the phases of the PDO. The most significant pattern of PDO behavior is a shift between “warm” and “cool” phases that last 20 to 30 years. In 1905, the PDO shifted to its “warm” phase. In 1946, the PDO changed to its “cool” phase. In 1977, the PDO returned to its “warm” phase and produced the current warming. In 2007-8, the PDO turned cold again, so we can expect several decades of naturally-caused global cooling.
Some scientists are predicting that this cooling will be severe, and is a greater threat to humanity than global warming ever was. Meanwhile, politicians are still obsessing about global warming.
By Anthony Watts, Watts Up With That
We have news from the National Snow and Ice Data Center (NSIDC). They say: The melt is over. And we’ve added 9.4% ice coverage from this time last year. Though it appears NSIDC is attempting to downplay this in their web page announcement today, one can safely say that despite irrational predictions seen earlier this year, we didn’t reach an “ice free north pole” nor a new record low for sea ice extent. Here is the current sea ice extent graph from NSIDC as of today, notice the upturn, which has been adding ice now for 5 days:
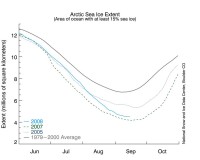
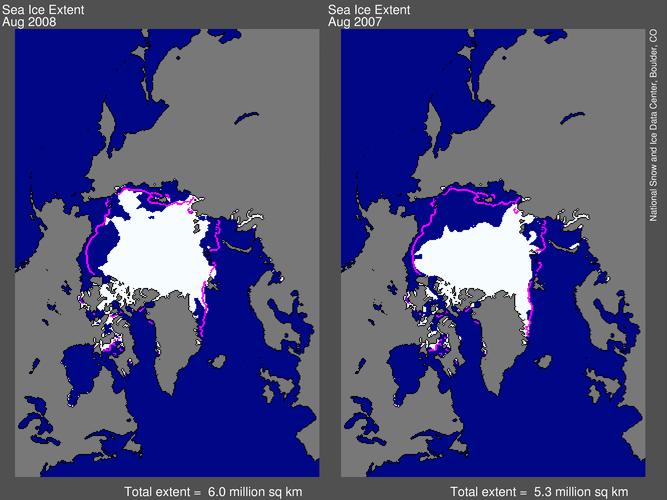
Here is what they have to say about it: “The Arctic sea ice cover appears to have reached its minimum extent for the year, the second-lowest extent recorded since the dawn of the satellite era. While above the record minimum set on September 16, 2007, this year further reinforces the strong negative trend in summertime ice extent observed over the past thirty years. With the minimum behind us, we will continue to analyze ice conditions as we head into the crucial period of the ice growth season during the months to come.
Despite overall cooler summer temperatures, the 2008 minimum extent is only 390,000 square kilometers (150,000 square miles), or 9.4%, more than the record-setting 2007 minimum. The 2008 minimum extent is 15.0% less than the next-lowest minimum extent set in 2005 and 33.1% less than the average minimum extent from 1979 to 2000.
Determining with certainty when the minimum has occurred is difficult until the melt season has decisively ended. For example, in 2005, the time series began to level out in early September, prompting speculation that we had reached the minimum. However, the sea ice contracted later in the season, again reducing sea ice extent and causing a further drop in the absolute minimum.
We mention this now because the natural variability of the climate system has frequently been known to trick human efforts at forecasting the future. It is still possible that ice extent could fall again, slightly, because of either further melting or a contraction in the area of the pack due to the motion of the ice. However, we have now seen five days of gains in extent. Because of the variability of sea ice at this time of year, the National Snow and Ice Data Center determines the minimum using a five-day running mean value.
In addition, NSIDC will issue a formal press release at the beginning of October with full analysis of the possible causes behind this year’s low ice conditions, particularly interesting aspects of the melt season, the set-up going into the important winter growth season ahead, and graphics comparing this year to the long-term record. At that time, we will also know what the monthly average September sea ice extent was in 2008 - the measure scientists most often rely on for accurate analysis and comparison over the long-term.”
It will be interesting to see what they offer in the October press release. Plus we’ll be watching how much ice we add this winter, and what next year’s melt season will look like. Hopefully we won’t have a new crop of idiots like Lewis Gordon Pugh trying to reach the “ice free north pole” next year. Read more here.
By Joseph D’Aleo
Tom Karl’s following in James Hansen’s big foosteps. As global warming fizzles, they have taken steps to manipulate the data to make it look like it is still occurring. We reported in June the discontinuity between NOAA projecting the world was the eighth warmest June on record for the globe in the 129 years since records began in 1880. At the same time, the University of Alabama, Huntsville came out with their global June assessment and they reported the 9th coldest in the 30 years of records in their data base. In fact, their global mean was actually below the average (base period 1979-1998) with a value of -0.11C (-0.19F). This is a full 1.1F degrees colder than the NOAA guesstimate. The other NASA satellite source, RSS had June as the 13th coldest out of the last 30 years.
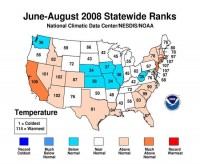
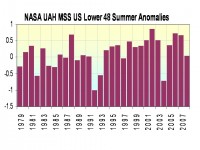
Well NOAA again this month was out of line with the satellite assessment with both the August and summer averages for the lower 48 states. In this press release, NOAA’s National Climate Data Center (NCDC) claimed the June-August 2008 summer season was the 22nd warmest on record for the contiguous United States. Also, last month ended as the 39th warmest August for the contiguous (lower 48) United States, based on records dating back to 1895.
See larger image here.
Compare that with the UAH MSU based satellite depiction for the lower 48 states. They show the United states had the 13th coldest August in 30 years (with an anomaly of 0.05 for the 1979-1998 average). They also show the summer was the 12th coldest in 30 years with a small anomaly of 0.036F.
See larger image here.
It is unclear whether the NCDC US assessment already has the NCDC adjustments applied. Most people believe the data used in climate assessments is the data they hear reported each day from the NWS on their local news. In actual fact the data is adjusted by NCDC before it becomes recorded in the official national or global data bases. The older data was changed for changes in time of observation and in some cases (not all) instrumentation. In the original US climate data set, NCDC made adjustments for site changes and urbanization. Last year NCDC replaced the urban heat island and siting adjustments in the original climate data with changes determined by a change point detection algorithm. This change point algorithm looks for sudden discontinuities like occur when a station moves or local land use suddenly changed around the instruments (road is paved, building built) but would not catch the slow warming associated with a slow growth of an urban area (town or city) which is most commonly the case. Anthony Watts has found examples where the algorithms have failed to even find sudden changes due to station moves like Lampasas TX). So it appears NCDC has taken a giant step backwards in trying to provide accurate climate change assessments and forward in supporting the AGW movement which has benefited NOAA budgets. See why urban adjustment is important and why the lack of adjustment is likely responsible for much of the so called warming trend the last century here. See more about the surface station siting issue here. As of last report, 87% of the 554 stations evaluated failed to meet the government’s own criteria and 69% were poor to very poorly sited.
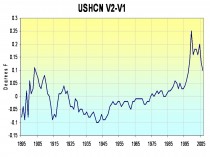
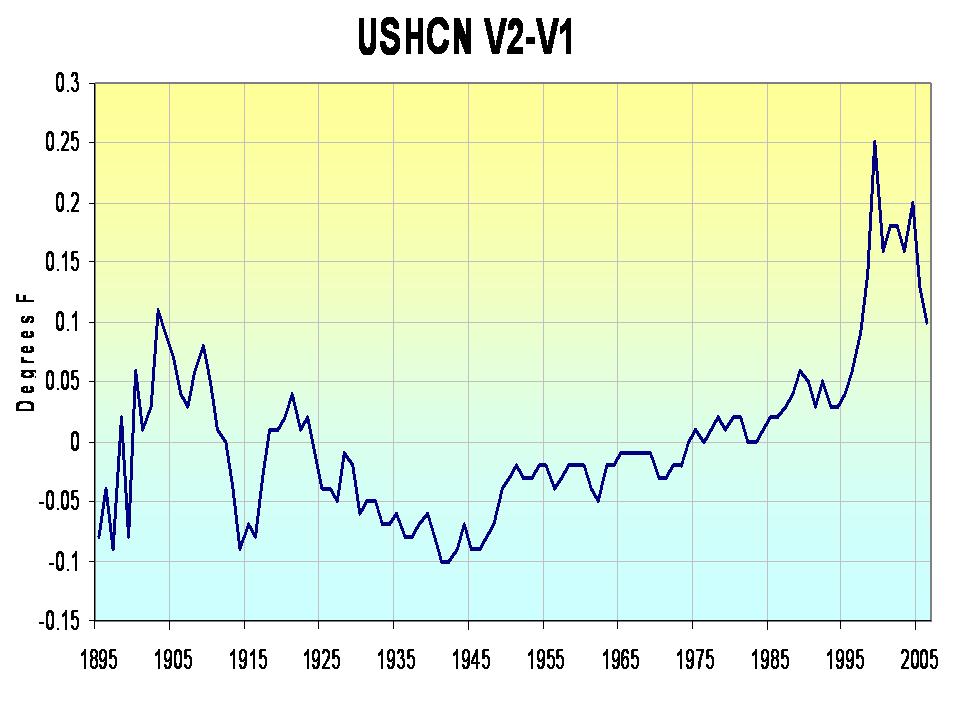
See how the changes in the algorithms affected NOAA NCDC annual temperatures below. Wonder why the 2000s according to NCDC are warm? Man-made global warming but in this case man = NOAA NCDC.
See larger image here
UPDATE: For the globe NOAA claimed 2008 was 0.79 degrees F (0.44 degrees C) above the 20th century mean of 60.1 degrees F (15.6 degrees C) and tied with 1995 for the tenth warmest August on record. The UAH MSU data showed the summer as the 11th coldest in the last 30 years with an anomaly of -0.024C (-0.04F). Again NOAA is an outlier with RSS and MSU. The global data lacks an adequate urban adjustment thanks to the intervention of Tom Peterson who uses a flawed paper to justify his claim that urbanization does not affect global trends. As we have shown in the pdf mentioned above it clearly does. In any case, don’t buy NOAA data. Tom Karl and Tom Peterson deserve to join their counterpart at NASA in retirement (if not in court). They have abused the public trust.
New Scientist: Sea Ice Increases Due to Global Warming
By James Lewis in the American Thinker
You gotta hand it to the global warming crowd. They have mind-bending gall. New Scientist, which used to be a good pop science magazine, now quotes a NASA scientist saying: “The Antarctic wintertime ice extent increased at a rate of 0.6% per decade” from 1979 to 2006, says Donald Cavalieri, a senior research scientist at the NASA Goddard Space Flight Center in Maryland. Since 1979, the average year-round ice extent has risen too.”
Let’s see, that would be 27 years, so a total increase of about 2.0% in the extent of sea ice in the Antarctic. That’s a lot of frozen daiquiris. Millions of tons of increased ice in the Antarctic sounds colder rather than warmer, no?
But the Eye of Gaia has a different way of spinning these facts. New Scientist begins the article with: “The amount of sea ice around Antarctica has grown in recent Septembers in what could be an unusual side-effect of global warming, experts say.” You see, when it gets hotter it proves global warming. And when it gets colder it also proves global warming. They get you coming and going.
And these people think creationism is unscientific? Don’t they ever feel embarassed? And why are all the other scientists in the world not rolling on the floor laughing at these silly twits? See post here.
By Joseph D’Aleo
Ike slammed ashore last evening a strong CAT 2 hurricane. It is moving rapidly north northwest and will rapidly get caught up in the westerlies. It hit an area heavily populated and rich in refineries and chemical plants. The storm was very large, larger in size than Katrina and Rita though those storms being more compact and stronger. Although the storm made landfall near Galveston, it had significant effects on Port Arthur and western Louisiana, also important to energy gathering and refining.
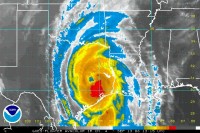
Ike brought memories of prior storms thst devastated this area over the past 108 years. Only time will tell how this storm will rank among those storms, but it will clearly be remembered. The worst storm of course as the great Galveston Hurricane of 1900. This article written in 2005 when Hurricance Rita threatened Galveston describes the great Galveston Hurricane of 1900, the nations worst natural disaster. They were the “most horrible sights that ever a civilized people looked up,” remarked Dr. Isaac M. Cline, a noted meteorologist based in the Texas city of Galveston. The date was Sept. 9, 1900, a day after the worst natural disaster in U.S. history.
Cline lost his pregnant wife among the 6,000-12,000 who perished after a hurricane roared ashore from the Gulf of Mexico, wiping out vast swaths of the city with huge storm surges and howling winds of at least 130 mph. The port city, then one of the wealthiest in America in terms of per-capita income, lay in ruins; it would take decades to rebuild Galveston again although it never recovered its former glory. The remodeled Galveston would include a 7-mile, 17-foot foot seawall to protect against future storm surges.
The storm wall was tested in Hurrcane Carla in 1961. Hurricane Carla was one of two Category 5 tropical cyclones during the 1961 Atlantic hurricane season. It struck the Texas coast as a Category 4 hurricane, becoming one of the most powerful storms to ever strike the United States and the strongest ever to hit Texas. The storm caused over $2 billion (2005 US dollars) in damages, but due to the evacuation of over 500,000 residents the death toll was only 43. Storm surge was measured at 22 feet (6.6 m) near the heads of bays, in some places penetrating 10 miles inland. Because of its large size, the entire Texas coast was affected, and damage was reported as far inland as Dallas. Sustained winds were reported to be 115 mph in Matagorda, 110 mph in Victoria and 88 mph in Galveston. Wind gusts as high as 170 mph were recorded at Port Lavaca. Pressure at landfall was measured at 931 mb (hPa), making it the eighth most intense hurricane to strike the United States in the 20th century. Then little-known newsman Dan Rather reported live from the Galveston Seawall during the storm, an act that would be imitated by later reporters. This marked the first live television broadcast of a hurricane.
Much of the damage was done well away from the landfall site, as Carla spawned one of the largest hurricane-related tornado outbreaks on record at the time, when 26 tornadoes touched down within its circulation. One F4 tornado ripped through downtown Galveston, killing several (sources differ on the exact number, varying from 6 to 12). Outside the protection of the Galveston Seawall, structures on the island were severely damaged by storm surge. Damage was reported as far east as the Mississippi River delta. Carla killed 43 people, 31 of them in Texas. The low death toll is credited to what was then the largest peacetime evacuation in US history.
Hurricane Alicia in 1983 struck Galveston and Houston, Texas directly, causing $2.6 billion USD$5.27 billion 2006 USD) in damage and killing 21 people; this made it the worst Texas hurricane since Hurricane Carla (1961 season) and Texas’ first billion-dollar storm. Hurricane Alicia was notable for the delayed evacuation of Galveston Island (since the eye of the storm traveled the evacuation route up I-45 from Galveston to Houston). The hurricane was also notable for the shattering of many windows in downtown Houston by loose gravel from the roofs of new skyscrapers and by other debris, prompting changes to rooftop construction codes. High gusts were reported throughout Texas, with a maximum gust of 125 mph reported on the Coast Guard cutter Buttonwood stationed at the northeastern tip of Galveston Island. Pleasure Pier reported tides of 8.67 feet, with Pier 21 reporting a little over 5.5 feet. Baytown, Texas reported 10-12 ft tides, and Morgan City reported 12.1 ft, the highest recorded as a result of Alicia. The storm also caused extensive disruption of power services. Twenty-three tornadoes were reported in association with Alicia. Fourteen of those were located in the Galveston and Hobby Airport area. (sources include NOAA, NWS HPB, NHC, USATODAY, Wikipedia).
By Roger Pielke Sr. Climate Science Weblog
Spencer R. Weart posts a remarkable weblog on Real Climate titled ”Simple Question, Simple Answer - Not”. He writes: “I often get emails from scientifically trained people who are looking for a straightforward calculation of the global warming that greenhouse gas emissions will bring.” and
“I’m not saying we don’t understand the greenhouse effect. We understand the basic physics just fine, and can explain it in a minute to a curious non-scientist. (Like this: greenhouse gases let sunlight through to the Earth’s surface, which gets warm; the surface sends infrared radiation back up, which is absorbed by the gases at various levels and warms up the air; the air radiates some of this energy back to the surface, keeping it warmer than it would be without the gases.) For a scientist, you can give a technical explanation in a few paragraphs. But if you want to get reliable numbers - if you want to know whether raising the level of greenhouse gases will bring a trivial warming or a catastrophe - you have to figure in humidity, convection, aerosol pollution, and a pile of other features of the climate system, all fitted together in lengthy computer runs.
Physics is rich in phenomena that are simple in appearance but cannot be calculated in simple terms. Global warming is like that. People may yearn for a short, clear way to predict how much warming we are likely to face. Alas, no such simple calculation exists. The actual temperature rise is an emergent property resulting from interactions among hundreds of factors. People who refuse to acknowledge that complexity should not be surprised when their demands for an easy calculation go unanswered.”
This is a clear admission of the complexity of the climate system which Climate Science has been emphasizing since it was initiated!
Indeed, since Spencer accepts that “The actual temperature rise is an emergent property resulting from interactions among hundreds of factors”, it also follows that we do not know even if the actual temperature will rise, since there are a variety of human cooling climate forcings, including from several of the aerosol effects (see), as well as natural cooling effects including atmospheric circulation changes, decreases in solar irradiance, and volcanic emissions.
We recognized this complexity in several of our papers; for example, in Nonlinearities, feedbacks and critical thresholds within the Earth’s climate system. Climatic Change, 2004, where we write “The Earth’s climate system is highly nonlinear: inputs and outputs are not proportional, change is often episodic and abrupt, rather than slow and gradual. It is imperative that the Earth’s climate system research community embraces this nonlinear paradigm if we are to move forward in the assessment of the human influence on climate.”
In Non-linearities in the Earth system. Global Change Newsletter, 2003 we wrote: “The complex non-linear physical, chemical, and biological interactions among the components of the Earth System are becoming an increasingly important focus in global change research. These interactions between atmosphere, oceans, ice, and land are driven externally by the solar input of heat, and internally by geologic activity and the myriad processes that control the behaviour of each sub-system. Human activity is an integral component of these interactions.” and “The complexity of the Earth System’s behaviour makes it extremely difficult to accurately forecast the future of the Earth System, and presents a major challenge to the global change research community.”
Skillful multi-decadal global climate predictions (and, thus also multi-decadal regional climate predictions) are not yet possible. Spencer R. Weart’s weblog is a step forward in the wider recognition of the actual complexity of the climate system. See Roger’s post here.
Emissions Not Making Rivers Run Dry
By Stewart Franks, The Australian
Is the ongoing drought in the Murray-Darling Basin affected by climate change? The simple answer is that there is no evidence that CO2 has had any significant role. Like it or not, that is the science. In fact, the drought was caused by an entirely natural phenomenon: the 2002 El Nino event. This led to particularly low rainfalls across eastern Australia. The subsequent years were either neutral or weak El Nino conditions. Significantly, neutral conditions are not sufficient to break a drought. In 2006, we had a return to El Nino conditions which further exacerbated the drought. What we didn’t have was a strong La Nina.
Last year finally brought a La Nina event but it was relatively weak. It produced a number of major storm events in coastal areas and some useful rainfall in the Murray-Darling basin and elsewhere. Approximately half of NSW drought-declared areas were lifted out of drought (albeit into “marginal” status) and Sydney’s water supply doubled in the space of a few months.

This was the first rain-bearing La Nina since 1999 but proved insufficient to break the drought. In short, the drought was initiated by El Nino, protracted by further El Nino events and perhaps more importantly, the absence of substantial La Nina events. Despite the known causes of the drought, many have claimed that CO2 emissions are to blame. There have been arguments put forward to justify this claim, all eagerly adopted by various groups, but none of which have serious merit.
A key claim is that the multiple occurrence of El Nino is a sign of climate change. This is speculative at best. Recent analysis showed the nine-year absence of La Nina was not unusual. In fact long-term records demonstrate alternating periods of 20-40 years where El Nino is dominant, followed by similarly extended periods where La Nina dominates. Ominously, the data demonstrates that it is possible to go 14-15 years without any La Nina events. The consequent drought would be devastating but entirely natural.
The observation that El Nino and La Nina events cluster on 20-40 year, multi-decadal timescales is an important one. It demonstrates that Australia should always expect major changes in climate as a function of natural variability. When viewed in this light, the drought is most likely a recurring feature of the Australian climate. Read more here. Hear an interview that he did a month or two back with News Radio’s Kel Richards here.
Stewart Franks is a hydroclimatologist and an associate professor at the University of Newcastle School of Engineering. He is president-elect of the International Commission on the Coupled Land - Atmosphere System
By David Tirrell-Wysocki, Associated Press in the USA Today
DUBLIN, N.H. The Old Farmer’s Almanac is going further out on a limb than usual this year, not only forecasting a cooler winter, but looking ahead decades to suggest we are in for global cooling, not warming. Based on the same time-honored, complex calculations it uses to predict weather, the Almanac hits the newsstands on Tuesday saying a study of solar activity and corresponding records on ocean temperatures and climate point to a cooler, not warmer, climate, for perhaps the next half century.
“We at the Almanac are among those who believe that sunspot cycles and their effects on oceans correlate with climate changes,” writes meteorologist and climatologist Joseph D’Aleo. “Studying these and other factors suggests that a cold, not warm, climate may be our future.” It remains to be seen, said Editor-in-Chief Jud Hale, whether the human impact on global temperatures will cancel out or override any cooling trend.
“We say that if human beings were not contributing to global warming, it would become real cold in the next 50 years,” Hale said.
For the near future, the Almanac predicts most of the country will be colder than normal in the coming winter, with heavy snow from the Ozarks into southern New England. Snow also is forecast for northern Texas, with a warmer than usual winter in the northern Plains. Almanac believers will prepare for a hot summer in much of the nation’s midsection, continuing drought conditions there and wild fire conditions in parts of California, with a cooler-than-normal season elsewhere. They’ll also keep the car packed for the 2009 hurricane season, as the Alamanac predicts an active one, especially in Florida.
But Editor Janice Stillman said it’s the winter foreasts that attract the most attention, especially this year, with much higher heating prices.So, in line with the weather and economy forecasts, the Almanac includes information on using wood for heat: the best wood, how to build a fire in a fireplace, whether to use a wood stove and how to stay warm - all winter - with a single log. Here’s the secret, popularized in 1777: Throw a log out an upstairs window, dash down the stairs and outside, retrieve the log, dash upstairs, throw the log out the window and so on. “Do that until you work up a sweat and you’ll be warm all winter,” said Stillman.
Last year, the Almanac correctly predicted “above-normal” snowfall in the Northeast - an understatement - and below-normal snowfall in the mid-Atlantic states. New Hampshire, home of the Almanac, saw the most snow in 134 years and missed an all-time record by 2.6 inches.
Established in 1792, the Old Farmer’s Almanac is North America’s oldest continuously published periodical. The little yellow magazine still comes with the hole in the corner so it can hang in outhouses. Boasting 18.5 million readers, this year’s edition contains traditional tips on gardening and astronomical information and tide charts so accurate the government considered banning them during World War II, fearing they would help German spies. See more here.
Icecap Note: This was a real coup thanks to the Old Farmer’s Almanac, in addition to reaching their regular readers, the story was picked up by the AP and carried in well over 250 newspapers including the USA Today and today the Washington Post. That is one way to break through the Society of Environmental Journalists roadblocks where their handbook advises their members to avoid covering stories that challenge man-made global warming.
Buy the OLD Farmers Almanac (publisher Yankee Magazine) or see their web site with the timeline and story and forecasts. By the way I was privileged to be asked to author this piece and the Almanac allowed me to be more technical than most magazines allow. Unfortunately the long lead time for publication prevented me from adding the latest charts showing the continued rapid cooling in 2008 and overall global cooling since 2002 like this one.
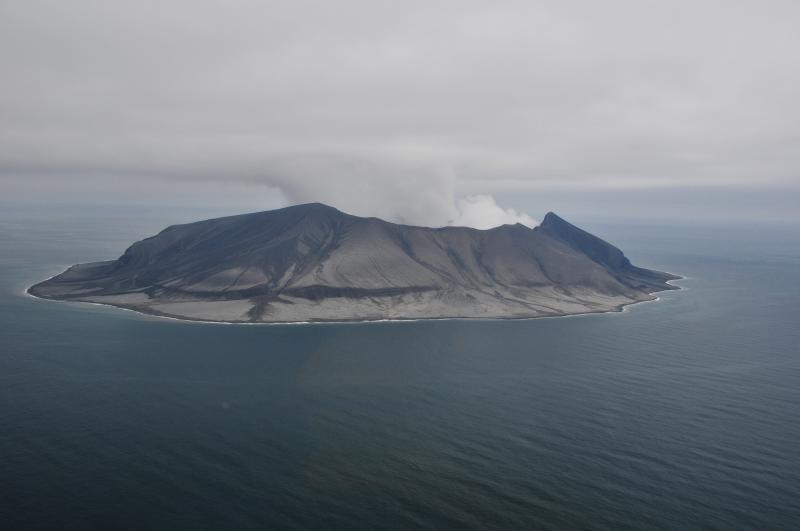
In this story Volcano’s Eruption Colors World’s Sunsets on Live Science, Andrea Thompson reported: “Reports of unusually fiery orange sunsets on Earth and ruby red rings around the planet Venus have popped up on the Internet in the last week.
Some skywatchers suspect that these views are being colored by the dust and gases injected into the atmosphere by the Aug. 7 eruption of Alaska’s Kasatochi volcano. The skywatchers are probably right. Kasatochi, part of the Aleutian Island chain, sent an ash plume more than 35,000 feet (10,600 meters) into the atmosphere when it erupted last month.
“This is a big ash-producing eruption,” said Peter Cervelli, a research geophysicist with the United States Geological Survey at the Alaska Volcano Observatory. During a survey of the area after the eruption, Cervelli and his colleagues found ashfall deposits more than 6 inches (15 centimeters) deep at a spot 15.5 miles (25 kilometers) away from the volcano.
The fine ash injected by a volcanic eruption into the stratosphere can be carried by winds all over the world. Sulfur dioxide spewed from volcanoes can react in the atmosphere to form sulfate aerosols (aerosols are tiny particles suspended in the air). Both ash and aerosols can scatter the sun’s rays, giving a sunset its apparent color.”
Ruby red sunsets and Bishop’s rings were also seen after the monstrous eruption of the Philippines’ Mount Pinatubo in 1991, Pfeffer added, though that eruption was on a much larger scale than Kasatochi. In fact, the ash and aerosols that spewed from Pinatubo spread across the globe and were so pervasive that temperatures in the year after the eruption were cooler than normal.”
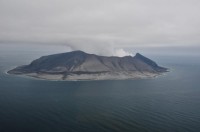
See larger image of Kasatochi here
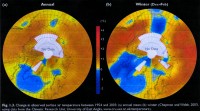
Icecap Note: This clearly is no Pinatubo but the sunsets suggest it has injected the aerosols into the stratosphere where it has a longer lifetime than smaller eruptions. In this story we note that climatologists may disagree on how much the recent global warming is natural or manmade but there is general agreement that volcanism constitutes a wildcard in climate, producing significant global scale cooling for at least a few years following a major eruption. However, there are some interesting seasonal and regional variations of the effects. Robock (2003) and others have shown that though major volcanic eruptions seem to have their greatest cooling effect in the summer months, the location of the volcano determines whether the winters are colder or warmer over large parts of North America and Eurasia.
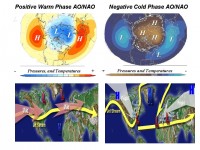
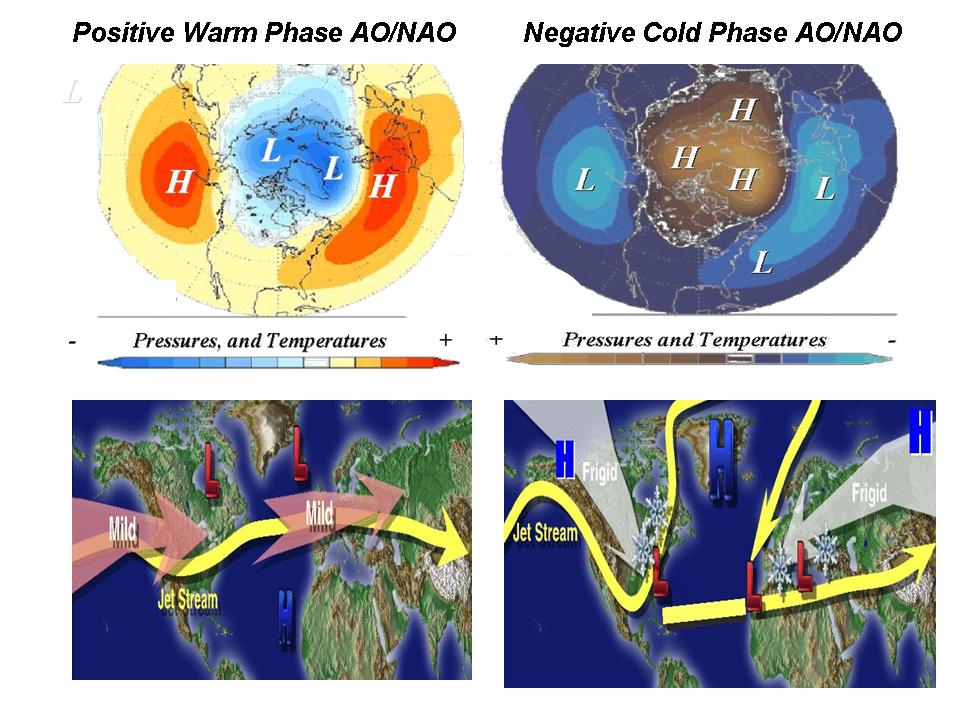
We showed that Robock (2003) and others have shown that though major volcanic eruptions seem to have their greatest cooling effect in the summer months, the location of he volcano determines whether the winters are colder or warmer over large parts of North America and Eurasia. According to Robock, tropical region volcanoes like El Chichon and Pinatubo actually produce a warming in winter due to a tendency for a more positive North Atlantic Oscillation (NAO) and Arctic Oscillation (AO) - below left top and bottom. In the positive phase of these large scale pressure oscillations, low pressure and cold air is trapped in high latitudes and the resulting more westerly jet stream winds drives milder maritime air into the continents. Robock found high latitude volcanoes like Katmai (Alaska in 1912) instead favored the negative phase of the Arctic and North Atlantic Oscillations and cold winters - right side top and bottom. In the negative phase, the jet stream winds buckled and forced cold air south from Canada into the eastern United States and west from Siberia into Europe.
See larger image here
Despite the regional differences in winter, globally on an annual basis, volcanic eruptions lead to a net cooling regardless as to the volcano’s latitude.
Update: Jos De Laat of the KNMI wrote to say “we have been monitoring that one very closely. An animated image of satellite observations of sulphur dioxide (SO2) for the first ten days after the eruption can be found here (hit the reload button if the movie does not play). More satellite imagery of SO2 can be found here and here. Most of the SO2 and presumably the ash have disappeared by now. The rapid transport of the SO2 shows that most of it was transported to the upper troposphere - entering the jetstream - where it can be removed rather quickly. By using the NASA CALIPSO LIDAR instrument we were (are) able to accurately estimate the altitudes of the plumes (here and here). However, some SO2 and ashes were injected higher up in the stratosphere (15-20 km altitude) where removal takes much, much longer. A few thin stratospheric remnants are still visible in the CALIPSO data and if you look carefully also in the SO2 images. However, it appears that the majority of the plume did not enter the stratosphere, hence I presume the climatic effect will be relatively small.
By Jennifer Marohasy, Politics and Environment Blog
Bill Kininmonth knows a lot about climate science, he is a meteorologist and he was the head of Australia’s National Climate Centre from 1986 to 1998. He is also a well known global warming skeptic and is particularly critical of the idea that the principles for sustaining the greenhouse effect are well understood. While this may seem like a ridiculous proposition, indeed the greenhouse effect is the underpinning science for the hypothesis of dangerous global warming from elevated levels of atmospheric carbon dioxide, in a recent letter to the Federation of Australian Scientists and Technologists (FASTS) he explains how the Intergovernmental Panel on Climate Change (IPCC) are neither consistent in their explanation for the greenhouse effect nor provide a mechanism that accords with the global average earth energy budget.
Mr Kininmonth’s letter to FASTS follows their issuing of a media release on climate change including comment that:
“The scientific evidence is compelling that global policy objectives must remain squarely focused on returning greenhouse gas concentrations to near pre-industrial levels through the reduction of emissions.”
The media release was accompanied by a statement that included comment:
“The physical principles of the greenhouse effect are well-understood. Without greenhouse gases, clouds or aerosols, the surface of the Earth would have a mean temperature of about 18oC below zero. While the natural atmospheric composition varies over time, the observed warming in the late 20th century can be attributed with a very high degree of confidence to additional human emissions of greenhouse gases.”
The statement was developed and published without input from rank and file member of FASTS and indeed not everyone agrees that the scientific evidence is compelling. Mr Kininmonth explains why in the following open letter.
UK’s Met Office Blows Another Summer ForecastBy Steven Goddard on Watts Up With That
A Chronology of UK Met Office press releases
The UK Met office is the official UK meteorological agency and is one of the leading promoters of the idea of climate change. Their web site is in fact titled “Met Office: Weather and climate change.”
In 2007, they made several notable predictions, starting with this one on Jan 4. “2007 is likely to be the warmest year on record globally, beating the current record set in 1998, say climate-change experts at the Met Office.”
On April 11, 2007 they issued this press release stating “there is a high probability that summer temperature will exceed the 1971-2000 long-term average of 14.1C. there are no indications of an increased risk of a particularly dry or particularly wet summer.” This was interpreted by The Guardian as “Britain set to enjoy another sizzling summer.”
On August 31 The Met announced that summer 2007 was the wettest on record with “normal temperatures,” though his description did not adequately describe the miserable summer - because high temperatures and sunshine were well below normal.
On August 10, The Met Office proudly announced new climate models which included modeling of “the effects of sea surface temperatures as well as other factors such as man-made emissions of greenhouse gases, projected changes in the sun’s output and the effects of previous volcanic eruptions.” The same press release forecast that “2014 is likely to be 0.3C warmer than 2004.”
Turns out that global temperatures in 2007 dropped nearly 0.8 degrees according to satellite data, one of the sharpest drops on record. In order to hit The Met’s 2014 prediction, there will have to be a large increase over the next few years. So how is The Met doing in 2008 with the new models?
On April 3, 2008 the Met made their annual UK summer forecast - “The coming summer is expected to be a ‘typical British summer’, according to long-range forecasts issued today. Summer temperatures across the UK are more likely to be warmer than average and rainfall near or above average for the three months of summer.”
On August 29, 2008 The Met reported that the summer of 2008 was “one of the wettest on record across the UK.” Here is how the Independent described the UK summer - “It has been a miserable summer for bugs as well as people. The combined effect of low temperatures and rain has presented Britain’s invertebrates with a double whammy.”
Read full post and comments here.
Icecap Note: That is what happens when you combine politics and science. A similar bias has developed at NASA and NOAA in their press releases, web wites and even internal data manipulation. Thankfully we have the remote sensing satellites and independent groups that are interpreting their data.
Update: Claim Satellites are interpreting ice as open water in MANY spots - Tom Nelson Blog.
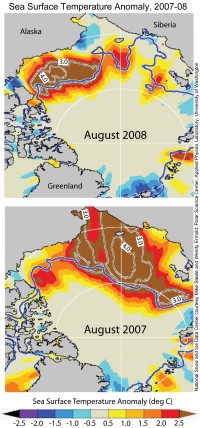
One reason why your boat may not be able to pass through an allegedly ice-free area. One of the groups focusing most closely on possible Arctic shipping lanes, the National Ice Center operated by the Navy and Commerce Department, says flatly that the satellites are misreading conditions in many spots and that there is too much ice in a critical spot along the Russian coast (highlighted in the smaller image above) to allow anything but ice-hardened ships to get through. In an e-mail message Wednesday, Sean R. Helfrich, a scientist at the ice center, said that ponds of meltwater pooling on sea ice could fool certain satellite-borne instruments into interpreting ice as open water, “suggesting areas that have substantial ice cover as being sea-ice free.” The highlighted area is probably still impassible ice, including large amounts of thick old floes, he said. I sent the note to an array of sea-ice experts, and many, including Mark Serreze at the National Snow and Ice Data Center, concurred.
By John Goetz on Watts Up with that
CNN posted an AP story on their website regarding the separation in early August of a 19-square-mile ice shelf from Elsmere Island. It starts:
TORONTO, Ontario (AP) — A chunk of ice shelf nearly the size of Manhattan has broken away from Ellesmere Island in Canada’s northern Arctic, another dramatic indication of how warmer temperatures are changing the polar frontier, scientists said Wednesday. Derek Mueller, an Arctic ice shelf specialist at Trent University in Ontario, told The Associated Press that the 4,500-year-old Markham Ice Shelf separated in early August and the 19-square-mile shelf is now adrift in the Arctic Ocean.
It sure sounds impressive and scary, but then most people probably think of New York City when they hear “Manhattan”. They might even think of the greater NYC Metro Area. But in reality, Manhattan is but one of the five Boroughs in NYC. And 19 square miles is roughly 4.4 x 4.4 miles. Is it really that impressive or alarming? It is actually smaller than the town limits of the little community I live in. Furthermore, the ice did not actually melt. The article states that it is adrift in the arctic. Read more of John’s post and the comments here.
Icecap Note: This has nothing NADA to do with greenhouse gases. This is a natural cyclical change due to decadal shifts in both the Atlantic and Pacific. See story here and here. The warm water was off the Siberia coast last year originated in the North Atlantic when the AMO peaked in 2005 and this year has rotated to off the north Alaska coast. To the south it was one of coldest summer in decades in places like Anchorage as the Pacific has returned to its cold mode. The melt season is coming to an end soon.
See larger image here
You can bet the alarmists and media are rooting for a new record. They lost the global warming story. The latest UAH MSU global temperature for August is -0.01C, in other words ever so slightly colder than the normal August since 1979. Temperature trend down continues even as the CO2 continues to rise.
See larger image here
By Paul Driessen
They get little credit for their efforts, but most resource extraction, manufacturing and power generation companies strive to be “socially responsible” - by emphasizing energy efficiency, resource conservation, pollution control and worker safety in producing the raw materials, consumer products and electricity that improve, safeguard and enrich our lives. It’s not easy, due to the nature of their business, public intolerance for any ecological impacts - and the fact that “corporate social responsibility” often defined and used by activist groups to promote ideological agendas. Above all, activists want to engineer a “wholesale transformation” of our energy and economic system, away from hydrocarbon fuels and into “eco-friendly” renewable resources; reduce our living standards to “sustainable” levels (their definition again); and give them power over the power that sustains our modern society.
This “hard green” version of CSR largely ignores socio-economic considerations, the many benefits of fossil fuel and nuclear power, the significant land and environmental impacts of wind, solar and ethanol - and the oppressive effects of soaring energy prices on jobs and poor families. Speaker Nancy Pelosi closed down the House of Representatives on August 1, to avoid an energy vote that Democrats would have lost, and later displayed her acumen on the subject when she opined: “natural gas is a clean, cheap alternative to fossil fuels.” News flash: Natural gas is a fossil fuel.
An Energy Economics 101 course is clearly needed, so that members of both parties can legislate more astutely - understand why mining and burning coal is a socially responsible component of sound energy policy - and help stanch the unnecessary flow of $700 billion a year in foreign oil payments. Energy is the master resource, the foundation for everything we eat, use and do. Sound policies ensure that energy is abundant, reliable and affordable. Restricting supplies in the face of rising global demand drives up prices and sends shockwaves through families, industries, communities and nations. Average total energy costs for a typical American household doubled from $2,400 in 1997 to over $5,000 in 2007. Food prices also soared, while wages remained relatively stagnant. More low and middle income families have been forced to choose between heating, eating, driving, medicines and housing - with little left over for vacations, emergencies, retirement, college or charity.
Thankfully, most electricity bills rose more modestly, because half of all US electricity is generated using coal, and the price for that fossil fuel has risen far less than oil, gasoline and natural gas prices. However, in places like Florida - where coal is verboten, natural gas is promoted but drilling for it is banned, and wind and solar are all the rage - electricity prices continue to climb. Florida Power & Light must pay four times as much for photovoltaic power as for coal power, the Heartland Institute reports, and schools face budget crunches for buses and electricity. America has centuries’ worth of coal. Our reliance on this resource has tripled since 1970 - but sulfur dioxide and particulate emissions are down 40% and 90% below 1970 levels, respectively, notes air pollution expert Joel Schwartz. New technologies and regulations will reduce coal power plant emissions even further by 2020, but even current emissions (including mercury) pose no significant risks to human health, he emphasizes.
A key justification for these anti-energy policies is cataclysmic global warming. However, 32,000 scientists have signed the Oregon Petition, saying they see “no convincing evidence” that humans are causing climate change, or that it will be catastrophic. Climate models continue to predict chaos but, as one scientist wryly notes, faith in their predictions is as misplaced as reliance on emails from Nigeria, advising recipients that they have won the Lotto. Global temperatures have not increased since 1998, despite steadily increasing carbon dioxide levels, and solar scientists like Pal Brekke say the sun’s formerly high activity level is leveling off or abating, which could bring falling global temperatures. China and India are planning or building 700 coal-fired power plants; European countries plan to build 50 more in five years, to reduce dependence on Russian gas; and other nations are also increasing fossil fuel use for transportation and power generation.
Thus, no matter how much the USA reduces its energy use, driving, heating, air-conditioning and living standards - no matter how much it punishes poor families or commits economic suicide - its actions would not reduce global CO2 levels, or affect Earth’s climate. We need to conserve, and continue improving renewable energy technologies that currently provide just 0.5% of our energy. But at this time renewables are simply too inefficient, expensive and unreliable to permit a shutdown of hydrocarbon-based systems. Putting “social responsibility” and “environmental justice” in the hands of eco-activists and liberal Democrats is like giving a machine gun to an idiot child. We need definitions that recognize the full spectrum of societal needs, and energy policies that acknowledge life in the real world. Read full story here.
By Tim Ball, Senior Fellow
The state of the Arctic sea ice is the topic of voluminous media reports about the effects of climate change.
> An analysis of the coverage shows that several aspects of Arctic phenomena make it a prime candidate for media stories.
> Media reporting on any issue has a self-sustaining momentum. Once a story has broken, a feedback loop leading to more stories ensues. Reporters know the issue has a waiting audience, and the public seeks reports that fit into its framework of understanding.
> Contrary to the underlying assumption of uniformitarianism on which Western environmental science is based, the environment regularly goes through significant and non-linear changes. Because we know little about the Arctic (satellite surveillance has only given reliable measurements of Arctic sea ice since 1979), it is very easy to contrast the constantly changing Arctic with the normal expectation of a changeless or incrementally changing environment.
> The Arctic is home to a number of animals including wolves and polar bears that are regularly used to invoke human pity.
> Changes in climate tend to create their strongest signals at the temperature-extreme poles.
> Contrary to the cautious and conditional approach of scientific progress, media reports on scientific matters tend to present speculation as fact, and reporters protect themselves against misstatement with neutral admissions of uncertainty. By examining a typical media story about the Arctic sea ice paragraph by paragraph, we can see how these and other techniques are used to present an emotionally compelling story that is completely disconnected from what scientists actually understand.
Arctic and Antarctic regions receive a great deal of attention for several reasons: a) we know very little about them b) they are regions where the greatest warming due to human CO2 is predicted c) they are home to animal species that have been used to exploit our emotions from Walt Disney’s false representation of lemmings in White Wilderness to Kevin Costner’s Dances with Wolves to Al Gore’s complete misrepresentation of polar bears to the more accurate but very emotional portrayal of Antarctic penguins.
Direct observation of and reports about the Arctic effectively began in the 16th century. Reports from that time are limited, but more importantly, an accurate determination of the extent of the Arctic sea ice did not exist prior to 1979. Climate data for the Arctic Ocean simply does not exist as is shown by the large “No Data” sections in the map from the Arctic Climate Impact Assessment (ACIA) for the period 1954 to 2003. Indeed, the fundamental argument made in that assessment for millions of research dollars was precisely because so little is known. It is important to note that the findings of the ACIA were the basis of understanding, assessment and recommendations for the 2007 Intergovernmental Panel on Climate Change report.
See larger image here.
Read the full report here.
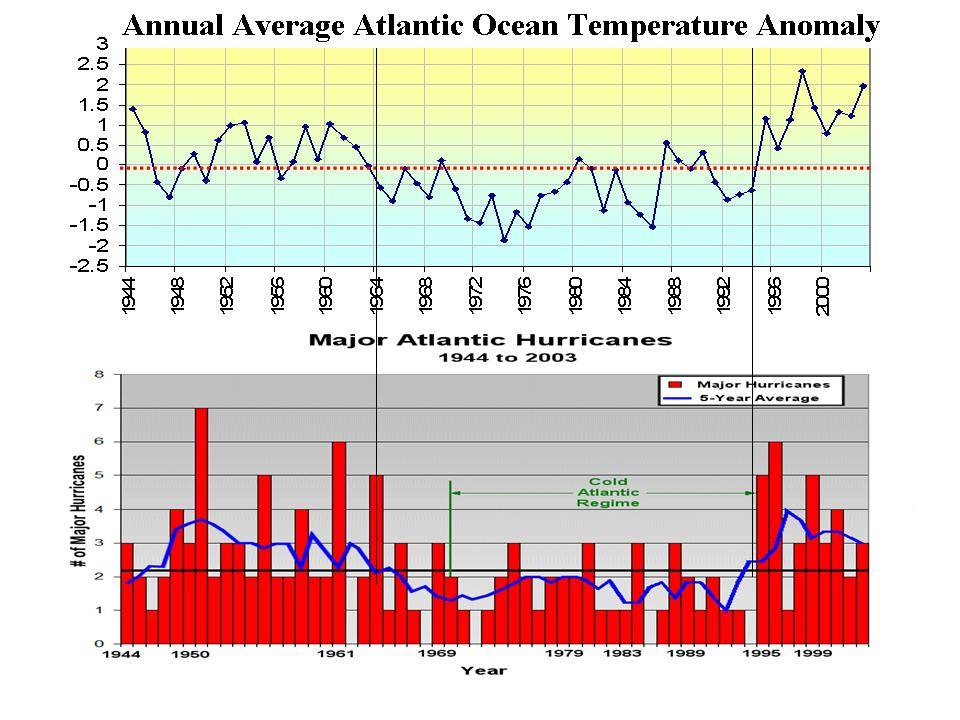
By Joseph D’Aleo, CCM, AMS Fellow
The hurricane season was expected to be active with enhanced landfall threats. This is characteristic of summers when the Atlantic is in its warm mode and coming off La Nina winters. Not surprisingly though the media including AP’s Seth Borenstein blamed this year’s storms and the increase in activity since 1995 on global warming. He quoted his favorite AGW cheerleaders Judith Curry and Kevin Trenberth who provided statistics to support the increase in activity since the 1990s.
No one questions that increase. Bill Gray and virtually all real hurricane forecasters and experts predicted the Atlantic would see an increase in the number of storms, major storms and landfalling systems ever since 1995 based on natural multidecadal cycles in the Atlantic.
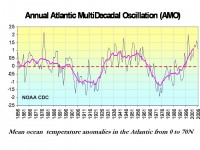
The Atlantic goes through cycles of warming and cooling with a period of about 70 years. A measure of this is the AMO, the standardized North Atlantic mean temperature from 0 to 70N. Note the warm period in the late 1800s, the late 1920s to the middle 1960s and again after 1995. Curry and Trenberth want you to believe the natural cold to warm transition of the AMO during the middle 1990s is somehow driven by CO2. See the recent flurry of peer review science that refutes any unnatural tropical variability here.
See larger image here
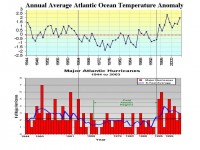
Then number of storms and the number of major hurricanes (CAT 3-5) increase during the warm Atlantic phases as shown below.
See larger image here
So far this year the Gulf and Florida has borne the brunt but before the week is over the southeast will see Hanna make landfall and its heavy rains and gusty winds are felt in the Mid-Atlantic and northeast.
Hanna will enter the mainland in the southeast as a tropical storm and turn up the coast bringing heavy rains and gusty winds from the southeast, Mid-Atlantic and then the northeast. Ike as expected became a major hurricane. It is far enough south so that it is not yet certain whether it threatens Florida, enters the Gulf and does a Gustav reprise or turns up the east coast or out to sea. More coming.