


Book review by Dr. John Brignell
The Many Benefits of Atmospheric CO2 Enrichment
By Craig D. Idso & Sherwood B. Idso
Published by Vales Lake Publishing
Copyright 2011 by the Science and Public Policy Institute and the Center for the Study of Carbon Dioxide and Global Change
Buy it at the Icecap Amazon Bookstore .
First, a declaration of prior interest: your reviewer once wrote an essay in praise of carbon and is therefore unlikely to be neutral in the case of a book with such a title. Of course, a promising title can often herald a treatment that has all the clarity and meaning of a mission statement. Fear not: this is a work that is scholarly, with copious references to genuine scientific research, yet manages to be accessible to the lay reader through judicious use of summaries and sidebars. It is a curious manifestation of the politics and religion of modern times that a rare atmospheric gas, which to be called benign would be an understatement, has been perversely cast in the role of original sin in the new system of belief. Here the manifold benefits of the gas are helpfully arranged in alphabetical order.
The results of a large number of scientific experiments are arrayed to demonstrate how an increase in carbon dioxide concentration enhances the metabolism of plants and therefore the animals (including humanity) that are dependent on them. Not only is growth improved, but plants are more resistant to disease and stresses (pollution, light, salinity, temperature, radiation and water). Furthermore, beneficial substances such as vitamins and other bioactive compounds also increase with carbon dioxide exposure. A caveat here: some of the claims are from the realm of modern epidemiology, with its wayward treatment of statistical significance, and accounts of, for example, cancer prevention by consuming particular vegetables need to be regarded with some reserve.
It is clear that we are a fortunate generation. Given that it is demonstrated that carbon dioxide concentration is a follower of temperature, the warming after the little ice age has awarded us all the prosperity that has previously accompanied warm periods (in Roman and Mediaeval times). That this has occurred at a time when there is also a perverse establishment in much of the world and a media for whom “good news is no news” provides just another demonstration of human perversity.
Dr. John Brignell is author of Numberwatch.
By Frank Lansner, Hide the Decline
A global temperature stagnation despite warm El Nino year 2010?
Will the global warming idea survive a strong La Nina?
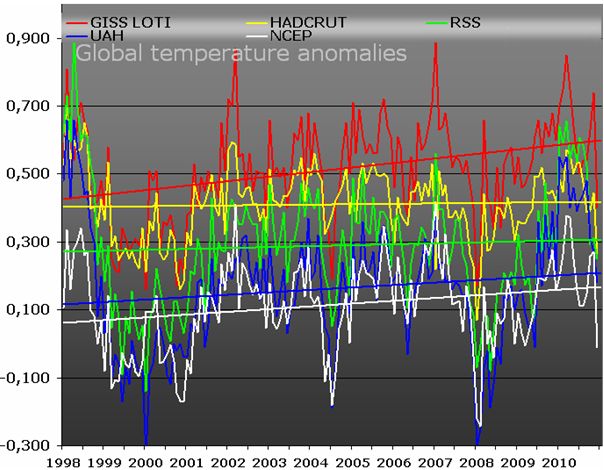
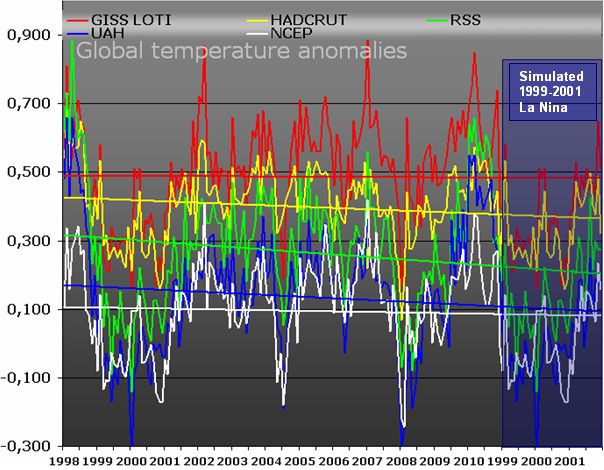
After the warm El Nino period 2009-2010, global temperature trends starting 1998 has generally turned positive:

The period starts out with a strong El Nino in 1998, however a strong La Nina lasting 3 times longer also has a strong effect on temperature trends starting 1998.
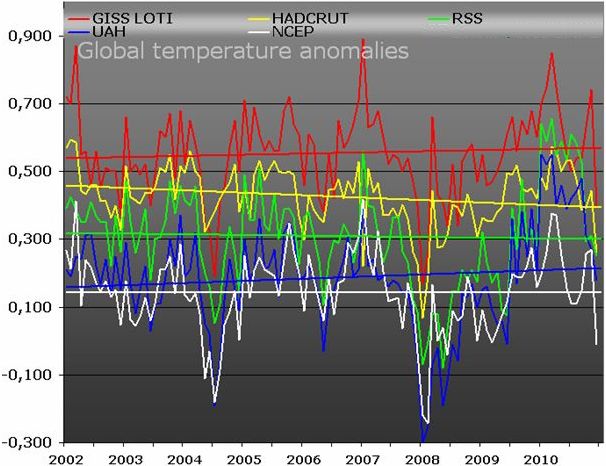
Temperature trends from 2002:
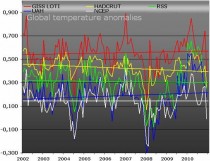
Thus removing the 1998 El Nino and 1999-2001 La Nina significantly cools the trends. The overall picture is now temperature stagnation 2002-2010 9 years.
The global warming theory generally suggests heating, but one can say that a period of roughly a decade with no temperature rise might be an expected deviation from the general trend.
However, things get worse for the global warming idea. Problem is that 2010 in the very end of the shown period is in fact a rather warm El Nino year. And still, the trends 2002-2010 are just… flat. Even now after the warm 2010. As if the global warming idea just barely holds on in the months just after a warm 2010.
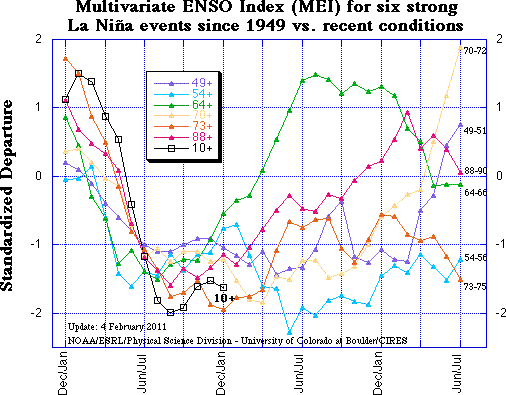
However, things get even worse for the global warming idea. The powerful La Nina is now showing its strength as we have witnessed temperature dive in the latest months. ICECAP Note: Wolter’s MEI

The NCEP prognoses roughly indicates a further drop of probably more than 0.1 K from December 2010 to January 2011. And the La Nina - allthough predicted to weaken during spring time - is by many predicted to match the 1999-2001 La Nina.

IF the present La Nina will resemble the magnitude and effect of the 1999-2001 La Nina, how would this affect the temperature trends from 1998 that already seems to have stagnated for a decade?
A “simulated” La Nina 1999-2001 by just assuming the same temperature flow repeated starting Januar 2011 to get a rough idea. Now suddenly we have a full 16 years period of no warming. In fact we mostly see cooling trends. (If we imagine yet an El Nino to occur thereafter, then after 17 - 18 years, perhaps we will still just have a flat curve??)
And “Uhh Ohh” whats going to happen if we simulate a 1999-2001 La Nina on the graph starting at 2002??
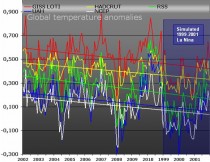
In this view, we see 12 yeas of strongly falling temperature trends.
La Nina is upon us, and that it won’t help the global warming message.
See post here.
Great news down under. We need the same investigation and independent assessment here for NOAA and NASA. See where congress is looking at blocking NOAA’s new Climate Service and reprioritize NASA funding here. Let’s hope they succeed and then move onto the NAS, NSF, and the UN IPCC.
Update: the house has voted Just before 2 a.m. on February 19, to eliminate U.S. funding for the Intergovernmental Panel on Climate Change. The Republican majority, on a mostly party-line vote of 244-179, went on record as essentially saying that it no longer wishes to have the IPCC prepare its comprehensive international climate science assessments. Transcript of floor debate follows.
Luetkemeyer: Scientists manipulated climate data, suppressed legitimate arguments in peer-reviewed journals, and researchers were asked to destroy emails, so that a small number of climate alarmists could continue to advance their environmental agenda.
Since then, more than 700 acclaimed international scientists have challenged the claims made by the IPCC, in this comprehensive 740-page report. These 700 scientists represent some of the most respected institutions at home and around the world, including the U.S. Departments of Energy and Defense, U.S. Air Force and Navy, and even the Environmental Protection Agency.
For example, famed Princeton University physicist Dr. Robert Austin, who has published 170 scientific papers and was elected a member of the U.S. National Academy of Sciences. Dr. Austin told a congressional committee that, unfortunately, climate has become a political science. It is tragic the some perhaps well-meaning but politically motivated scientists who should know better have whipped up a global frenzy about a phenomenon which is statistically questionable at best.
Mr. Chairman, if the families in my district have been able to tighten their belts, surely the federal government can do the same and stop funding an organization that is fraught with waste and abuse. My amendment simply says that no funds in this bill can go to the IPCC. This would save taxpayers millions of dollars this year and millions of dollars in years to come. In fact, the President has requested an additional $13 million in his fiscal 2012 budget request.
My constituents should not have to continue to foot the bill for an organization to keep producing corrupt findings that can be used as justification to impose a massive new energy tax on every American.
Roger Pielke Sr. called for- “an inclusive assessment of the surface temperature record of CRU, GISS and NCDC. This necessarily should involve all research investigators who are working on this topic, with formal assessments chaired and paneled by mutually agreed to climate scientists who do not have a vested interest in the outcome of the evaluations.” Dr. Roy Spencer has suggested what was needed in this way: “...independent groups doing new and independent global temperature analyses - not international committees of Nobel laureates passing down opinions on tablets of stone.”
Georgia Tech’s Dr. Judith Curry’s comments on Roger Pielke Jr.’s blog support such an independent effort: “In my opinion, there needs to be a new independent effort to produce a global historical surface temperature dataset that is transparent and that includes expertise in statistics and computational science...The public has lost confidence in the data sets. Some efforts are underway in the blogosphere to examine the historical land surface data (e.g. such as GHCN), but even the GHCN data base has numerous inadequacies.”
Joanne Nova
A team of skeptical scientists, citizens, and an Australian Senator have lodged a formal request with the Australian National Audit Office (ANAO) to have the BOM and CSIRO audited.
The BOM claim their adjustments are “neutral” yet Ken Stewart showed that the trend in the raw figures for our whole continent has been adjusted up by 40%. The stakes are high. Australians could have to pay something in the order of $870 million dollars thanks to the Kyoto protocol, and the first four years of the Emissions Trading Scheme was expected to cost Australian industry (and hence Australian shareholders and consumers) nearly $50 billion dollars.
Given the stakes, the Australian people deserve to know they are getting transparent, high quality data from the Bureau of Meteorology (BOM). The small cost of the audit is nothing in comparison with the money at stake for all Australians. We need the full explanations of why individual stations have been adjusted repeatedly and non-randomly, and why adjustments were made decades after the measurements were taken. We need an audit of surface stations. (Are Australian stations as badly manipulated and poorly sited as the US stations? Who knows?)
The NZ equivalent to the Australian BOM is under an official review
The New Zealand Climate Science Coalition found adjustments that were even more inexplicable (0.006 degrees was adjusted up to 0.9 degrees). They decided to push legally and the response was a litany of excuses - until finally The National Institute for Water and Atmospheric Research (NIWA) was forced to disavow it’s own National Temperature Records, and belatedly pretend that it had never been intended for public consumption. But here’s the thing that bites: NZ signed the Kyoto protocol, arguably based very much on the NZ temperature record, and their nation owes somewhere from half a billion to several billion dollars worth of carbon credits (depending on the price of carbon in 2012).
Hence there is quite a direct link from the damage caused by using one unsubstantiated data set based on a single student’s report that no one can find or replicate that will cost the nation a stack of money. NIWA is now potentially open to class actions. (Ironically, the Australian BOM has the job of “ratifying” the reviewed NZ temperature record.)
Thanks to work by Ken Stewart, Chris Gillham, Andrew Barnham, Tony Cox, James Doogue, David Stockwell, as well as Cory Bernardi, Federal Senator for South Australia.
Download the full PDF of the request here.
See also this earlier press release.
By Alan Caruba
I have been reviewing books for fifty years and have long since lost count of how many books were written to propagate the global warming fraud, nor how many have been written to deconstruct it. That’s how the war of ideas is fought these days, along with documentaries, blogs and websites, conferences, and all the other ways lies are defeated by the truth.
From the earliest days the global warming “theory” was proposed I knew that it was a complete hoax. It never made any sense to me that an element of the earth’s atmosphere, carbon dioxide that measured an infinitesimal 0.0389%, could have an effect on the planet’s climate. Just one of the so-called “greenhouse gases”, water vapor - clouds - is 51 times greater than CO2.
Moreover, not one single computer model can factor in the effect clouds have on the planet’s weather because not one single meteorologist, living or dead, has a clue why they do what they do. They appear and disappear in the very definition of chaos. So it struck me as odd that all the computer models of the advocates of global warming always came to the same conclusion; it’s coming and the earth’s temperature will rise dramatically IF…
IF is the key word that global warming advocates, now called “warmists”, kept saying. If you don’t stop using coal and oil for energy, we’re doomed. If you don’t reduce your personal “carbon footprint”, we’re doomed. If we don’t immediately start using ethanol, wind and solar power, we’re doomed.
Beyond IF came an endless avalanche of claims that global warming was altering or affecting every single natural phenomenon in the world. The claim was that glaciers were melting. Polar bear populations were disappearing. Hurricanes were increasing. The seas were rising. Eventually, just about everything happening anywhere was blamed on global warming.
Follywood and the mass media signed onto this absurdity, ignoring the science involved and the most obvious fact that an entirely natural cooling cycle began in 1998 and continues to this day. The worst of it, however, was a combination of the way the government and the nation’s educational system became parties to this massive fraud. And still are!
The EPA claim that it has the authority to regulate CO2 is a pure lie and it is based on the global warming lie.
Ultimately, however, not one “warmest” ever once pointed to the single greatest factor in the earth’s climate, the sun.
All this brings me to a new book, ”Slaying the Sky Dragon: Death of the Greenhouse Gas Theory”, by eight co-authors, contributors whose expertise ranges across climatology, meteorology, physics, and mathematics, along with an expert in the legal aspects of the hoax. All have been derided as “deniers” and “skeptics.”
I know several of them as Internet friends, I count Hans Schreuder, Joseph A. Olsen, and John O’Sullivan among the many people who have helped me, over the years, to understand the complexities of climate science.
This book is not light reading. Indeed, if you don’t come equipped with an understanding of physics, for example, some chapters will remain beyond your grasp. And mine! Happily, most is easily comprehended. In sum, it is a damning condemnation of the great hoax of the modern era, perhaps the greatest hoax since the bogus economic theory of communism.
Real science is not arrived at by “consensus.” Real scientists actually seek to disprove the findings of other scientists until they cannot be disproved, affirming them finally as accurate.
Real science can be corrupted in the same way as other aspects of society can be. For me, the real crime of global warming is the way governmental agencies, beginning with the United Nations’ Intergovernmental Panel on Climate Change, deliberately falsified data, mostly based on computer models, to underwrite the global warming fraud. That is also what NOAA, NASA, and the EPA, have done, to name just three.
Now add in billions of dollars lavished on “climate research” conducted on university campuses from coast to coast. There were exceptions. Some university-based scientists disputed the bogus research and some were threatened with the loss of their jobs. The other crime involves the corruption of formerly respected science journals and general science-related media such as National Geographic.
I have used the words “hoax” and “fraud” interchangeably, but the latter refers to the way global warming was never about the climate and all about a handful of people becoming quite wealthy by setting up exchanges to buy and sell bogus “carbon credits” mandated by governments in order to emit CO2 in the normal process of manufacturing production and other applications.
Others have cashed in building solar and wind farms, or became producers of ethanol. None of these ventures would survive without government mandates requiring their use.
The Cap-and-Trade Act is one such fraud and is currently in the U.S. Senate’s political dead zone, hopefully to never be enacted. It is the global warming equivalent of Obamacare; the death of thousands of jobs and the economy.
I recommend you read “Slaying the Sky Dragon” as the definitive answer to more than twenty years of global warming lies.
See post here.
By Joseph D’Aleo, CCM, AMS Fellow
CO2 has been increasing since 1958 according to the measurements at Mauna Loa Observatory in Hawaii.
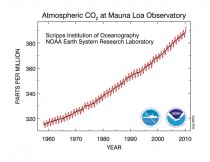
Enlarged.
In this analysis by Tom Quirk, a look inside the data suggests that the increase of CO2 in the atmosphere may not be from the CO2 derived from fossil fuels. His analysis concludes the increase in CO2 is driven by other processes related to the natural variability of the climate.
There are many reasons to challenge the claims that CO2 is harmful and must be reduced through regulation or worse yet sequestration. All life forms on the planet - animal and plants are carbon based. They release and in the case of plant life utilize carbon dioxide.
The average human emits 2.3 lbs of CO2 per day through respiration. Animal life likewise contributes. In most classrooms, auditoriums, workplaces, shopping malls, sport venues and other gathering places, CO2 concentrations are two to three times higher than the ambient (free air) levels of around 388 ppm. In submarines, the level may reach 20 to 40 times the ambient levels with no ill effects.
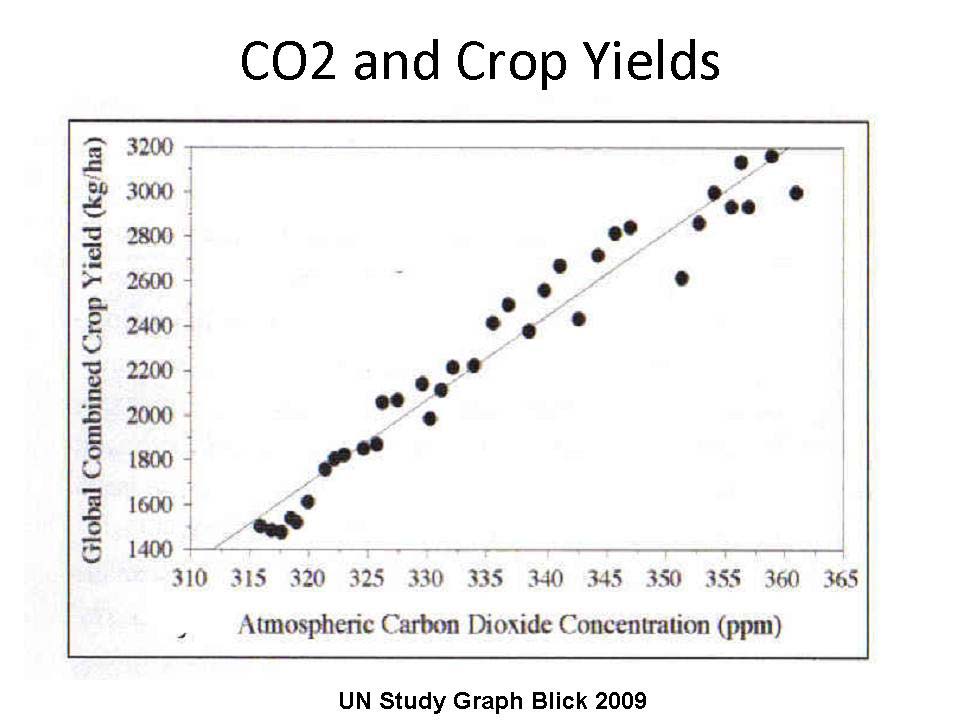
A boon to Agriculture
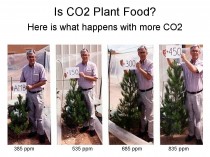
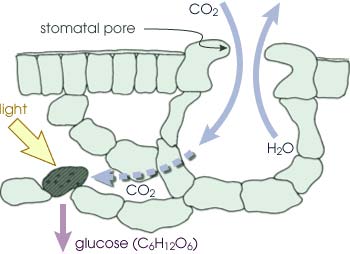
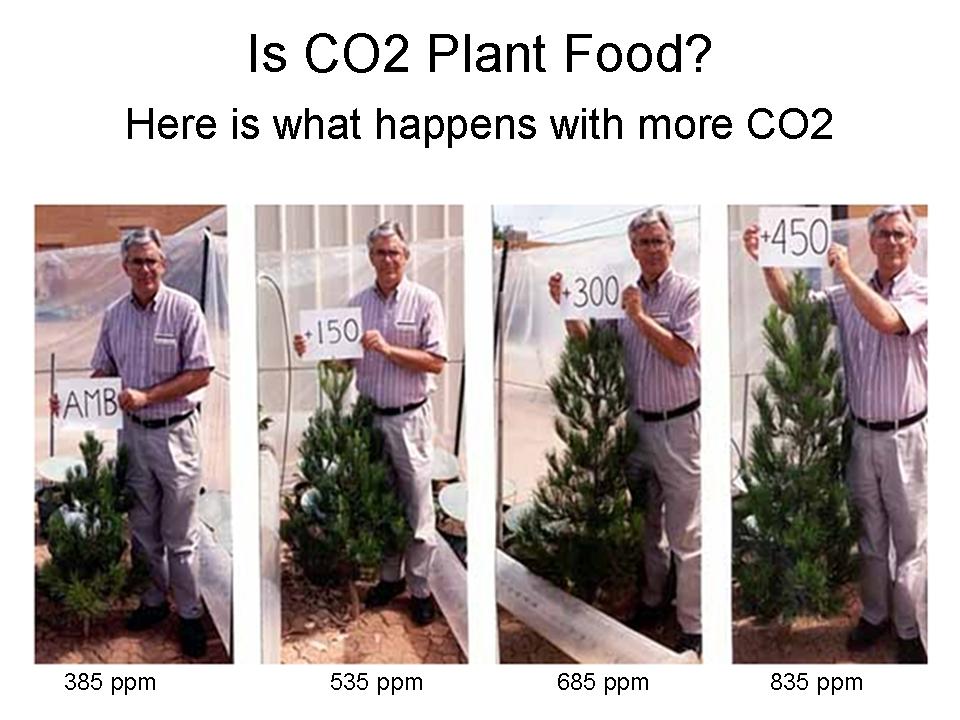
All plants require CO2 for photosynthesis and growth.

Enlarged.
During photosynthesis, plants absorb carbon dioxide and sunlight to create fuel - glucose and other sugars - for building plant structures. This process forms the foundation of the biological carbon cycle. (Illustration courtesy P.J. Sellers et al.)
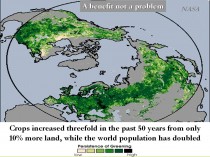
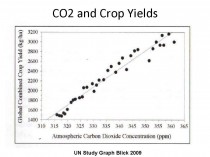
The globe has benefited in recent decades from minor cyclical warming and increases in CO2. NASA estimated an increase of yields by 30% over 50 years with 10% more arable land due to increased CO2 and slight cyclical warming. Better hybrids, fertilization, pest and disease controls and irrigation each contribute, but CO2 is key to this agricultural revolution that has enabled us to feed many hundreds of millions more of the earth’s population.
Even the UN agrees.
Many experiments in the laboratory and in the field (e.g with sugarcane in Brazil) have demonstrate this.
CO2 enriched plants are more vigorous and drought resistant and have lower water irrigation needs. CO2 benefits crops under moisture stress most! Nurseries pump CO2 into greenhouses to 1000 ppm to enhance plant growth.
Yale professor Robert Mendehlson testified to congress in 2000, climate change as projected then by IPCC would result in benefits of up to $23B/year to agriculture and forestry.
An extensively referenced 360-page book ”The Many Benefits of Atmospheric CO2” by the Idso’s lists fifty-five benefits of atmospheric CO2 enrichment.
Extreme Weather Connection Not There
New peer reviewed research reported in the Wall Street Journal rejects the claim that CO2 warming was causing increases in extreme weather and therefore was endangering health. The project’s initial findings, published last month, show no evidence of an intensifying weather trend. “In the climate models, the extremes get more extreme as we move into a doubled CO2 world in 100 years,” said atmospheric scientist Gilbert Compo, one of the researchers on the project at the University of Colorado, Boulder. “So we were surprised that none of the three major indices of climate variability that we used show a trend of increased circulation going back to 1871.”
In other words, researchers have yet to find evidence of more-extreme weather patterns over the period, contrary to what the models predict. “There’s no data-driven answer yet to the question of how human activity has affected extreme weather,” adds Roger Pielke Jr., another University of Colorado climate researcher. Given the unknowns, it’s possible that even if we spend trillions of dollars, and forgo trillions more in future economic growth, to cut carbon emissions to pre-industrial levels, the climate will continue to change - as it always has.
Temperatures are not correlated with CO2 long term
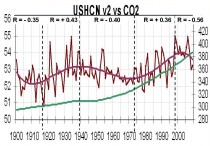
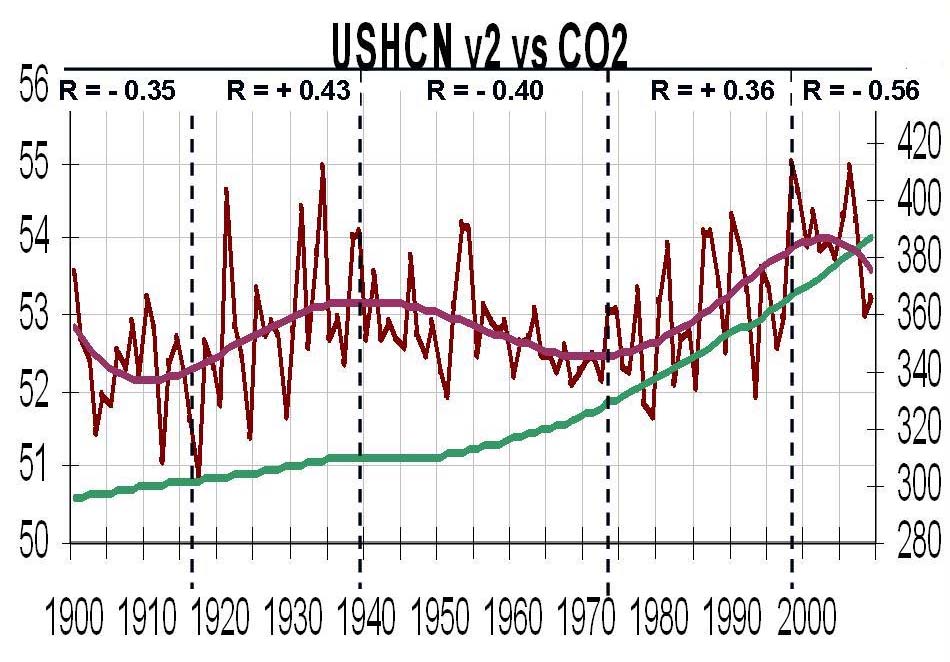
Indeed, despite all the claims to the contrary based on seriously contaminated surface data from global networks that are increasingly urbanized and poorly maintained, the data itself doesn’t support the CO2, global warming hypothesis.
We have shown that even for version 2 of the USHCN data set for the United States, correlation with NOAA ESRL CO2 data shows an on again off again correlation of temperatures with CO2 since 1900. In fact during periods totaling 64 years correlations have been negative (temperatures fell as CO2 increased) while only 44 years had the positive correlation claimed as proof of the connection been positive.
The Russian scientists Klashtorin and Lyubushin (2003) found a similar alternating pattern comparing GLOBAL temperature trends and World Fuel Consumption. They found a +0.92 from 1861 to 1875, a -0.71 from 1875 to 1910, +0.28 from 1910 to 1940, -0.88 from 1940 to 1975, +0.94 from 1975 to 2000. They found going back to 1861, that 69 years had positive and 80 negative correlations.
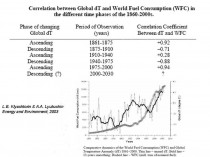
Enlarged.
In the paper they projected a reversal post 2000 which has verified. This on again, off-again correlation clearly suggests that CO2 is not the primary climate driver.
Summary
So real data - not models tuned for the desired result - suggests CO2 is not correlated with temperature changes, is not harmful to health, is instead beneficial to plants and thus mankind.
There are plenty of real environmental issues that need addressing and there needs to be major attention given to meeting energy needs for a colder world likely in coming decades. The misplaced focus on CO2 is preventing focus on both real environmental issues and a sane energy policy. PDF
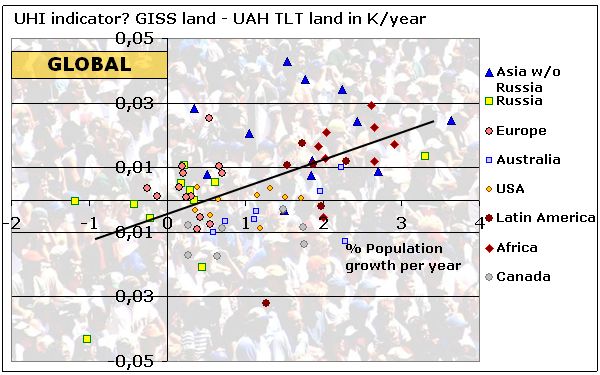
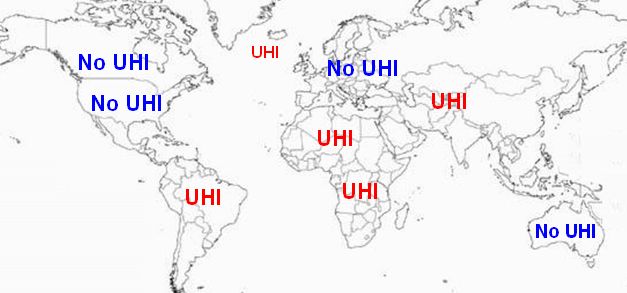
By Frank Lansner, Guest post on Jo Nova
The mystery: We know when we drive through a city that temperatures warm from the fringe to the middle. We know UHI is real, but how much does it affect the official records? Is a 2010 city 0.3 K hotter than a 1960 city? How would we know?
Frank Lansner has come up with a way that might approximate the UHI effect - very roughly. It’s well known that UHI gets bigger as cities grow, but the devil is in the detail. Frank argues that it’s not just the size of the city that matters, but it’s growth rate.
The USA is full of large cities, but there is not much difference between the trend in satellites and ground stations there. Frank’s approach could explain this - most of the growth in human population has come in regions like Africa, not the USA.
As argued in a previous article: we would expect to find more UHI error warming in areas with the largest population growth rate, not in areas with a constant population.

He figured that if we compare satellite records to ground stations and see if there is a divergence, we might be able to see an indicator of UHI. The info coming out of satellites ought not be affected as populations expand, but the ground stations are often near population centres and they gradually get surrounded with more square-kilometers of concrete and a bigger buffer of UHI. Hence Frank sectioned up the world, and looked at the trends from both sets of measurements.
None of this is simple as Frank points out. Populations don’t just grow evenly across regions, nor does each 10% increase in population translate into the same increase in industrial output (and presumably heat). Indeed Frank finds the trend changes in different regions of the world. What ever the reason, then the significant result of Frank’s analysis is that the ground based temperature stations contain, on average, nearly half a full degree (0.46 K) of extra heat trend 1979-2010 when compared to the satellite based data, and it occurs in exactly in the areas of the world with highest population growth rates: The developing countries.

WHY does ground based land temperatures show much more heat trend than UAH TLT in regions with high population rate compared to regions with low population rate?
So far, I have not managed to answer this without pointing to the obvious: UHI.
H/T SEPP
By Joseph D’Aleo, CCM, AMS Fellow
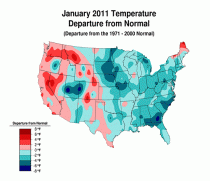
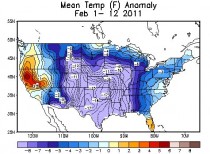
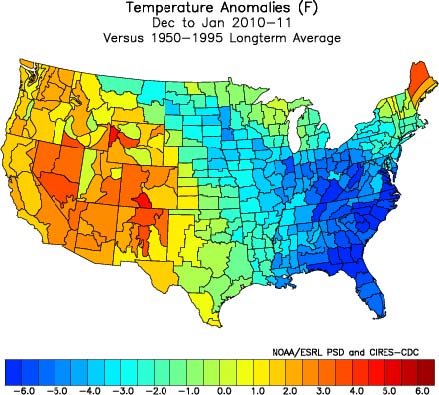
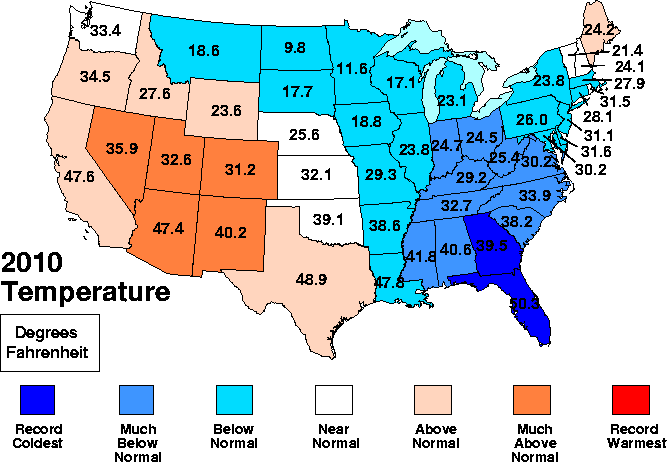
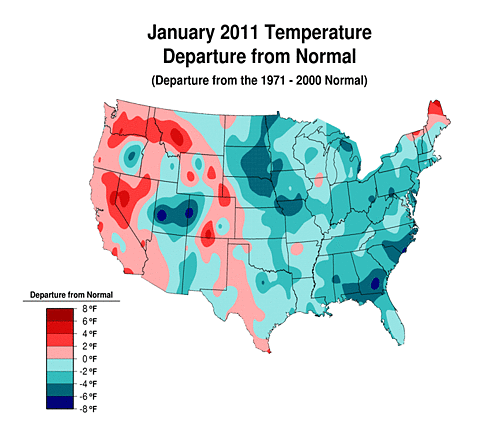
It was cold start to the winter most places east of the Rockies. The temperature In December and January was atypical La Nina with the coldest in the southeast (for NOAA NCDC, the region which includes Virginia, the Carolinas, Florida, Georgia and Alabama).

The average temperature for the southeast region in December was 39.4F, which was 8.03F below the 20th century (1901-2000) average, the third coldest on record. The December temperature trend for the entire period of record (1895-2010) is 0.06 degrees F per decade.
The average in January 2011 for the southeast was 42.0 F. This was -4.2 F cooler than the 1901-2000 (20th century) average, the 19th coolest January in 117 years. The January temperature trend for the period of record (1895 to present) is -0.2 degrees Fahrenheit per decade.
For the nation as a whole, the average temperature in January 2011 was 30.0 F. This was -0.8 F cooler than the 1901-2000 (20th century) average, the 37th coolest January in 117 years. The temperature trend for the period of record (1895 to present) is 0.1 degrees Fahrenheit per decade.
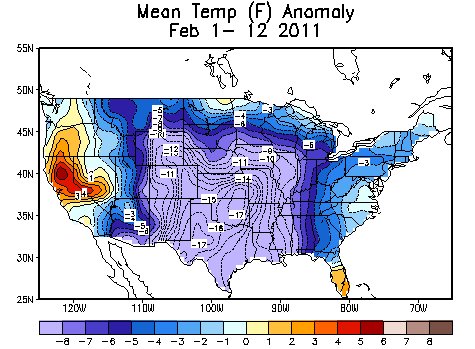
February started very cold in much of the nation though at least a brief February thaw is expected this week.
Ground zero for the cold in December and in December and January combined was Florida with Georgia close behind. Both states had their coldest Decembers.
For Florida, the first two winter months were the coldest in the entire record going back to 1895, beating out the cold winters of 1980/81, 1976/77 and 1917/18.
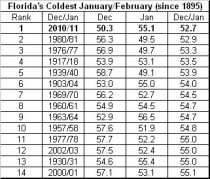
Enlarged.
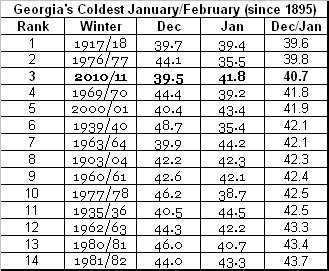
In Georgia, it was the third coldest December/January period since 1895, falling behind just the incredible 1917/18 winter (the coldest La Nina in the last 110 years) and 1976/77.

See PDF.
Houston - The cold weather experienced across much of the US in early February made its way deep into Mexico and early reports estimate 80-100 percent crop losses which are having an immediate impact on prices at US grocery stores with more volatility to come.
Wholesale food suppliers have already sent notices to supermarket retailers describing the produce losses in Mexico and the impact shoppers can expect. Sysco sent out a release(pdf) this week stating the early February freeze reached as far south as Los Mochis and south of Culiacan, both located in the state of Sinaloa, along the Gulf of California. The freezing temperatures were the worst the region has seen since 1957.
According to Sysco’s notice sent out this week:
“The early reports are still coming in but most are showing losses of crops in the range of 80 to 100%. Even shade house product was hit by the extremely cold temps. It will take 7-10 days to have a clearer picture frome growers and field supervisors, but these growing regions haven’t had cold like this in over half a century.”
At this time of year, Mexico is a major supplier to the US and Canada for green beans, cucumbers, squash, eggplant, asparagus, peppers and round and Roma tomatoes. Compounding the problem is the freezing cold that hit Florida in December and January.
Sysco continued with its dire report:
“Florida normally is a major supplier for these items as well but they have already been struck with severe freeze damage in December and January and up until now have had to purchase product out of Mexico to fill their commitments, that is no longer an option.”
Read more.
IBD Editorial: Stop EPA’s Energy TaxUpdate: See also this story in The Hill: House GOP spending bill prohibits funding for EPA climate regs
Federal Authority: At a contentious hearing on legislation to keep the EPA from regulating carbon dioxide as a pollutant, Republicans rightly called global warming a power-grabbing hoax that is all pain for no gain.
The assertion came at a Wednesday hearing before the House subcommittee on energy and power on the “Energy Tax Prevention Act of 2011.” The measure is designed to reassert the authority of Congress to levy taxes on the American people and direct public policy - powers that are being usurped by the unelected bureaucrats at the Environmental Protection Agency.
In a power grab that rivals ObamaCare in audacity and job-killing effects, the EPA has claimed unto itself the power to regulate carbon dioxide, a byproduct of human and animal respiration and the basis for all life on earth, as a pollutant. At least with ObamaCare, Congress - our representatives - voted to pass it.
The EPA claims science has given it the justification, and the Supreme Court has given it the authority, to regulate CO2 as a pollutant and impose regulations governing virtually every aspect of American business and our daily life almost down to our lawn mowers.
Leading off the witness list was Sen. James Inhofe, R-Okla., ranking member of the Senate Committee on Environment and Public Works and a co-author of the legislation with House Committee Chairman Fred Upton.
Inhofe rightly noted that Congress deliberately did not regulate so-called greenhouse gases with the Clean Air Act, a bill that was designed to deal with air quality, not climate change.
He also observed that EPA Director Lisa Jackson herself has acknowledged the Clean Air Act “is not specifically designed to address greenhouse gases.” The House-passed Waxman-Markey did, but it died with Senate inaction and the election of a new Congress, an election in which it was an issue. Along with Obama-Care, the American people also rejected the idea of taxing and regulating carbon dioxide.
Rep. Ed Whitfield, R-Ky., pointed out to Jackson, who was also called to testify, that Congress had rejected federal regulation of greenhouse gases on no fewer than three occasions. “Do you object to an up or down vote in Congress?” he asked her.
“I would not presume to tell Congress what to do,” Jackson answered, saying she was acting under the authority of a 5-4 Supreme Court ruling that let the EPA enforce the Clean Air Act, including heavy carbon emissions.
Inhofe disputed this, saying that while the Supreme Court said the EPA had the discretion to “decide whether greenhouse gases endanger public health and welfare,” it did not authorize draconian regulations based on flawed science, regulations that would impose an economy-crushing hidden tax on businesses, energy producers and American consumers.
Inhofe said he was there to question EPA’s authority, not the science. But he did point out that the agency’s own analysis found that its regulations covering CO2 from cars would by 2100 reduce global temperatures by 0.006 degree Celsius, an amount almost too small to measure or matter.
In his opening remarks, Inhofe also noted that Dr. Tom Wigley of the National Center for Atmospheric Research found that even full implementation of the Kyoto Protocol on greenhouse gases, including action by the U.S., Europe, Canada, Russia and others, would reduce global temperatures no more than 0.21 degree Celsius by 2100.
Not along ago Inhofe related on a YouTube video: “Lisa Jackson, Obama’s EPA administrator, admitted to me publicly that EPA based its action ... (issuing its CO2 endangerment finding) in good measure on the findings of the U.N.’s Intergovernmental Panel on Climate Change, or IPCC. She told me that EPA accepted those findings without any serious, independent analysis to see whether they were true.”
The EPA’s dangerous policy is based on flawed science that contradicts the intent of Congress and usurps its power, and its authority must be stopped. We count ourselves among those yearning to breathe free.
See Press blog.
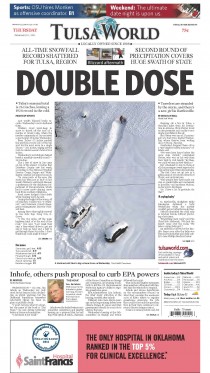
By Ryan Maue, Watts Up With That
From: NewsOK.com
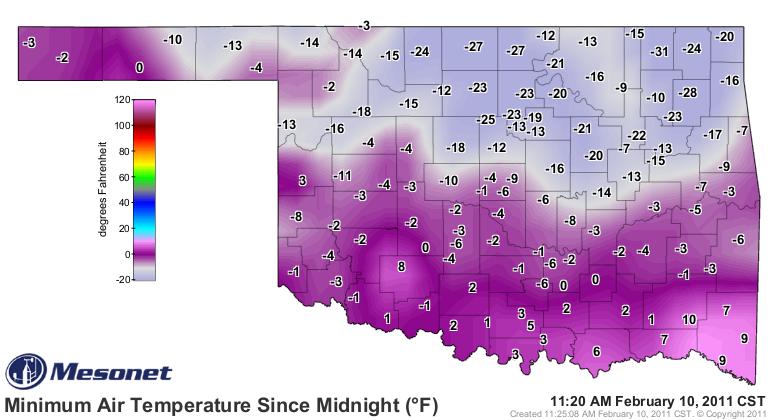
The coldest temperature ever recorded in Oklahoma was set today. The Oklahoma Mesonet weather station at Nowata reached minus 31 degrees Fahrenheit actual temperature at 7:40 a.m. today. That will be considered for the official state record.
That mark eclipses the previous all-time record low state temperature of minus 27 degrees, set at at Vinita, Feb. 13, 1905, and Watts, Jan. 18, 1930.
Also, the Mesonet station at Medford recorded a wind chill of minus 47 degrees at 7:45 a.m. setting a Mesonet record. The Oklahoma Mesonet, which began in 1994, has 120 stations throughout Oklahoma.
The cold came after a snow that set a new seasonal snowfall record in places like Tulsa.
-------
Hey Watts, you just went down! ![]()
Where is the -31F: “That’s me in the corner. That’s me in the spotlight. I’m Losing my global warming religion…
------------------
The average temperature in January 2011 was 30.0 F. This was -0.8 F cooler than the 1901-2000 (20th century) average, the 37th coolest January in 117 years. The temperature trend for the period of record (1895 to present) is 0.1 degrees Fahrenheit per decade.
1.48 inches of precipitation fell in January. This was -0.74 inches less than the 1901-2000 average, the 9th driest such month on record. The precipitation trend for the period of record (1895 to present) is -0.01 inches per decade. H/T Tom Nelson.
By Anthony Watts
From the AGU Journal Highlights, some news that NSIDC’s “death spiral” has zombie like characteristics, and that the ice may quickly return from the dead, even if the Arctic turned ice free during summer. Nature is more resilient it seems, than some people give it credit for.
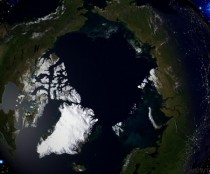
What an ice free Arctic might look like from space
No tipping point for Arctic Ocean ice, study says
Declines in the summer sea ice extent have led to concerns within the scientific community that the Arctic Ocean may be nearing a tipping point, beyond which the sea ice cap could not recover. In such a scenario, greenhouse gases in the atmosphere trap outgoing radiation, and as the Sun beats down 24 hours a day during the Arctic summer, temperatures rise and melt what remains of the polar sea ice cap. The Arctic Ocean, now less reflective, would absorb more of the Sun’s warmth, a feedback loop that would keep the ocean ice free.
However, new research by Tietsche et al. suggests that even if the Arctic Ocean sees an ice-free summer, it would not lead to catastrophic runaway ice melt.
The researchers, using a general circulation model of the global ocean and the atmosphere, find that Arctic sea ice recovers within 2 years of an imposed ice-free summer to the conditions dictated by general climate conditions during that time. Furthermore, they find that this quick recovery occurs whether the ice-free summer is triggered in 2000 or in 2060, when global temperatures are predicted to be 2 degrees Celsius (3.6 degrees Fahrenheit) warmer.
During the long polar winter the lack of an insulating ice sheet allows heat absorbed by the ocean during the summer to be released into the lower atmosphere. The authors find that increased atmospheric temperatures lead to more energy loss from the top of the atmosphere as well as a decrease in heat transport into the Arctic from lower latitudes. So the absence of summer sea ice, while leading to an increase in summer surface temperatures through the ice-albedo feedback loop, is also responsible for increased winter cooling. The result is a swift recovery of the Arctic summer sea ice cover from the imposed ice-free state.
Title: “Recovery mechanisms of Arctic summer sea ice”
Authors: S. Tietsche, D. Notz, J. H. Jungclaus, and J. Marotzke
Max Planck Institute for Meteorology, Hamburg, Germany
Source: GEOPHYSICAL RESEARCH LETTERS, VOL. 38, L02707, 4 PP., 2011 doi:10.1029/2010GL045698
We examine the recovery of Arctic sea ice from prescribed ice-free summer conditions in simulations of 21st century climate in an atmosphere-ocean general circulation model. We find that ice extent recovers typically within two years. The excess oceanic heat that had built up during the ice-free summer is rapidly returned to the atmosphere during the following autumn and winter, and then leaves the Arctic partly through increased longwave emission at the top of the atmosphere and partly through reduced atmospheric heat advection from lower latitudes. Oceanic heat transport does not contribute significantly to the loss of the excess heat. Our results suggest that anomalous loss of Arctic sea ice during a single summer is reversible, as the ice-albedo feedback is alleviated by large-scale recovery mechanisms. Hence, hysteretic threshold behavior (or a “tipping point") is unlikely to occur during the decline of Arctic summer sea-ice cover in the 21st century. Post.
Accuweather’s Joe Bastardi on Climate Realist
This winter is on track to become the coldest for the nation as a whole since the 1980s or possibly even the late 1970s. According to AccuWeather.com Chief Long Range Forecaster Joe Bastardi, three or four out of the next five winters could be just as cold, if not colder.
He is worried that next winter, for example, will be colder than this one.
Bastardi adds that with the U.S. in the middle of one of its worst recessions in its history and the price of oil in question, he is extremely concerned about the prospect for more persistent cold weather in the coming years putting increased financial hardship on Americans. “Cold is a lot worse than warm,” Bastardi said, “and that’s why your energy bill goes up during the winter time: because of the fact that it takes a lot to heat a house.”
While there are many different factors that are playing into Bastardi’s forecast, one of the primary drivers is La Nina and the trends that have been observed in winters that follow the onset of a La Nina.
Current La Nina Signals More Cold Winters Ahead
La Nina occurs when sea surface temperatures across the equatorial central and eastern Pacific are below normal. La Nina and its counterpart, El Nino, which occurs when sea surface temperatures of the same region are above normal, have a large influence on the weather patterns that set up across the globe.
The current La Nina, which kicked in this past summer, is unprecedented after becoming the strongest on record in December 2010. Bastardi thinks this La Nina will last into next year, though it will be weaker, and will not disappear completely until 2012. According to Bastardi, studies over the past 100 years or so show that after the first winter following the onset of a La Nina, the next several winters thereafter tend to be colder than normal in the U.S.
He says the first winter during a La Nina tends to be warm. The next winter that follows is usually less warm, and the winter after that is usually cold.
“There’s a natural tendency for that to happen because of the large-scale factors,” Bastardi commented. “What’s interesting about what we’re seeing here is that [the current La Nina] is starting so cold.” Temperatures this winter so far are averaging below normal across much of the eastern two-thirds of the country.
He adds, “If the past predicts the future, then the first year La Nina is warmer than the combination of the following two.” He said that with the exception of the winters of 1916-1917 and 1917-1918, the first year of every moderate or stronger La Nina available for study has featured a warmer-than-normal winter from the Plains eastward. This winter, it has been colder than normal.
Taking a look at one of the exceptions, the La Nina winter of 1916-1917, colder-than-normal conditions were observed across the northern part of the Plains and East (not the South). Bastardi said that never before have colder-than-normal conditions been observed across the South during a first-year La Nina winter, as has been the case this winter.
If this winter, which has been colder than normal across the eastern two-thirds of the country, is historically supposed to be the warmest of the next three winters for the U.S., according to Bastardi, we have some frigid times ahead.
Bastardi: Shift to Colder Climate Predicted Next 20-30 Years
Bastardi thinks that not only will the next few winters be colder than normal for much of the U.S., but that the long-term climate will turn colder over the next 20 to 30 years. “What’s interesting about what we’re seeing here is that [the current La Nina] is starting so cold,” said Bastardi, “and it’s coinciding with bigger things that are pushing the overall weather patterns and climate in the Northern Hemisphere and, in fact, globally over the next 20 to 30 years that we have not really dealt with, nor can we really quantify.”
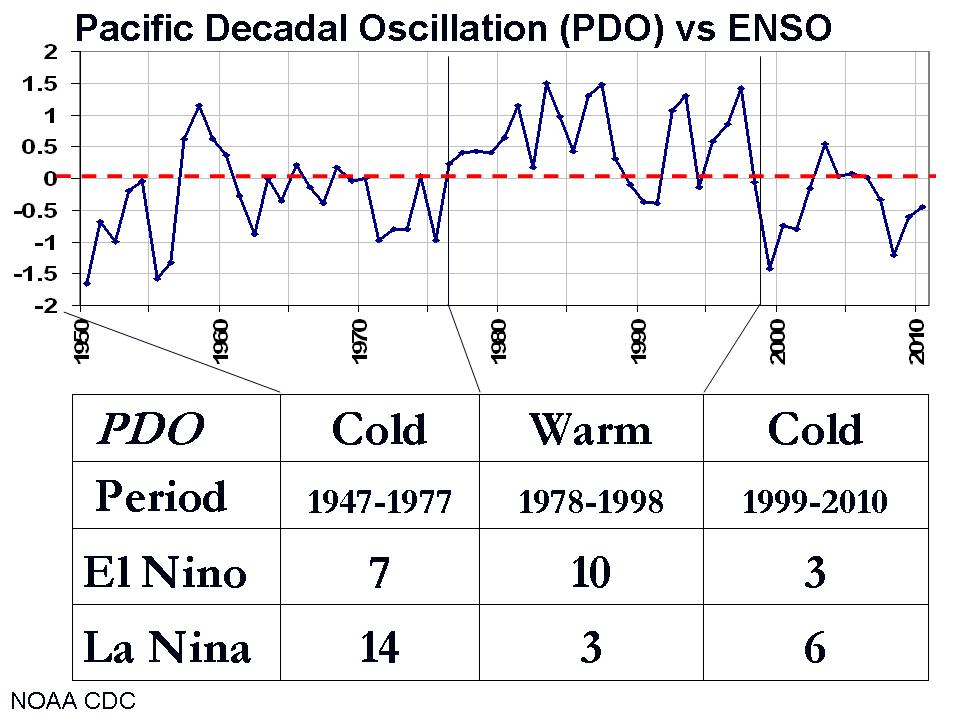
“That ties into a lot of this arguing over climate change,” he added. Bastardi has pointed out that the Pacific Decadal Oscillation (PDO), which is a pattern of Pacific climate variability that shifts phases usually about every 20 to 30 years, has shifted into a “cold” or “negative” phase. Over the past 30 years or so, according to Bastardi, the PDO has been “warm” or “positive.”
This change to a cold PDO over the next 20 to 30 years, he says, will cause La Ninas to be stronger and longer than El Ninos. Bastardi adds that when El Ninos do kick in, if they try to come on strong like they did last year, they will get “beaten back” pretty quickly.
Icecap Note:
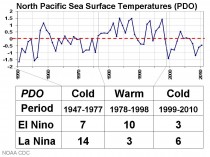
El Ninos are more frequent above (enlarged here) and longer below (enlarged here) in the PDO warm phase. La Ninas exhibit the same frequency and length dominance in the cold phase.
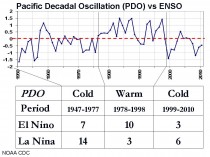
“When you have a cold PDO and lots of La Ninas, when El Ninos do come on, you generally tend to have cold, snowy weather patterns across the U.S.,” Bastardi said. “That’s what we saw in the 1960s and 1970s.” See post and video here.
See also video by Piers Corbyn on the late winter in the UK.
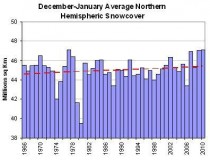
By Joseph D’Aleo
December and January have seen the greatest snowcover for the Northern Hemisphere in the record (back to 1966). It beats out 2009/10 in second and 1977/78 in third place and 2007/08 in fourth place (source: Rutgers snow lab). Notice the UPWARD trend over the period of record.
Alarmists and their enablers in the media want to blame excess moisture due to global warming. As the Goracle himself puts it “Snow has two simple ingredients: cold and moisture. Warmer air collects moisture like a sponge until it hits a patch of cold air. When temperatures dip below freezing, a lot of moisture creates a lot of snow.” And even NOAA’s Overland gets in on the obfuscation by using the same reason for the snowy cold winters the last few years as the mild, snowless winters in 2004 in this Steve Goddard post.
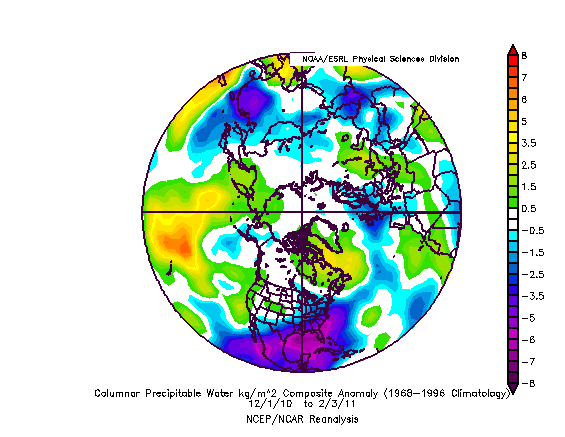
But cold air hold LESS moisture not more and indeed the average anomaly of precipitable water from the surface to 18,000 feet (500mb) from December 1, 2010 to February 3, 2011 is below the long term average (blues and purples) in the region where the snow has been anomalously heavy - northern Europe and central and eastern United States.
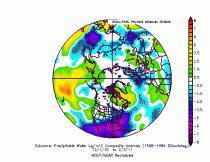
You get record or anomalous snow from unusually cold air unusually far south not unusually warm air unusually far north.
By the way, in Vermont, the “Vermont State Police in Rutland have reported a record number of “lost” skiers at Vermont ski resorts and backcountry ski areas since December. Heavy snowfall and whiteout conditions have added to the problem of skiers losing their ways on area mountain slopes.” Like the alarmists, they have lost their way.
----------------
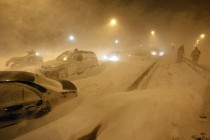
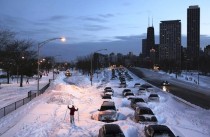
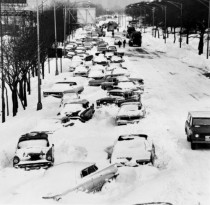
The Snowstorm of February 1-2, 2011 - Select Pictures
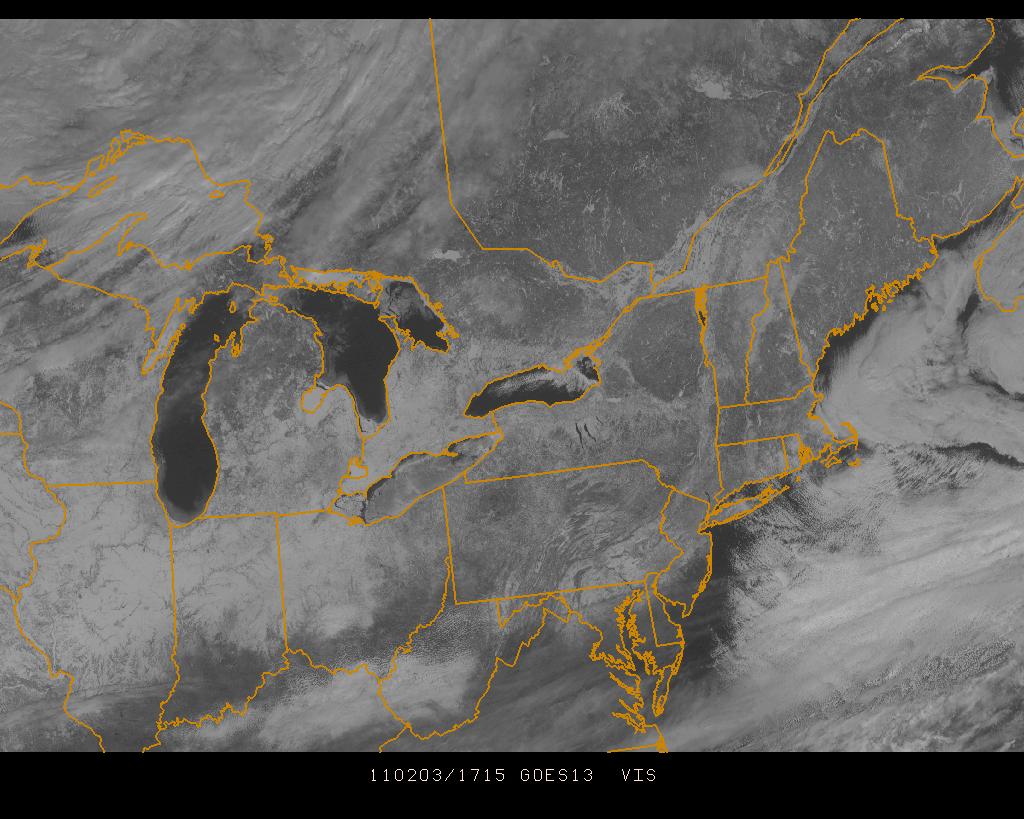
By Joseph D’Aleo, CCM
The monster as seen from space. Though not exceptionally deep in terms of central pressure, the storm was on the leading edge of a huge arctic high and to the west of the track in the plains up to Chicago, there was a blizzard.
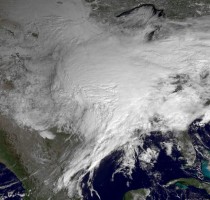
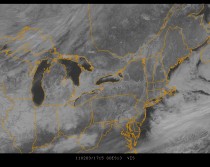
Here is the view from the satellite today of the snowcovered ground.
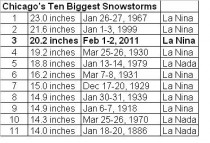
In Chicago Illinois, the storm was the third largest behind 1999 and the big storm of 1967. All were in years with La Nina and a negative PDO following strong El Ninos.
First two photos from Chicago in 2011 then one in 1967 (courtesy of Dr. Richard Keen).
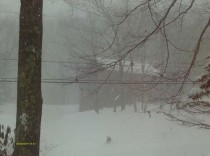
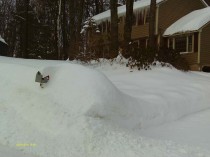
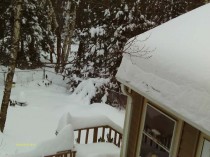
Then some from southern New Hampshire where 14” of snow brought snow depth to between 3 and 4 feet. The first shows walkway to my home with 5 foot mounds.

Here is the snow during the heart of the storm.
The next is my home before the snow blower did its final pass.
Have to get a snow rake for my roof.
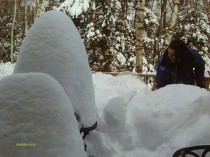
My daughter shoveling snow off my deck to prevent collapse.
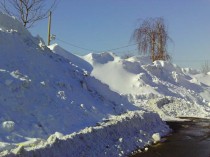
Attention Walmart shoppers: this week free snow, help yourself in the parking lot.
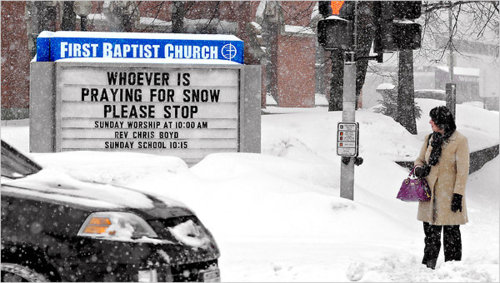
My church.
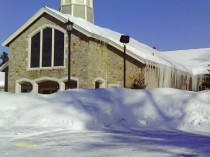
The church photo that has gone viral says it all.

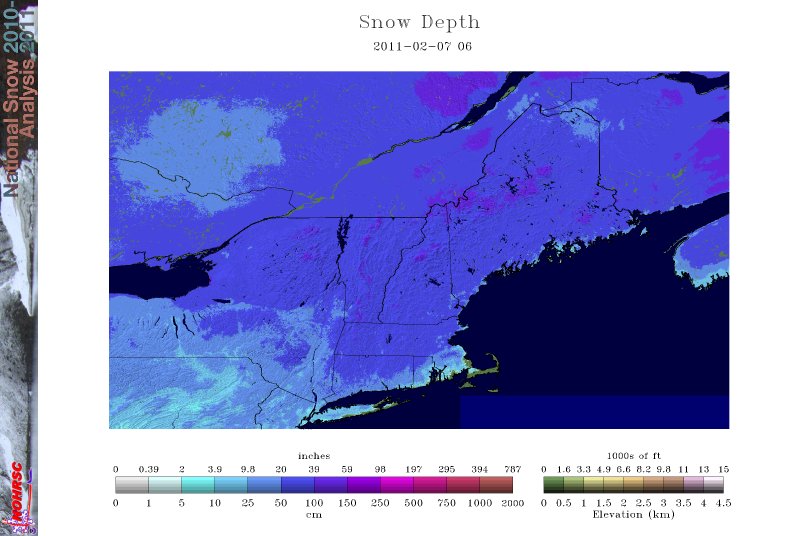
See snow depth for the northeast below. Similar story north central.
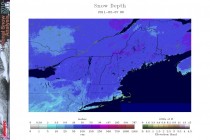
See PDF.
More to follow on why this winter has been so snowy and extreme coming next week. Meanwhile you may enjoy Al Gore’s take on what caused this extreme cold and snow. Can you guess?
Madhav Khandekar: ‘Global Warming Is Modest And No Threat To Humanity’Dr. Khandekar is a frequent Icecap poster. He has studied extremes of climate in North America and his native India. Here he reports for GWPF on the state of the climate from his perspective.
“The current global warming is modest and is not of any threat to humanity,” said Dr Madhav Khandekar, Environment Canada Expert Reviewer for the IPCC.
Pointing out to various graphs at a lecture on Extreme Weather, Monsoon Floods and the Uncertain Science of Global Warming, hosted by the Geological Society of India, he explained that climate change has been a natural phenomena for centuries and it is premature to blame climate changes on global warming (sic).
“From the geological perspective, the earth has been warming and cooling for long periods. Severe droughts and floods happened even a hundred years ago. Let’s not rush in to say that climatic changes are due to human activity,” he said. “Temperatures are impacted by road, buildings, and heat produced from air conditioners. We do not take that into consideration when studies have shown that nearly 50% of increase in temperature is due to the urban impact.”
He also revealed that the present warming in Greenland is no more than what it was in the 1940s. “It was significantly warmer then, so I don’t expect sea levels to rise much.”
“We may be entering into a significantly colder era. That’s what we should worry about and not global warming. “Several low temperature and snow accumulation records have been broken in the last five years. Neither the IPCC nor climate change models offer any explanation for this,” he said. “There is a disconnect when we say that there is global warming while we have been witnessing some of the coldest winters.”
About the impact of variations in temperature on the agriculture industry, Dr Khandekar pointed outthat the solution to the problem does not lie in mitigation, but in adapting to the climate changes. Chiranjeevi Singh, retired IAS officer, pointed out that the view from Canada, where Dr Khandekar lives, is optimistic. But for India increase in temperature is of concern.
“Previously the cyclic increase in temperature occurred when the world population was less than a billion. How the planet is going to sustain a current population of 6 billion is a problem. We are dealing with forces we do not fully understand and therefore it is better to be prepared for the worst,” he said.
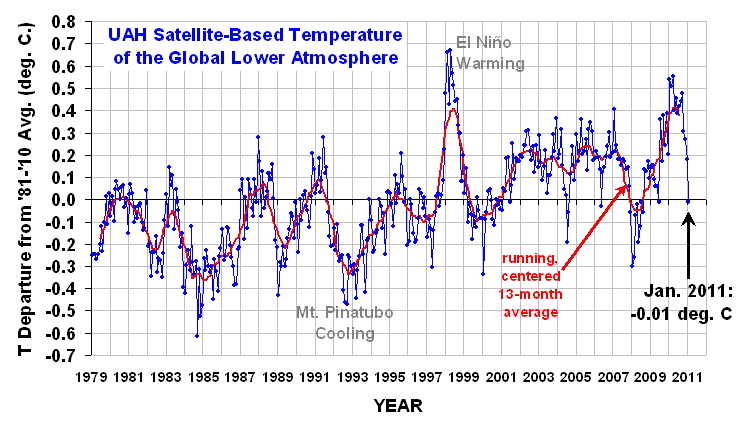
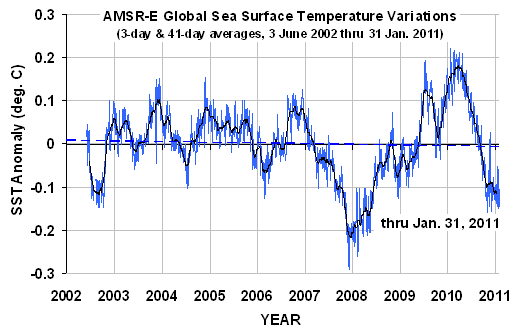
By Dr. Roy Spencer
...although this, too, shall pass, when La Nina goes away.
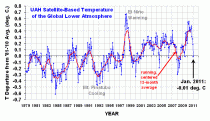
LA NINA FINALLY BEING FELT IN TROPOSPHERIC TEMPERATURES
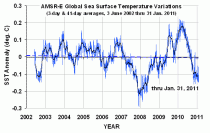
January 2011 experienced a precipitous drop in lower tropospheric temperatures over the tropics, Northern Hemisphere, and Southern Hemisphere. This was not unexpected, since global average sea surface temperatures have been falling for many months, with a head start as is usually the case with La Nina.
This is shown in the following plot (note the shorter period of record, and different zero-baseline):
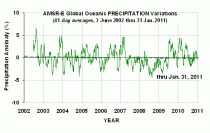
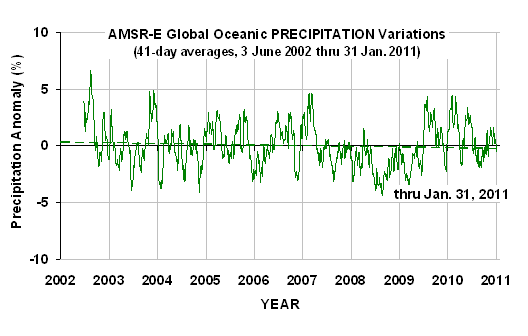
SO WHY ALL THE SNOWSTORMS?
While we would like to think our own personal experience of the snowiest winter ever in our entire, Methuselah-ian lifespan has some sort of cosmic - or even just global - significance, I would like to offer this plot of global oceanic precipitation variations from the same instrument that measured the above sea surface temperatures (AMSR-E on NASA’s Aqua satellite):
Note that precipitation amounts over the global-average oceans vary by only a few percent. What this means is that when one area gets unusually large amounts of precipitation, another area must get less.
Precipitation is always associated with rising air, and so a large vigorous precipitation system in one location means surrounding regions must have enhanced sinking air (with no precipitation).
In the winter, of course, the relatively warmer oceans next to cold continental air masses leads to snowstorm development in coastal areas. If the cold air mass over the midwest and eastern U.S. is not dislodged by warmer Pacific air flowing in from the west, then the warm oceanic air from the Gulf of Mexico and western Atlantic keeps flowing up and over the cold dome of air, producing more snow and rain. The “storm track” and jet stream location follows that boundary between the cold and warm air masses.
See Roy’s full post and comments.
See also this GWPF post by David Whitehouse on the temperatures of 2010.