


By Rusty Kapela, WCM, NWS Milwaukee
We took a look at the long-term temperatures observed for Milwaukee, and calculated the number consecutive days with temperatures above 32F - that is, the minimum temperature for any calendar day had to be above the freezing mark of 32F. In a rough sense, we were looking for the number of consecutive days each year that plants had a chance to grow or survive. We found some interesting trends, but in general, there has been a lengthening of the growing season since the 1960s, but we haven’t exceeded what was observed in some of the years during the perod of 1900 to 1934.
Below is a graph of the annual average temperaure for Milwaukee - it also shows an upward trend in recent years. However, keep in mind that the location of the observations moved from the downtown area to Mitchell Field.
Some climate researchers have noted that a good portion of the increase in temperatures in the past couple decades was due to warmer overnight minimum temperatures - in other words night-time temperatures increased more than the daytime temperaures. So, we went back into the record books to count the number of days each year with minimum temperatures at or above 70 F. The hot summer of 1995 really stands out, as well as some of those hot years in the early 1930s. The year of 1921 stands out as well with 34 days with minimum temperatures at or above 70F. The graph below shows the results.
See the story here.
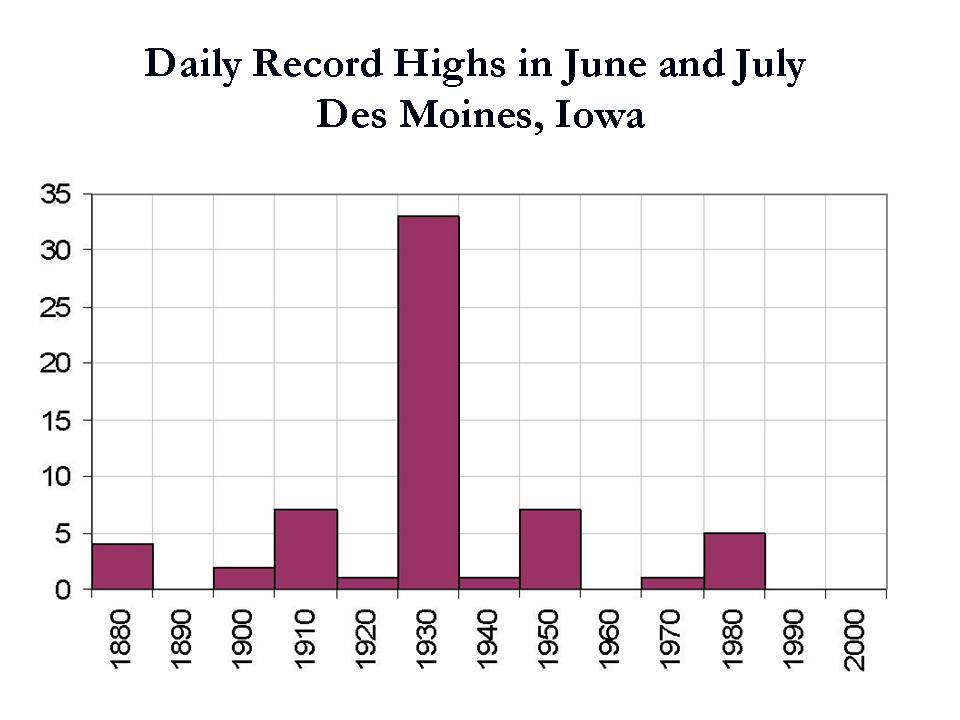
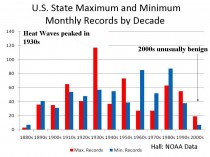
Nicely done guys. Here is the the decadal plot of record highs in June and July for Des Moines, Iowa. Notice the dominance of the 1930s with 33 records out of a possible 61. The most recent 5 records came in the heat wave of 1988. There have been NO records highs since despite the nonsense in the NOAA CCSP and IPCC reports that heat wave frequency is increasing in frequency especially over the continents. You can’t find a more continental location than Des Moines, IA.
********************
Forecasting Global Temperatures
By David Whitehouse
The recent spate of scientific papers that are attempting to predict what the earth’s temperature might be in the coming decades, and also explain the current global temperature standstill, are very interesting because of the methods used to analyse temperature variations, and because they illustrate the limitations of our knowledge.
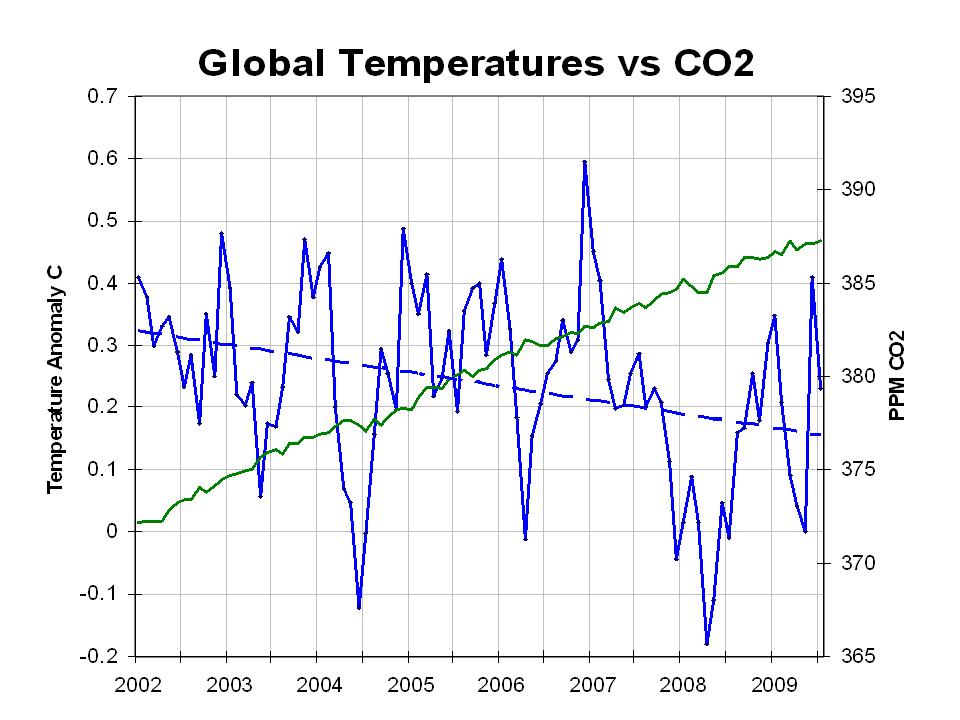
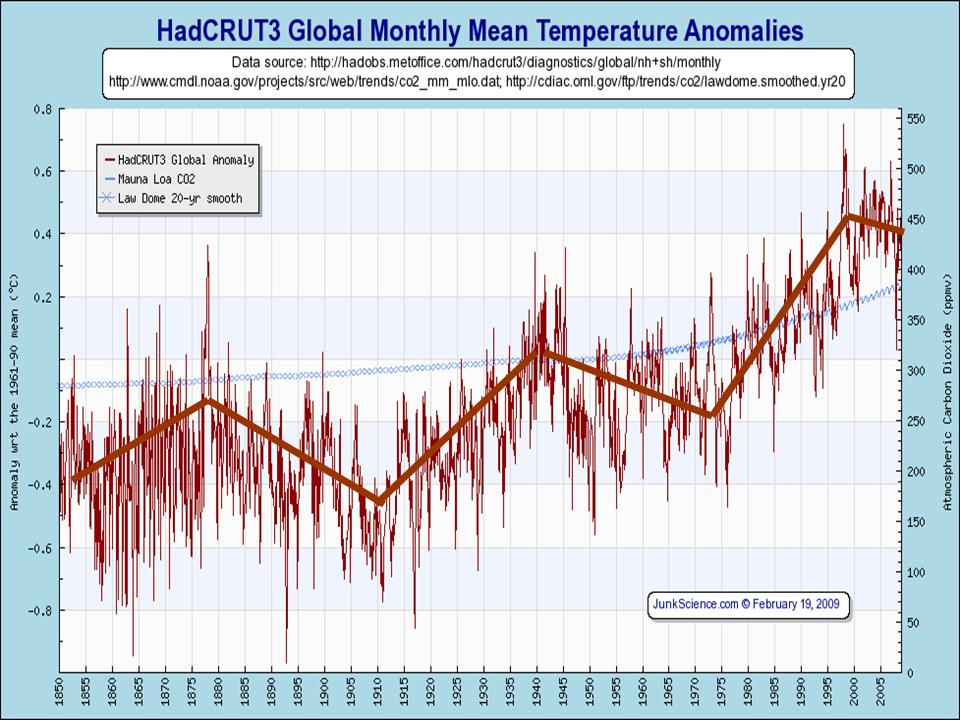
Recall that only one or two annual data points ago many scientists, as well as the most vocal ‘campaigners,’ dismissed the very idea that the world’s average annual temperature had not changed in the past decade. Today it is an observational fact (enlargement of graphic below) that can no longer be ignored. We should also not forget that nobody anticipated it. Now, post facto, scientists are looking for an explanation, and in doing so we are seeing AGW in a new light.
The main conclusion, and perhaps it’s no surprise, to be drawn about what will happen to global temperatures is that nobody knows.
The other conclusion to be drawn is that without exception the papers assume a constantly increasing AGW in line with the increase of CO2. This means that any forecast will ultimately lead to rising temperatures as AGW is forever upward and natural variations have their limits. But there is another way of looking at the data. Instead of assuming an increasing AGW why not look for evidence of it in the actual data. In other words let the data have primacy over the theory.
Lean and Rind try to isolate and analyse the various factors that affect decadal changes in the temperature record; El Nino, volcanic aerosols, solar irradiance and AGW. Their formula that links these factors together into a time series is quite simple (indeed there is nothing complicated about any of the papers looking at future temperature trends) though in the actual research paper there is not enough information to follow through their calculations completely.
El Nino typically produces 0.2 deg C warming, volcanic aerosols 0.3 deg C cooling on short timescales, solar irradiance 0.1 deg C (I will come back to this figure in a subsequent post) and the IPCC estimate of AGW is 0.1 deg C per decade.
It should also be noted that natural forces are able to produce a 0.5 deg C increase, although over a longer period. The 0.5 deg C warming observed between say 1850 and 1940 is not due to AGW.
The temperature increase since 1980 is in fact smaller than the rise seen between 1850 - 1940, approx 0.4 deg C. This took place in less than two decades and was followed by the current standstill. A fact often overlooked is that this recent temperature increase was much greater than that due to the postulated AGW effect (0.1 deg C per decade). It must have included natural increases of a greater magnitude.
This is curious. If the recent temperature standstill, 2002-2008, is due to natural factors counteracting AGW, and AGW was only a minor component of the 1980 -1998 temperature rise, then one could logically take the viewpoint that the increase could be due to a conspiracy of natural factors forcing the temperature up rather than keeping the temperature down post 2002. One cannot have one rule for the period 2002 - 2008 and another for 1980 -1998!
Lean and Rind estimate that 73% of the temperature variability observed in recent decades is natural. However, looking at the observed range of natural variants, and their uncertainties, one could make a case that the AGW component, which has only possibly shown itself between 1980 - 98, is not a required part of the dataset. Indeed, if one did not have in the back of one’s mind the rising CO2 concentration and the physics of the greenhouse effect, one could make out a good case for reproducing the post 1980 temperature dataset with no AGW!
Natural variations dominate any supposed AGW component over timescales of 3 - 4 decades. If that is so then how should be regard 18 years of warming and decades of standstills or cooling in an AGW context? At what point do we question the hypothesis of CO2 induced warming?
Lean and Rind (2009) look at the various factors known to cause variability in the earth’s temperature over decadal timescales. They come to the conclusion that between 2009-14 global temperatures will rise quickly by 0.15 deg C - faster than the 0.1 deg C per decade deduced as AGW by the IPCC. Then, in the period 2014-19, there will be only a 0.03 deg C increase. They believe this will be chiefly because of the effect of solar irradiance changes over the solar cycle. Lean and Rind see the 2014-19 period as being similar to the 2002-8 temperature standstill which they say has been caused by a decline in solar irradiance counteracting AGW.
This should case some of the more strident commentators to reflect. Many papers have been published dismissing the sun as a significant factor in AGW. The gist of them is that solar effects dominated up to 1950, but recently it has been swamped by AGW. Now however, we see that the previously dismissed tiny solar effect is able to hold AGW in check for well over a decade - in fact forcing a temperature standstill of duration comparable to the recent warming spell.
At least the predictions from the various papers are testable. Lean and Rind (2009) predict rapid warming. Looking at the other forecasts for near-future temperature changes we have Smith et al (2007) predicting warming, and Keenlyside et al (2008) predicting cooling.
At this point I am reminded that James Hansen ‘raised the alarm’ about global warming in 1988 when he had less than a decade of noisy global warming data on which to base his concern. The amount of warming he observed between 1980 and 1988 was far smaller than known natural variations and far larger than the IPCC would go on to say was due to AGW during that period. So whatever the eventual outcome of the AGW debate, logically Hansen had no scientific case.
There are considerable uncertainties in our understanding of natural factors that affect the earth’s temperature record. Given the IPCC’s estimate of the strength of the postulated AGW warming, it is clear that those uncertainties are larger than the AGW effect that may have been observed. Read more here.
UK climate scepticism more commonBy Sudeep Chand, BBC
The British public has become more sceptical about climate change over the last five years, according to a survey. Twice as many people now agree that “claims that human activities are changing the climate are exaggerated”. Four in 10 believe that many leading experts still question the evidence. One in five are “hard-line sceptics”.

Are solar changes or greenhouse emissions driving warming?
The survey, by Cardiff University, shows there is still some way to go before the public’s perception matches that of their elected leaders. The results were announced at the British Science Festival in Guildford by Cardiff’s Lorraine Whitmarsh. What we have to get across is that residual uncertainty in science is normal
A questionnaire survey was filled in by 551 people, from a range of ages and backgrounds, between September and November last year. Although the findings are similar to those of other UK surveys, this is the first to show that people may be becoming “tired” of claims surrounding climate change.
Dr Whitmarsh told BBC News: “It is difficult for people to perceive what is and isn’t climate change. “But I think what we have to get across is that residual uncertainty in science is normal. “Unfortunately, some people latch on to this uncertainty and say ‘let’s carry on as we are’.” She feels that many people are not “playing their part” in reducing humanity’s impact on the environment. “In general people are showing little willingness to change their lifestyles. “They will recycle, unplug the TV and change their light bulbs; but they won’t change how they travel or how they eat. “These are the things that are going to make the biggest difference.”
Half of the people surveyed believed the media was too alarmist. And a third said there was too much conflicting evidence to know what is actually happening. Dr Whitmarsh added: “We need to make it clear to people what is due to climate change and what is not. “It is time we made it real to people.”
Other surveys have shown that people in the UK are more sceptical than those in Europe, but less than those in the US.
WHO IS THE MOST ‘SCEPTICAL’?
Men more than women
Rural more than urban
Older people
High earners
Conservative voters more than Lib Dem voters; Lib Dem voters more than Labour voters
Read more here.
By David Whitehouse
The recent spate of scientific papers that are attempting to predict what the earth’s temperature might be in the coming decades, and also explain the current global temperature standstill, are very interesting because of the methods used to analyse temperature variations, and because they illustrate the limitations of our knowledge.
Recall that only one or two annual data points ago many scientists, as well as the most vocal ‘campaigners,’ dismissed the very idea that the world’s average annual temperature had not changed in the past decade. Today it is an observational fact that can no longer be ignored. We should also not forget that nobody anticipated it. Now, post facto, scientists are looking for an explanation, and in doing so we are seeing AGW in a new light.
The main conclusion, and perhaps it’s no surprise, to be drawn about what will happen to global temperatures is that nobody knows.
The other conclusion to be drawn is that without exception the papers assume a constantly increasing AGW in line with the increase of CO2. This means that any forecast will ultimately lead to rising temperatures as AGW is forever upward and natural variations have their limits. But there is another way of looking at the data. Instead of assuming an increasing AGW why not look for evidence of it in the actual data. In other words let the data have primacy over the theory.
Lean and Ride try to isolate and analyse the various factors that affect decadal changes in the temperature record; El Nino, volcanic aerosols, solar irradiance and AGW. Their formula that links these factors together into a time series is quite simple (indeed there is nothing complicated about any of the papers looking at future temperature trends) though in the actual research paper there is not enough information to follow through their calculations completely.
El Nino typically produces 0.2 deg C warming, volcanic aerosols 0.3 deg C cooling on short timescales, solar irradiance 0.1 deg C (I will come back to this figure in a subsequent post) and the IPCC estimate of AGW is 0.1 deg C per decade.
It should also be noted that natural forces are able to produce a 0.5 deg C increase, although over a longer period. The 0.5 deg C warming observed between say 1850 and 1940 is not due to AGW.
The temperature increase since 1980 is in fact smaller than the rise seen between 1850 - 1940, approx 0.4 deg C. This took place in less than two decades and was followed by the current standstill. A fact often overlooked is that this recent temperature increase was much greater than that due to the postulated AGW effect (0.1 deg C per decade). It must have included natural increases of a greater magnitude.
This is curious. If the recent temperature standstill, 2002-2008, is due to natural factors counteracting AGW, and AGW was only a minor component of the 1980 -1998 temperature rise, then one could logically take the viewpoint that the increase could be due to a conspiracy of natural factors forcing the temperature up rather than keeping the temperature down post 2002. One cannot have one rule for the period 2002 - 2008 and another for 1980 -1998!
Lean and Rind estimate that 73% of the temperature variability observed in recent decades is natural. However, looking at the observed range of natural variants, and their uncertainties, one could make a case that the AGW component, which has only possibly shown itself between 1980 - 98, is not a required part of the dataset. Indeed, if one did not have in the back of one’s mind the rising CO2 concentration and the physics of the greenhouse effect, one could make out a good case for reproducing the post 1980 temperature dataset with no AGW!
Natural variations dominate any supposed AGW component over timescales of 3 - 4 decades. If that is so then how should be regard 18 years of warming and decades of standstills or cooling in an AGW context? At what point do we question the hypothesis of CO2 induced warming?
Lean and Rind (2009) look at the various factors known to cause variability in the earth’s temperature over decadal timescales. They come to the conclusion that between 2009-14 global temperatures will rise quickly by 0.15 deg C - faster than the 0.1 deg C per decade deduced as AGW by the IPCC. Then, in the period 2014-19, there will be only a 0.03 deg C increase. They believe this will be chiefly because of the effect of solar irradiance changes over the solar cycle. Lean and Rind see the 2014-19 period as being similar to the 2002-8 temperature standstill which they say has been caused by a decline in solar irradiance counteracting AGW.
This should case some of the more strident commentators to reflect. Many papers have been published dismissing the sun as a significant factor in AGW. The gist of them is that solar effects dominated up to 1950, but recently it has been swamped by AGW. Now however, we see that the previously dismissed tiny solar effect is able to hold AGW in check for well over a decade - in fact forcing a temperature standstill of duration comparable to the recent warming spell.
At least the predictions from the various papers are testable. Lean and Rind (2009) predict rapid warming. Looking at the other forecasts for near-future temperature changes we have Smith et al (2007) predicting warming, and Keenlyside et al (2008) predicting cooling.
At this point I am reminded that James Hansen ‘raised the alarm’ about global warming in 1988 when he had less than a decade of noisy global warming data on which to base his concern. The amount of warming he observed between 1980 and 1988 was far smaller than known natural variations and far larger than the IPCC would go on to say was due to AGW during that period. So whatever the eventual outcome of the AGW debate, logically Hansen had no scientific case.
There are considerable uncertainties in our understanding of natural factors that affect the earth’s temperature record. Given the IPCC’s estimate of the strength of the postulated AGW warming, it is clear that those uncertainties are larger than the AGW effect that may have been observed. Read more here.
By Fred Pearce, New Scientist
Forecasts of climate change are about to go seriously out of kilter. One of the world’s top climate modellers said Thursday we could be about to enter “one or even two decades during which temperatures cool. “People will say this is global warming disappearing,” he told more than 1500 of the world’s top climate scientists gathering in Geneva at the UN’s World Climate Conference.
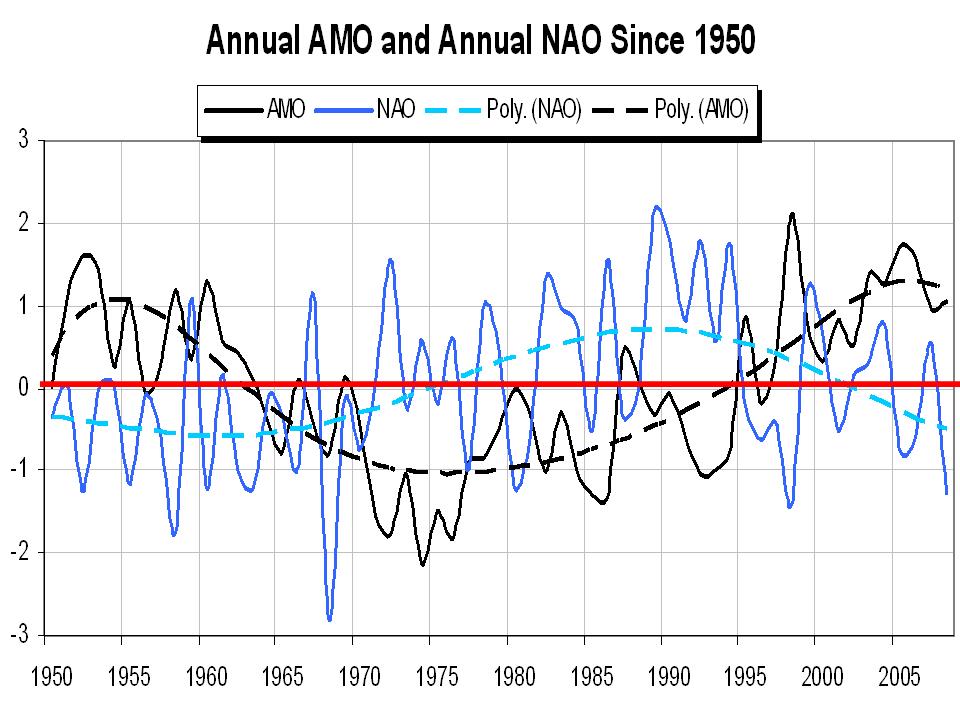
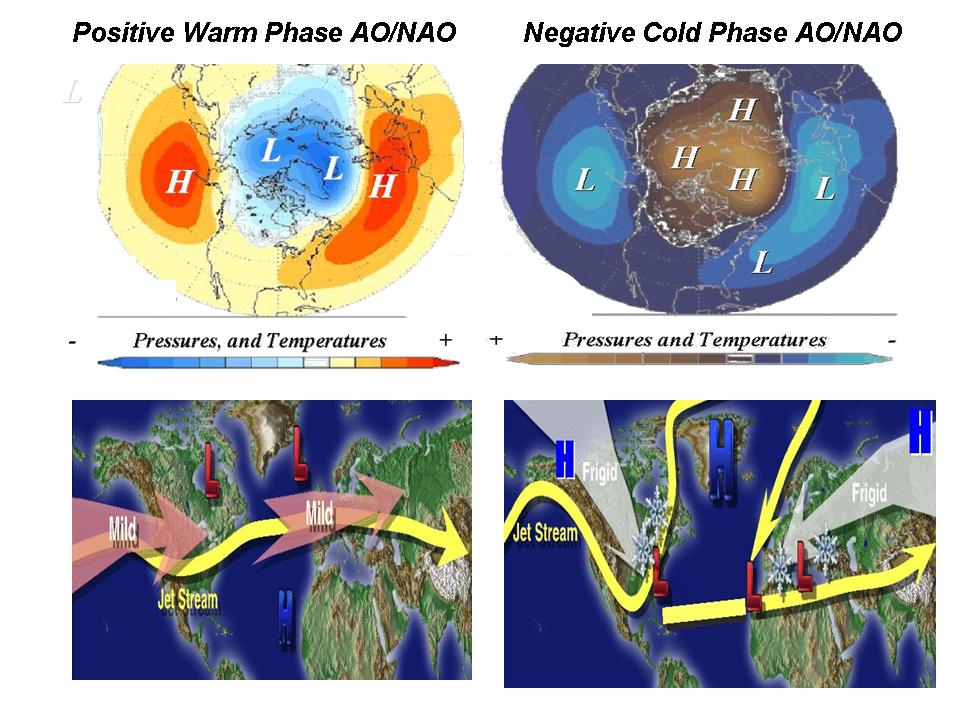
Latif predicted that in the next few years a natural cooling trend would dominate over warming caused by humans. The cooling would be down to cyclical changes to ocean currents and temperatures in the North Atlantic, a feature known as the North Atlantic Oscillation (NAO). Breaking with climate-change orthodoxy, he said NAO cycles were probably responsible for some of the strong global warming seen in the past three decades. “But how much? The jury is still out,” he told the conference. The NAO is now moving into a colder phase. Latif said NAO cycles also explained the recent recovery of the Sahel region of Africa from the droughts of the 1970s and 1980s. James Murphy, head of climate prediction at the Met Office, agreed and linked the NAO to Indian monsoons, Atlantic hurricanes and sea ice in the Arctic. “The oceans are key to decadal natural variability,” he said.
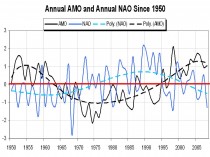
The NAO is imversely related to the AMO and lags the AMO state as shown above. Enlarged here
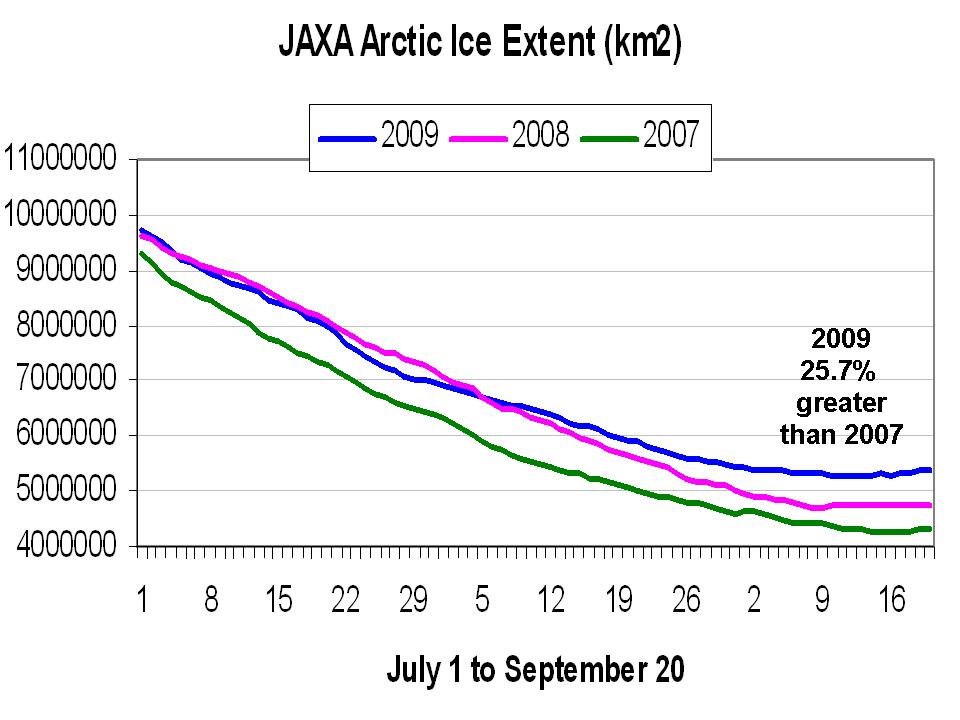
Another favourite climate nostrum was upturned when Pope warned that the dramatic Arctic ice loss in recent summers was partly a product of natural cycles rather than global warming. Preliminary reports suggest there has been much less melting this year than in 2007 or 2008.
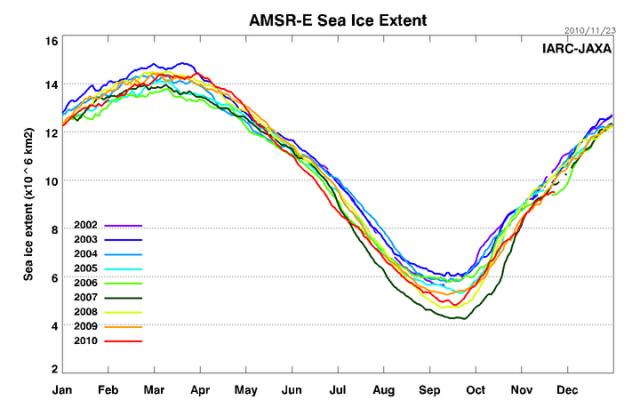
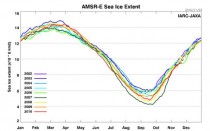
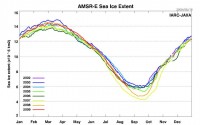
Here is the latest daily JAXA IJIS based plots for July through September 9 for 2007, 2008, 2009 for arctic ice extent. Note as the melt season draws near an end, we are running 20/8% above the record low levels of 2007, continuing the rebound started in 2008.
In candid mood, climate scientists avoided blaming nature for their faltering predictions, however. “Model biases are also still a serious problem. We have a long way to go to get them right. They are hurting our forecasts,” said Tim Stockdale of the European Centre for Medium-Range Weather Forecasts in Reading, UK.
See full story here.
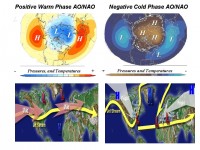
The positive NAO relates to more zonal flow with warmer Atlantic air into Europe and Pacific air into North America. The negative NAO leads to a more meridional pattern with cold air in Siberia often making its way west to western Europe and Cold arctic air over North America trapped over the eastern and central parts of the continent. Enlarged here
Note: MIT’s Dr. Lindzen commented “Lateef is actually one of the better ocean modelers. However, he used to be all over the German media proclaiming that models were perfect, and should be used to determine policy. When someone responded that since the models were perfect, there was no need for more funding, Lateef developed a deeper appreciation for the model shortcomings. I suppose that there is a lesson here someplace.”
UPDATE: This has led science reporter Eric Berger of the Houston Chronicle to discuss Climate scientists should talk about what “may” happen, rather than what “will” happen
I’m the science reporter for the Houston Chronicle, the daily newspaper in the petrochemical capital of the United States, if not the world. I’ve been called a global warming skeptic by environmentalists, and I’ve been called an environmentalist toady by the skeptics.
I’m neither of these things. Rather, I’m just trying to grasp what is happening to the planet’s climate, and how humans are impacting it.
For a long time now, science reporters have been confidently told the science is settled. That the planet is warming and humans are unquestionably the primary cause. We’ve been told to trust the computer models—the models which show a markedly upward trend in temperatures as carbon dioxide concentrations increase. And I’ve trusted the scientists telling me this.
Below you’ll find the computer model forecasts for the 21st century temperatures from the most recent IPCC summary for policymakers, which call for a 1.8C to 3.8C rise in global temperatures by 2100:
It seems pretty clear that the models forecast a steady upward trend in global temperatures as long as carbon dioxide levels rise. (Which they have). Yet according to satellite and surface temperature measurements the global average temperature has essentially remained flat for the last 12 years. This strikes me as somewhat curious.
When An Inconvenient Truth came out I believed the movie to be scientifically accurate. Carbon dioxide levels were rising and so were temperatures. And hurricane activity, especially after the disastrous 2005 season, was out of control.
But a funny thing happened on the way to the end of the world: hurricane activity on the global scale is near historical lows. And the Earth seems to have, at least temporarily, stopped warming.
This, despite the fact that some of the country’s leading climate scientists say there is unequivocally a link between major hurricanes and climate change. And despite the fact that other leading climate scientists predicted 2009 or 2010 will go down as the warmest year in recorded history. Either prediction, if true, would be alarming.
Yet both of these predictions seem, at the present moment, to be off.
Then there’s this: a revealing story from an international meeting of climate scientists where a German climate scientist says the world may cool for the next decade or two. New Scientist reports:
One of the world’s top climate modelers said Thursday we could be about to enter “one or even two decades during which temperatures cool. “People will say this is global warming disappearing,” he told more than 1500 of the world’s top climate scientists gathering in Geneva at the UN’s World Climate Conference.
“I am not one of the skeptics,” insisted Mojib Latif of the Leibniz Institute of Marine Sciences at Kiel University, Germany. “However, we have to ask the nasty questions ourselves or other people will do it.” Few climate scientists go as far as Latif, an author for the Intergovernmental Panel on Climate Change. But more and more agree that the short-term prognosis for climate change is much less certain than once thought. If we can’t have confidence in the short-term prognosis for climate change, how can we have full confidence in the long-term prognosis?
The article is significant for a couple of reasons. First of all it’s written by Fred Pearce, who has a history of forceful journalism outlining climate change’s perils, and it’s published by New Scientist, which has long advocated vigorous action to curb climate change. I respect both the author and the publication.
Secondly, the key point here is that scientists are acknowledging that natural variations are playing a very important role in our present and future climate, perhaps cooling it. Therefore it stands to reason that natural variations might also have played a role in the temperature run-up of the 20th century. Do not misunderstand me. I am not a climate change skeptic. I do not deny that the planet warmed 0.6C in the 20th century. I do not deny that humans played some part in that significant warming.
But I am confused. Four years ago this all seemed like a fait accompli. Humans were unquestionably warming the climate and changing the planet forever through their emissions of carbon dioxide. The problem is that some climate scientists and environmentalists have been so determined to see something done about carbon dioxide emissions—now—that they have glossed over the uncertainties.
Uncertainties like: maybe there isn’t a linear relationship between carbon dioxide and temperature, and maybe the planet will cool for a couple of decades even as carbon dioxide emissions accelerate. For the last few years some scientists and environmentalists have been telling us a lot about what “will” happen in the future if carbon dioxide emissions continue unabated. It perhaps would have been a lot better if they talked about what “may” happen.
Read more here.
This has led Marc Morano of Climate Depot to comment “I have been researching and reporting on man-made global warming science over the past decade. The past few weeks have—without a doubt—seen the most dramatic acceleration of developments against the claims of a so-called ‘consensus.’ The Houston Chronicle science reporter Eric Berger’s latest admission merely reflects an inescapable reality: Man-made global warming fears are quickly descending into the ash heap of history. Even top UN IPCC scientists are now openly questioning these claims.”
By Anthony Watts, Watts Up With That
There’s a lot of buzz about regarding the Kaufman et al paper published today in Science which claims a recent reversal on a long term Arctic cooling trend and “found that the cooling trend reversed in the mid-1990s.” In the NOAA internal newsletter I cited yesterday, NOAA claims that the “According to the most recent Arctic Report Card, the Arctic Ocean continues to warm”. OK fair enough, we’ll have a look.
NOAA based this on Hadley’s CRU dataset, which of course Hadley refuses to show any raw data for or methodology despite repeated FOI requests, making verification impossible. (Read more here)
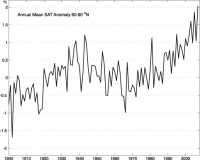
Arctic-wide annual averaged surface air temperature anomalies (60-90N) based on land stations north of 60N relative to the 1961-90 mean. From the CRUTEM 3v dataset, (available online here). Note this curve does not include ship observations.
Note the trend from 1980 to present. Note also that there are few weather stations above 60N and even fewer on the Arctic Ice itself. The data is relatively sparse and interpolation/gridding/averaging is employed to come up with the coverage all the way to 90N. We’ll get back to this.
From the abstract:
The temperature history of the first millennium C.E. is sparsely documented, especially in the Arctic. We present a synthesis of decadally resolved proxy temperature records from poleward of 60N covering the past 2000 years, which indicates that a pervasive cooling in progress 2000 years ago continued through the Middle Ages and into the Little Ice Age. A 2000-year transient climate simulation with the Community Climate System Model shows the same temperature sensitivity to changes in insolation as does our proxy reconstruction, supporting the inference that this long-term trend was caused by the steady orbitally driven reduction in summer insolation. The cooling trend was reversed during the 20th century, with four of the five warmest decades of our 2000-year-long reconstruction occurring between 1950 and 2000.
Here’s the press release from EurekAlert. The research team reconstructed past temperatures on a decade-by-decade basis during the past 2,000 years using information gleaned from ancient lake sediments, ice cores, tree rings and other samples. As part of the study, the decade-by-decade climate data reconstruction was compared with sophisticated climate model simulations run by NCAR researchers.
My first thought is that the recent claims seem to be similar to what we saw happen with the flawed Steig et al Antarctic paper. We have a few weather stations, sparse coverage, some Mannomatic style math, and some bold claims from the results.
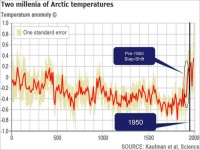
WUWT commenter Dave Middleton pointed out one problem with this comment: The BBC did a better job of reporting the story and included a graph from the paper. This paper supposedly ties all of the 20th century Arctic warming to greenhouse gas emissions. There’s one tiny problem with the paper’s claim.
All of the anomalous warming occurred in one “step shift” before 1950; while most of the increase in atmospheric CO2 has occurred since 1950. And here is that graph Dave annotated:
OK that’s one problem. Here’s another. Both Kaufman et al and NOAA claim recent Arctic warming. In the case of the Kaufman paper, they specifically claim they “found that the cooling trend reversed in the mid-1990s.”
Since we can’t really look at the Hadley CRU data since it is held under lock and key despite the repeated FOI requests so that analysis and verification can be performed, we can’t really analyze it pertaining to NOAA’s claim of warming. Since NOAA and HadleyCRU use many of the same stations above 60N (they’d have to since there are so few) it seems reasonable to assume they share similar data in the Kaufman et al paper.
Fortunately there is another Arctic temperature data source available we can look at to compare against. And that is from the Danish Meteorological Institute (DMI). Like NOAA, they offer a dataset that shows temperature in the high latitudes. Here is what they say about that dataset and how it is obtained.
The daily mean temperature of the Arctic area north of the 80th northern parallel is estimated from the average of the 00z and 12z analysis for all model grid points inside that area. The ERA40 reanalysis data set from ECMWF, has been applied to calculate daily mean temperatures for the period from 1958 to 2002, from 2002 to 2006 data from the global NWP model T511 is used and from 2006 to present the T799 model data are used.
The ERA40 reanalysis data, has been applied to calculation of daily climate values that are plotted along with the daily analysis values in all plots. The data used to determine climate values is the full ERA40 data set, from 1958 to 2002.
Here is the most recent DMI graph of Arctic temperature:

Note that the blue line represents the “melting point” of ice in Kelvin or 0C/32F The green line represents the average climate from 1958 to 2002, i.e. the “baseline”
I don’t have time to get into a detailed analysis of the raw DMI data this morning as I have other duties, but I do have time to do a visual check that is just as telling.
Kaufman et al claims they “found that the cooling trend reversed in the mid-1990s.” That should easy to spot in the DMI graphs if it exists. So I animated the entire set of DMI graphs from 1958 to 2009. See if you can spot the temperature spikes or the “cooling trend reversed in the mid-1990s.” signature.
Click here for full sized animation
Watch the top of the bell curve above the blue line. See any big changes? I don’t. Note that in the animation above, due to a slight change in DMI’s graphical presentation for 2008 and 2009, I had to graphically fit 2008 and 2009 to match the rest of the animation framework so that there would not be a distracting jump at the end. The data is unchanged in doing this.
One of the most common claims of alarmists is that the Arctic is “melting” and that implies a temperature cause in their statements. But as we see, during the critical melt window, the DMI data seems to hold right along the climatic normal.
One thing about DMI, if you go to their main web page, you don’t find any alarming pronouncements about Arctic melting or temperature reversal like you do at NOAA. Others like NASA say the wind pattern changes is more of an issue, blowing the sea ice southward. Perhaps NOAA and Kaufman should look more closely at before making grand claims.
Read full post here.
Icecap Note: See also this plot of arctic temperatures by Willie Soon from Polyakov of U of Alaska vs the Total Solar Irradiance and CO2. Note the temperatures peaked here about 1940. I agree with Dr. Singer’s response to the story, “I trust Willie Soon’s data more” than the hockey stick crew who have perfected the ability to cherry pick sources of observation and proxy data. See climate audit for examples how this happened again with Kaufman and the media and Science is letting them get away with it.
NOAA’s GHCN data shows a similar graph for the arctic that Polyakov showed, with recent temperatures no higher than the levels around 1940.
Also finally here is the latest daily JAXA IJIS based plots for July through September 9 for 2007, 2008, 2009 for arctic ice extent. Note as the melt season draws near an end, we are running 20.8% above the record low levels of 2007, continuing the rebound started in 2008.
See how scientists predictions have made out to date here. Bloggers had a much better record.
By Joseph D’Aleo
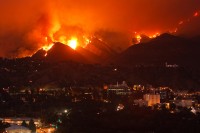
UPDATE: THE AGE OF MEGAFIRES - 60 Minutes September 6, 2009: Global warming is increasing the intensity and number of forest fires across the American West. Resident CBS alarmist Scott Pelley goes to the fire line to report. Watch a preview here.
While environmentalists and clueless politicans like CA Representative Linda Sanchez and not surprisingly the opportunist George Soros disciple Joe Romm sought to place the blame for the California wildfires on ‘global warming’. the massive California wildfires can be attributed to a cooling Pacific, two years of La Nina and environmental mismanagement.
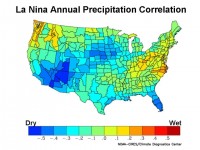
La Ninas and/or a cold PDO Usually Means Drier California
You can see clearly from the following correlation chart of La Ninas (using the Southern Oscillation Index) with precipitation from CDC, that La Ninas favor dryness in the southwest.
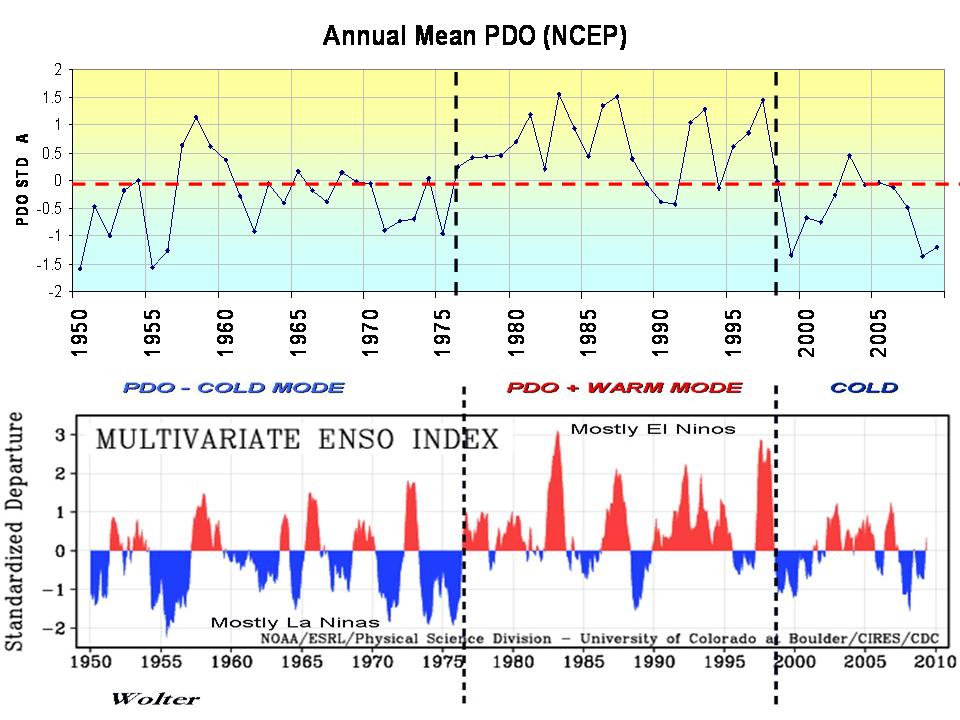
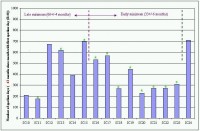
The basin wide Pacific multidecadal warming and cooling affects the frequency and strength of La Ninas and El Ninos. The cold PDO favoring more, stronger and longer lasting La Ninas and the warm PDO more, stronger and longer lasting El Ninos and fewer briefer, mostly weak La Ninas. The PDO turned cold in 1998 bounced some until 2006 when it began a significant decline. See the blue La Nina frequency increasing like it did when the PDO was last cold from 1947 to 1977.

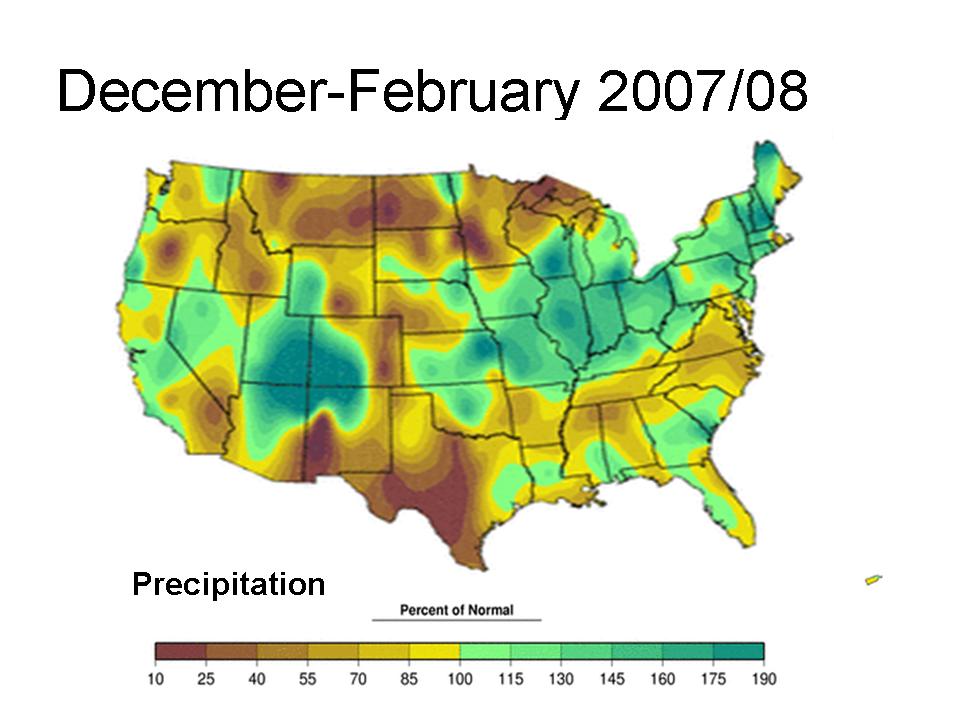
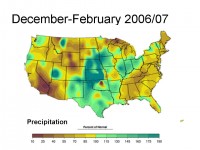
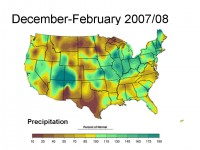
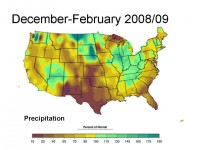
The rapid cooling in the Pacific in 2006 caused the El Nino winter of 2006/07 rains to fail in California. The La Nina that ensued became strong in the late winter and early spring of 2007/08 and came back again for a reprise in 2008/09 winter continued to produce sub normal rainfall.
A few years back McCabe, Palecki and Betancourt published a paper that looked at drought frequency across the United States related to both the Pacific Decadal Oscillation and the Atlantic Mulitdecadal Oscillation. Droughts in the United States were more frequent when the Atlantic was in its warm mode. When the Atlantic was warm, and the Pacific was also in its warm mode, the dryness was more across the northwest and southeast and when the Pacific was cold more across the southwest. Red areas have enhanced drought probabilities.
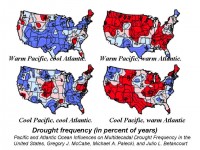
We are currently still have a warm Atlantic mode and cold Pacific mode (D) and thus should expect the increased risk of dryness in the southwest. See these maps and read more here.
Environmental Mismanagement
This natural cyclical lack of rainfall combined with unwise policy that Dr. Scott Campbell reported concerning the prohibition against clearing up accumulated brush from the areas surrounding housing developments that were instituted at the insistence of the Sierra Club and other environmental groups has left more fuel for the fires fanned by the Santa Ana winds. The JPL’s Dr Patzert indicated, in a release, were also more common in La Ninas. The risk is also greater because more people built homes in the cooler hills among the trees, putting more than trees at risk.
In addition, environmentalists have reduced the amount of water that can be used for agriculture. Farmers in the Central Valley are asking for a new canal to get water from the Sacramento River, as well as a relaxation of environmental restrictions resulting from a 2007 court ruling limiting the amount of water pumped south from the delta - a giant sponge that absorbs runoff from the wetter north. The ruling was in response to a suit by environmental groups that held that the water pumping through the delta endangered several species of fish, including smelt, green sturgeon, and winter and spring salmon. More here.
What Lies Ahead
Given the current El Nino is in the cold PDO mode, it should be weak and tend to be brief. It may peak this fall and weaken this winter. The increased tropical activity in the eastern Pacific is favored in El Nino years (in some El Ninos they reach California in the early fall in a weakened state - e.g. Kathleen in 1976). The similar El Ninos in the cold PDO tended to produce normal to below normal wet season precipitation.
It is likely a La Nina will return next year. Expect another active fire season. See more here.
By Joseph D’Aleo
Update: a very small sunspot group of two specks formed on the sun in the final hours of the month Monday according to NOAA SWPC, their monthly sunspot number will be positive (though very small - likely 0.2 or 0.3, the lowest of this solar minimum but not a zero month). SIDC in Belgium, the official source said 28 observatories did not see a countable spot and had a preliminary 0 number for the month (here).
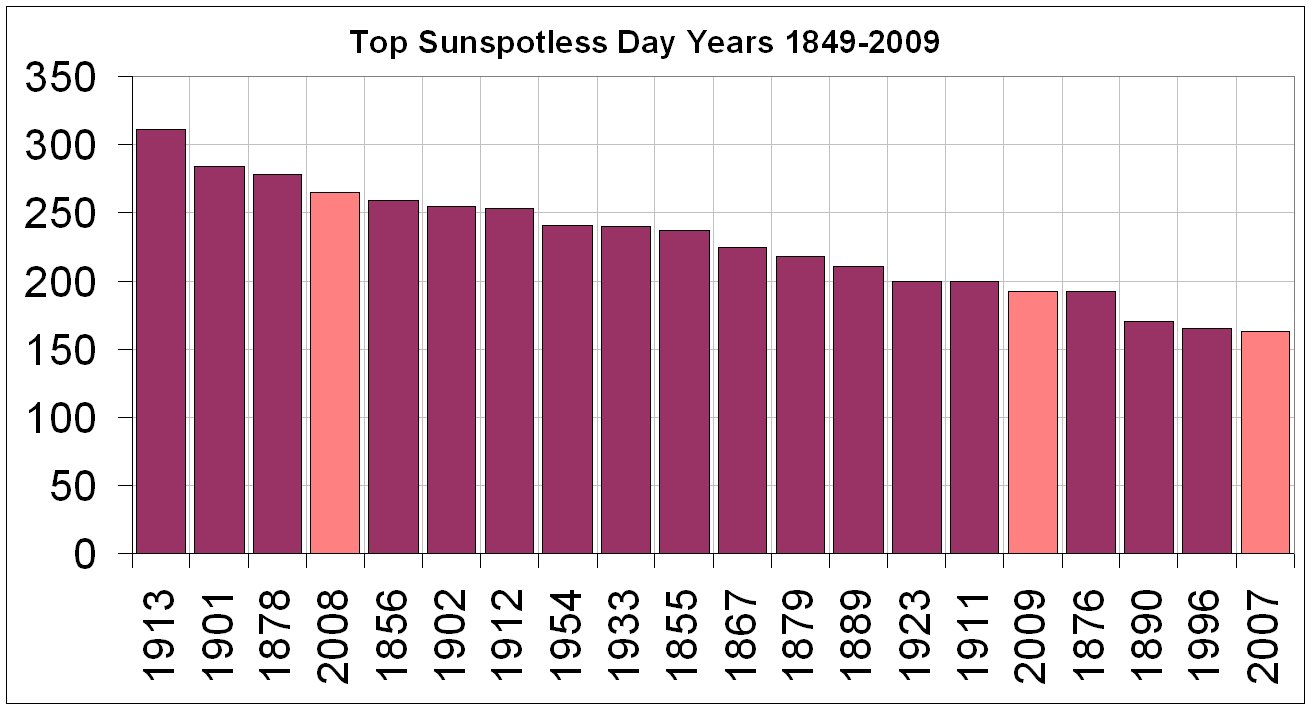
Sunday, August 30th marked the 51st straight day without a sunspot, one of the longest stretches in a century. One more day and we would have had a spotless month but like last August some observatories saw a spot on the sun for a few hours one day. It would have been either the first or second spotless month since 1913 depending on whether you count last August as spotless. It is unclear whether such small specks would have been seen in 1913.
In fact it rises into 4th place among all spotless periods since 1849 (first table here). Note: It is 5th place if you accept a spotless August 2008 which would have led to a stretch of 52 days. The total number of spotless days this transition from cycle 23 to 24 is now 704, exceeding the number for cycle 15 in the early 1900s (below, enlarged here).
We have had 193 spotless days this year (79% of the days). We are in the top 20 years in 16th place. We will very likely rapidly rise up the list in upcoming weeks and rival 2008’s 266 days and likely end in the top 5 years. 2007, 2008, 2009 will only have 1911, 1912, 1913 in the top 20 as string of 3 per transition (below, enlarged here).
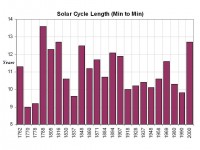
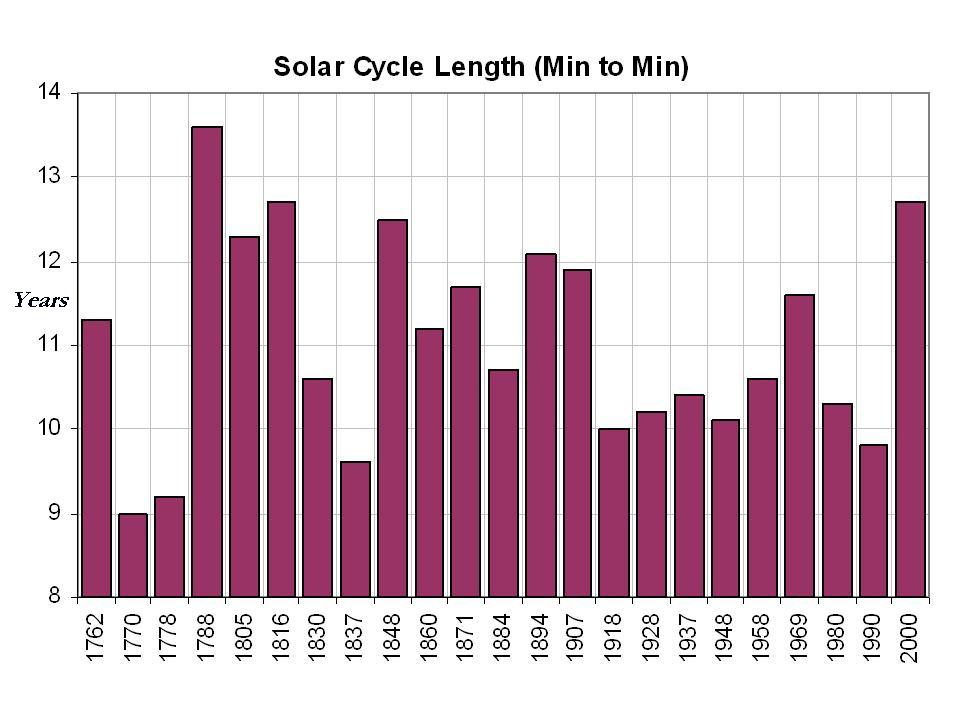
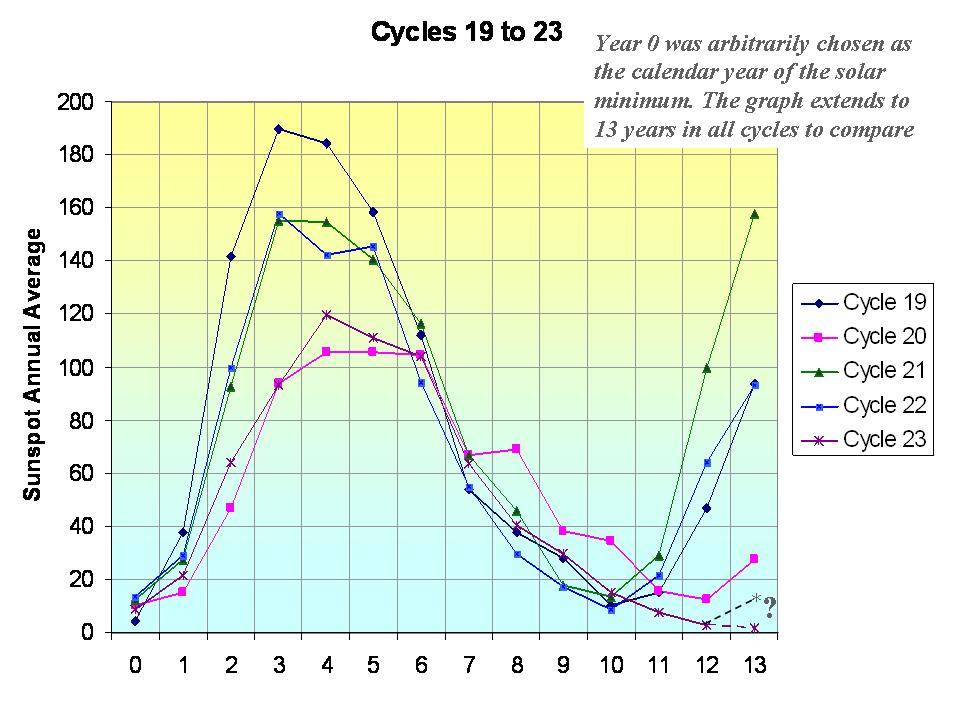
The cycle minimum probably was December, 2008. January 2009’s 13 month average came up a bit due to slight bump in activity in June and July but if August should end up sunspotless and September low, we could have a double bottom. Still, the 12.7 years assuming December 2008 was longest in two centuries (below, enlarged here). Only cycles 4 (peaking in 1788) and 6 (peaking in 1816) were longer than cycle 23 (which peaked in 2000).
You can see on this chart, by 13 years after the solar minimum year, most of the last 5 cycles already had recovered, in one case already to the solar max of the subseuent cycle (below, enlarged here).
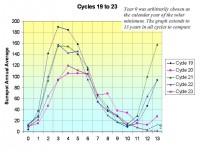
This cycle has continued to decline in the solar irradiance, solar flux, sunspot number and geomagnetic activity after 10 years. On the following chart produced by Anthony Watts, you can see the Total Solar Irradiance declining whereas the prior cycle was rebounding (below, enlarged here).
Also see the daily TSI which goes through short term cycles at the lowest point of the last few months as of the last plotted measurement.
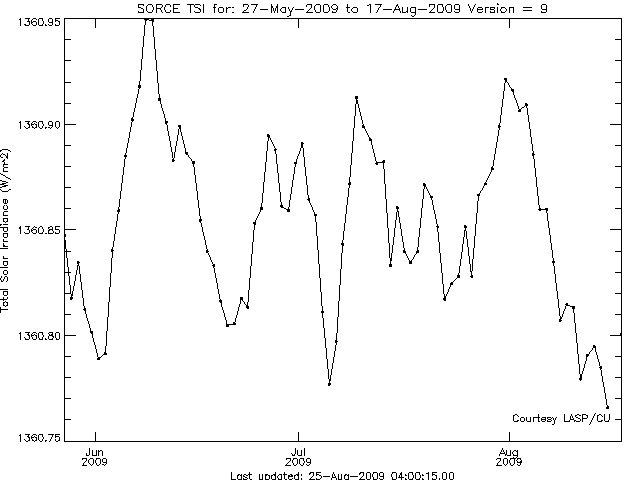
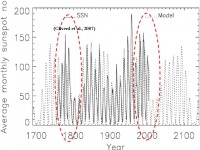
Clilverd et al 2006 suggests using a statistical analysis of the various cycles (11, 22, 53, 88, 105, 213, and 426 years) shows the next two cycles will likely be very quiet much like those of 200 years ago in the early 1800s, the so called Dalton Minimum, the time of Dickens (with snows and cold in London like last winter) (below, enlarged here).
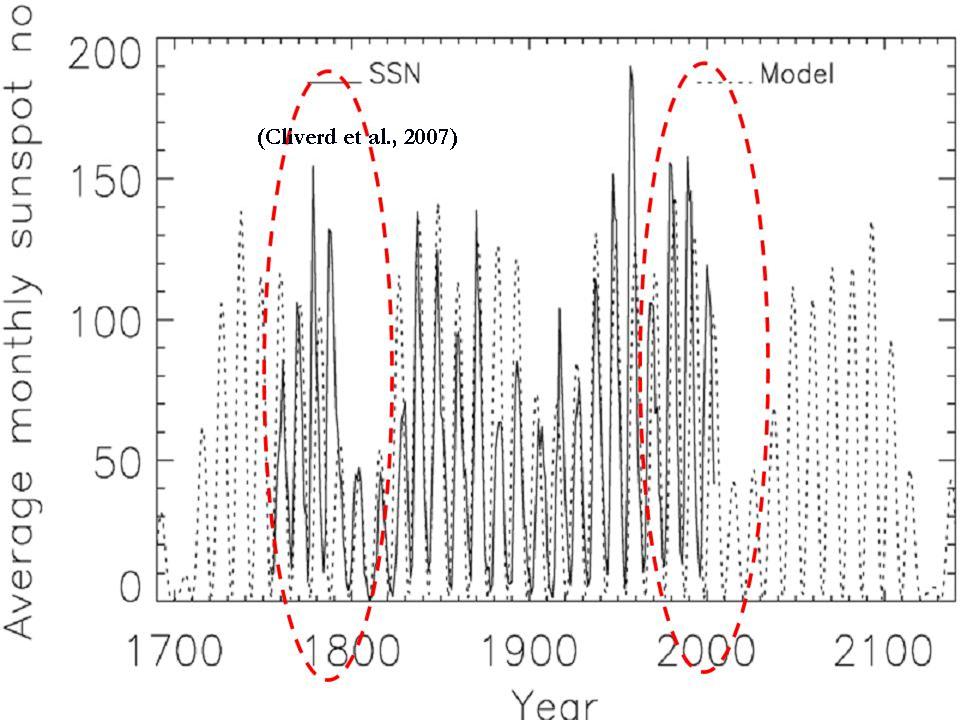
See what David Archibald shows what the result might be if Clilverd is correct here. Some have not ruled out an even stronger Maunder like Minimum.
Read more in this pdf here.
There is an important new paper in Science (H/T Steve Milloy) that confirms what we have been saying for years. It is Meehl, G.A., J.M. Arblaster, K. Matthes, F. Sassi, and H. van Loon (2009), Amplifying the Pacific climate system response to a small 11 year solar cycle forcing, Science, 325, 1114-1118. It blows away the IPCC and CCSP arguments that the sun is a bit player in climate compared to CO2.
Our sun does not radiate evenly. The best known example of radiation fluctuations is the famous 11-year cycle of sun spots. Nobody denies its influence on the natural climate variability, but climate models have, to-date, not been able to satisfactorily reconstruct its impact on climate activity.
Researchers from the USA and from Germany have now, for the first time, successfully simulated, in detail, the complex interaction between solar radiation, atmosphere, and the ocean. As the scientific journal Science reports in its latest issue, Gerald Meehl of the US-National Center for Atmospheric Research (NCAR) and his team have been able to calculate how the extremely small variations in radiation brings about a comparatively significant change in the System “Atmosphere-Ocean”.
Katja Matthes of the GFZ German Research Centre for Geosciences, and co-author of the study, states: “Taking into consideration the complete radiation spectrum of the sun, the radiation intensity within one sun spot cycle varies by just 0.1 per cent. Complex interplay mechanisms in the stratosphere and the troposphere, however, create measurable changes in the water temperature of the Pacific and in precipitation”.
Top Down - Bottom up
In order for such reinforcement to take place many small wheels have to interdigitate. The initial process runs from the top downwards: increased solar radiation leads to more ozone and higher temperatures in the stratosphere. “The ultraviolet radiation share varies much more strongly than the other shares in the spectrum, i.e. by five to eight per cent, and that forms more ozone” explains Katja Matthes. As a result, especially the tropical stratosphere becomes warmer, which in turn leads to changed atmospheric circulation. Thus, the interrelated typical precipitation patterns in the tropics are also displaced.
The second process takes place in the opposite way: the higher solar activity leads to more evaporation in the cloud free areas. With the trade winds the increased amounts of moisture are transported to the equator, where they lead to stronger precipitation, lower water temperatures in the East Pacific and reduced cloud formation, which in turn allows for increased evaporation. Katja Matthes: “It is this positive back coupling that strengthens the process”. With this it is possible to explain the respective measurements and observations on the Earth’s surface.
Professor Reinhard Huettl, Chairman of the Scientific Executive Board of the GFZ (Helmholtz Association of German Research Centres) adds: “The study is important for comprehending the natural climatic variability, which - on different time scales - is significantly influenced by the sun. In order to better understand the anthropogenically induced climate change and to make more reliable future climate scenarios, it is very important to understand the underlying natural climatic variability. This investigation shows again that we still have substantial research needs to understand the climate system”. Together with the Alfred Wegener-Institute for Polar and Marine Research and the Senckenberg Research Institute and Natural History Museum the GFZ is, therefore, organising a conference “Climate in the System Earth” scheduled for 2./3. November 2009 in Berlin.
Read more here. See further coverage and interpretation on space.com here.
See SEPP Editorial on this paper and the solar influence here.
Read Willie Soon’s superb Physical Geography paper “Solar Arctic-Mediated Climate Variation on Multidecadal to Centennial Timescales: Empirical Evidence, Mechanistic Explanation and Testable Consequences” here.
Read Icecap story that has shown the importance of these magnifiers like UV here.
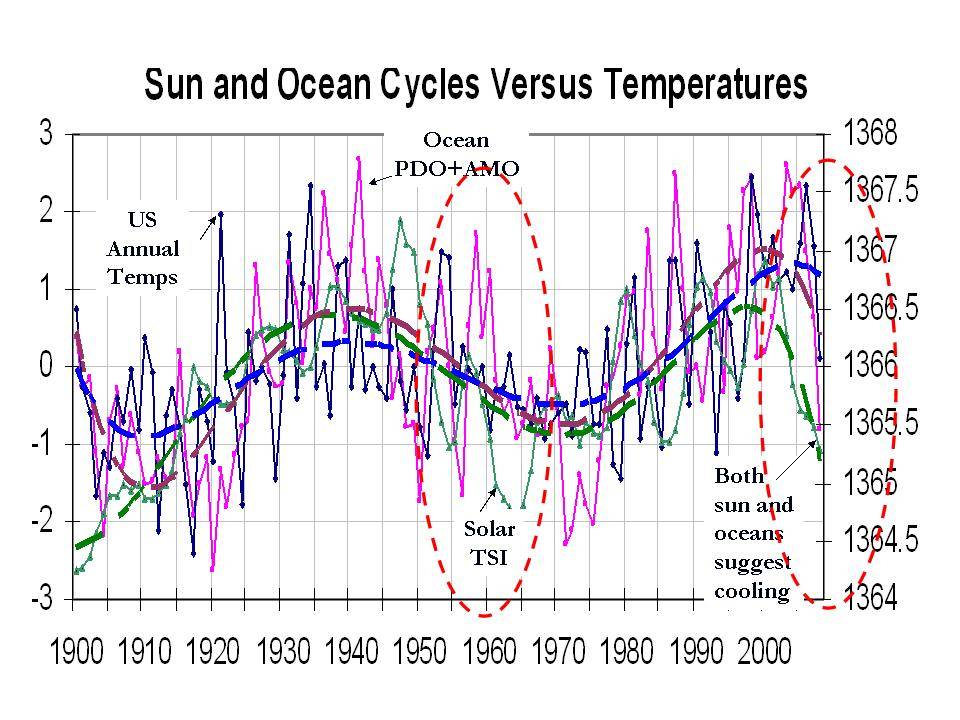
Comparison of Total Solar Irradiance (Hoyt/Willson) vs ocean tri-poles (PDO+AMO) vs HSHCN annual temperatures. Larger image here.
UPDATE: August 27th, 2009 by Roy W. Spencer, Ph. D.
After crunching data this week from two of our satellite-based microwave sensors, and from NOAA’s official sea surface temperature (SST) product ERSST v3b, I think the evidence is pretty clear:
The ERSST v3b product has a spurious warming since 1998 of about 0.2 deg. C, most of which occurred as a jump in 2001.
The following three panels tell the story. In the first panel I’ve plotted the TRMM Microwave Imager (TMI) SST anomalies (blue) for the latitude band 40N to 40S. I’ve also plotted SST anomalies from the more recently launched AMSR-E instrument (red), computed over the same latitude band, to show that they are nearly identical. (These SST retrievals do not have any time-dependent adjustments based upon buoy data). The orange curve is anomalies for the entire global (ice-free) oceans, which shows there is little difference with the more restricted latitude band.
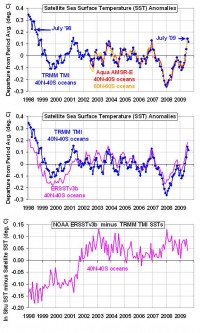
In the second panel above I’ve added the NOAA ERSST v3b SST anomalies (magenta), calculated over the same latitude band (40N to 40S) and time period as is available from TRMM.
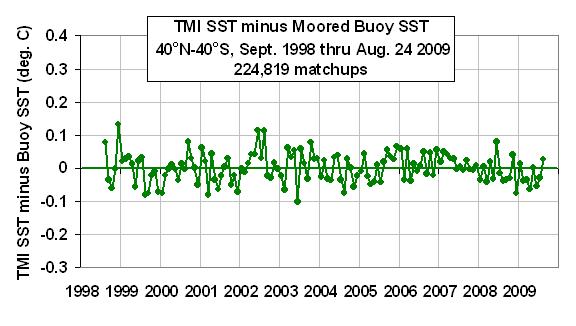
The third panel above shows the difference [ERSST minus TMI], which reveals an abrupt shift in 2001. The reason why I trust the microwave SST is shown in the following plot, where validation statistics are displayed for match-ups between satellite measurements and moored buoy SST measurements. The horizontal green line is a regression fit to the data. (An average seasonal cycle, and 0.15 deg. C cool skin bias have been removed from these data - neither affects the trend, however.)

I also checked the TMI wind speed retrievals, and there is no evidence of anything unusual happening during 2001. I have no idea how such a large warm bias could have entered into the ERSST dataset, but I’d say the evidence is pretty clear that one exists.
Finally, the 0.15 to 0.20 deg. C warm bias in the NOAA SST product makes it virtually certain that July 2009 was not, as NOAA reported, a record high for global sea surface temperatures. See full post and more here.
By Joseph D’Aleo
The only constant in nature is change. We have been able to reconstruct the past using proxy data like fossils, isotopes, polar and glacial ice. They tell us our climate has varied considerably over the last 450 thousand years. The long glaciations (typically 100,000 years) are tied to variations in the sun-earth orbital parameters. They are followed by periods of 10-15,000 years of warmer interglacials.
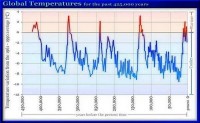
During the interglacials, global temperatures rise 18F but vary perhaps 2 degrees in millenium length ups and downs. Every great civiilization in history has reached its peak during the warm periods during the interglacials periods. Civilizations (Eqyptian, Minoan, Roman) thrived in the warm periods as crops could be grown more successfully in more places allowing for other societal advancement pursuits. They are tied to peaks in solar activity. They have been followed by cooling periods (and civilization declines) as solar activity declined (as it did in what we call the little ice age or Maunder Minimum) with crop failures, famines and migrations.
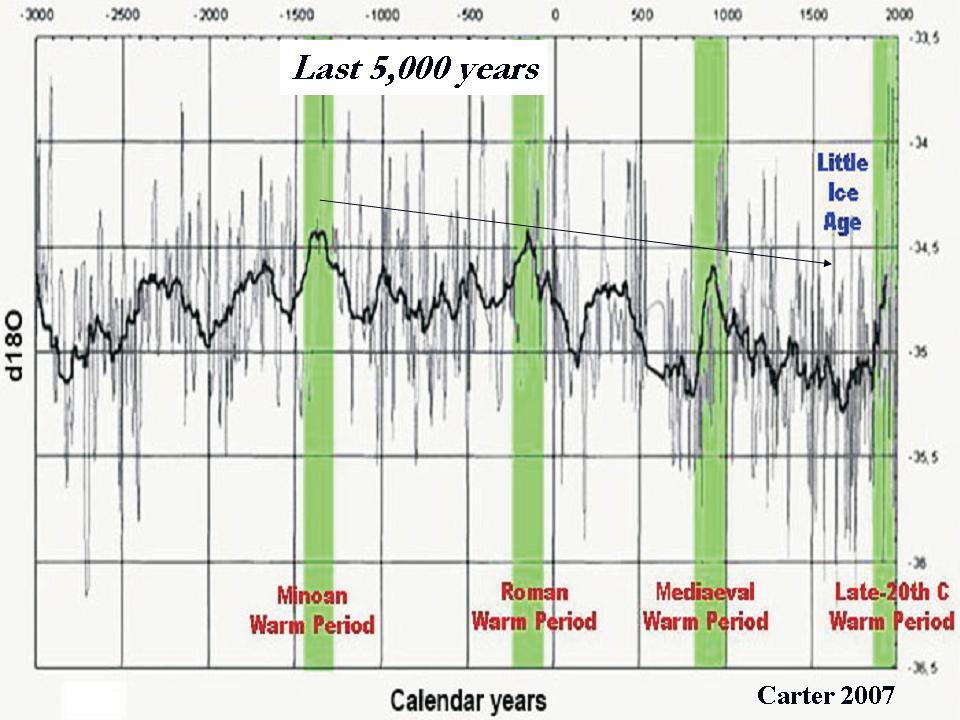

See these two articles that suggest we may have reached our latest climate nadir in the Grand Solar Maximum’s Climate Optimum of the late 20th Century. The sun continues to show signs of going into a slumber like it did 200 or 400 years ago. A civilization decline may have also started and this set of global leaders and the UN if we don’t stop them will only make it accelerate down. For a time, the more opportunistic countries like China and India may advance but climate might have final say there too. See these two relevant stories for more.
Lawrence Solomon: New Ice Age could be coming
Earth could soon be entering a new Ice Age, according to scientists at Oregon State University and other institutions, in a study to b e released this week by Science magazine.
“Sometime around now, scientists say, the Earth should be changing from a long interglacial period that has lasted the past 10,000 years and shifting back towards conditions that will ultimately lead to another ice age - unless some other forces stop or slow it,” states a release from Oregon State University.
The Science study refutes claims by some scientists that carbon dioxide was an important factor in ending the last ice Age. It concludes that wobbles in Earth’s rotation first led global ice levels “to reach their peak about 26,000 years ago, stabilize for 7,000 years and then begin melting 19,000 years ago, eventually bringing to an end the last ice age.
“The melting was first caused by more solar radiation, not changes in carbon dioxide levels or ocean temperatures, as some scientists have suggested in recent years.”
Death of a Civilization by David Deming
Over the past several years we have learned that small groups of people can engage in mass suicide. In 1978, 918 members of the Peoples’ Temple led by Jim Jones perished after drinking poisoned koolaid. In 1997, 39 members of the Heaven’s Gate cult died after drugging themselves and tieing plastic bags around their heads. Unfortunately, history also demonstrates that it is possible for an entire civilization to commit suicide by intentionally destroying the means of its subsistence.
In the early nineteenth century, the British colonized Southeast Africa. The native Xhosa resisted, but suffered repeated and humiliating defeats at the hands of British military forces. The Xhosa lost their independence and their native land became an English colony. The British adopted a policy of westernizing the Xhosa. They were to be converted to Christianity, and their native culture and religion was to be wiped out. Under the stress of being confronted by a superior and irresistible technology, the Xhosa developed feelings of inadequacy and inferiority. In this climate, a prophet appeared. Read the details of how this prophet led to the destruction of the Xhosa civilization in which over 50,000 people starved to death in this story.
Since the advent of the Industrial Revolution in the late eighteenth century, Europe and North America have enjoyed the greatest prosperity ever known on earth. Life expectancy has doubled. In a little more than two hundred years, every objective measure of human welfare has increased more than in all of previous human history.
But Western Civilization is coasting on an impetus provided by our ancestors. There is scarcely anyone alive in Europe or America today who believes in the superiority of Western society. Guilt and shame hang around our necks like millstones, dragging our emasculated culture to the verge of self-immolation. Whatever faults the British Empire-builders may have had, they were certain of themselves.
Our forefathers built a technological civilization based on energy provided by carbon-based fossil fuels. Without the inexpensive and reliable energy provided by coal, oil, and gas, our civilization would quickly collapse. The prophets of global warming now want us to do precisely that.
Like the prophet Mhlakaza, Al Gore promises that if we stop using carbon-based energy, new energy technologies will magically appear. The laws of physics and chemistry will be repealed by political will power. We will achieve prosperity by destroying the very means by which prosperity is created.
While Western Civilization sits confused, crippled with self-doubt and guilt, the Chinese are rapidly building an energy-intensive technological civilization. They have 2,000 coal-fired power plants, and are currently constructing new ones at the rate of one a week. In China, more people believe in free-market economics than in the US. Our Asian friends are about to be nominated by history as the new torchbearers of human progress.

By Joseph D’Aleo
UPDATED
In a Time/CNN story by Michael Grunwald “Steven Chu, A Political Scientist” on Chu’s mission to China, attempting to convince them to cooperate on emissions reductions in the December Copenhagen UN conference to discuss the next step after Kyoto (the Chinese are laughing all the way to the bank because they know our pain would be their gain).
Grunwald noted “When I asked Chu about the earth-is-cooling argument, he rolled his eyes and whipped out a chart showing that the 10 hottest years on record have all been in the past 12 years and that 1998 was the hottest. He mocked the skeptics who focus on that post-1998 blip while ignoring a century-long trend of rising temperatures: “See? It’s gone down! The earth must be cooling!” But then he got serious, almost plaintive: “You know, it’s totally irresponsible. You’re not supposed to make up the facts."”
I agree with the very last sentence. NOAA, NASA GISS and Hadley though are guilty of exactly that. They have created or enhanced man-made global warming by careless and possibly fraudulent methods. They started by dropping 80% of the world’s stations from their calculations, most rural, by not ensuring the instruments are not improperly sited (90% of the approximately 1000 surveyed and photographed by Anthony Watt’s team of volunteers do not meet the government’s own published standards), by not adjusting properly for the urbanization warming that has taken place as the world’s population rose for 1.6 to 6.7 billion people since 1900 (in the case of the US data, actually removing a very good urban adjustment), by employing and using instruments not really meant for precision temperature measurements or with warm biases, and most recently by eliminating ocean data sources like satellite or not using promising new sources like the Argo buoys because they are showing a cold ‘bias’ or cooling when the goal is to show warming in agreement with the models and their forecasts.
With the data they perform then an homogenization adjustment that blends the good with the bad (a little like the toxic assets in the mortgage crises). Though this may improve some of the bad data, it degrades the good data. This is a little like mixing pure spring water with sludge, the sludge is a little less disgusting, but the result is not potable.
Even the prior CCSP found that most of the warming is with the minimum temperatures in higher latitude cities and in winter, all classic characteristics of the urban heat island.
Dozens of peer review papers have been published and new ones appear monthly showing that the local factors like urbanization are responsible for an exaggeration of the warming longer term by 20 to 50% or even more.
LAST CENTURY OF “WARMING”
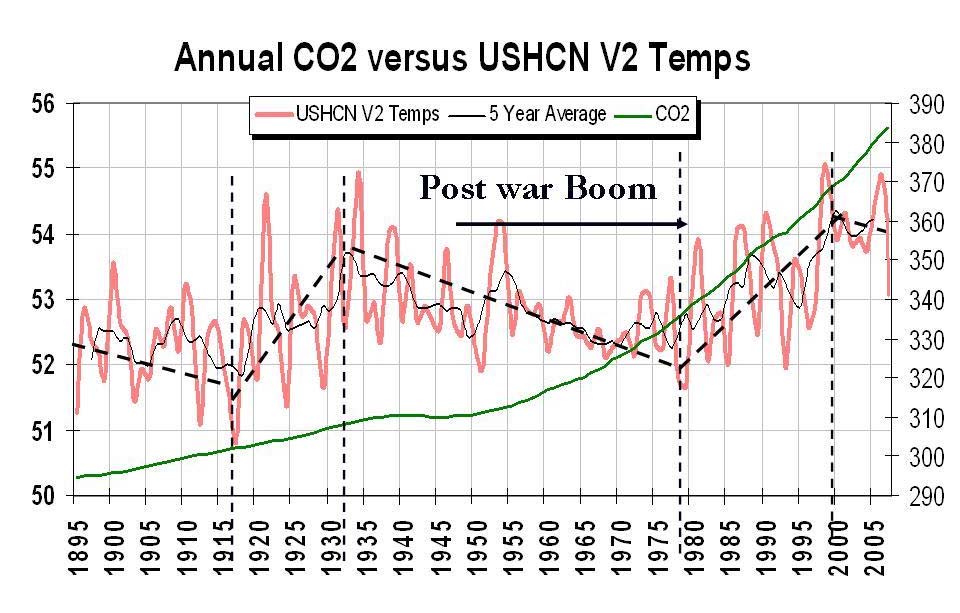
The last century of temperatures from the UK Hadley Center shows the upward trend used by the IPCC. I have added the 60 year cycle that is evident in the data set. We have just begun a leg down right about on schedule.
 .
.
Larger here.
We have posted other stories by Roger Pielke Jr. Anthony Watts, Timothy Ball, and Steve McIntyre recounted some of the adventures attempting unsuccessfully to date to get access to the raw data and adjustments from Hadley using official channels. We won’t get into that here.
With more stability of the United States with respect to the rural data, you sere a much smaller upward trend longer term and again warming confined to relatively short 20-30 year intervals even as CO2 rose. The rate of warming from the 1910s to 1930s was actually greater than that from 1979 to 1998.

Larger here.
When you correct for the issues discussed above, the recent decades fall down in comparison with the 1930s to 1950s when most of the heat records were set. You reduce the 10 of 10 to maybe 2 to 5 in ten warmest years. The data sets all show a 60 year cycle and one would expect years near the peaks would tend to rank among warmest and the minimums rank among the coldest.
1930S THE WARMEST DECADE?
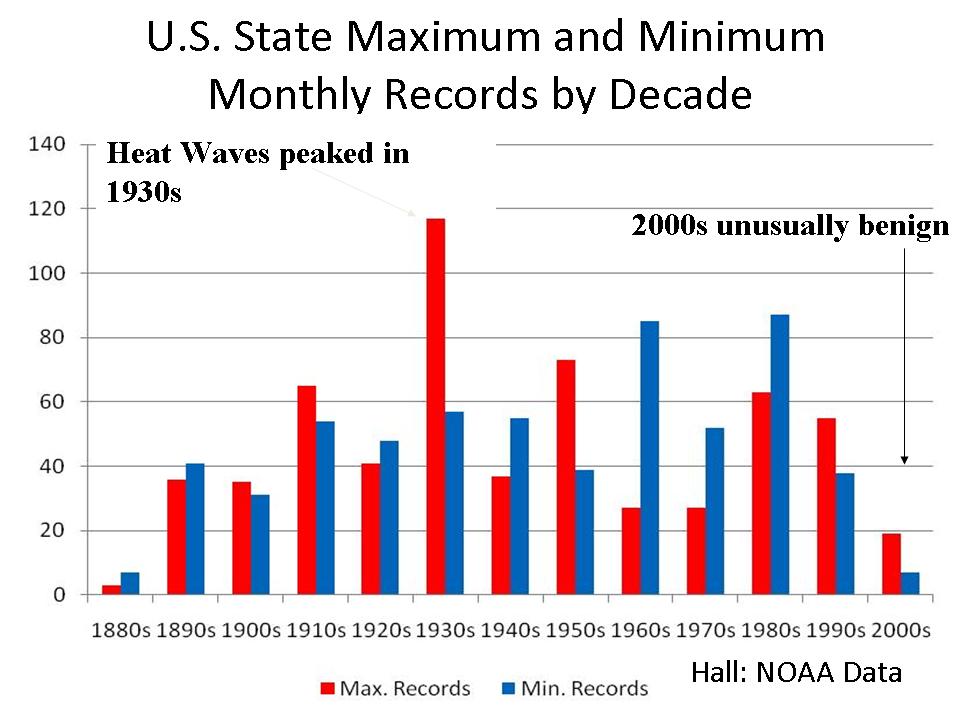
Looking at the record highs one gets the clear impression we are dealing with cyclical changes and that the warmth in the 1930s to 1950s exceeded that of the recent decades. This decades almost ended, has fewer heat records than any decade in a century.
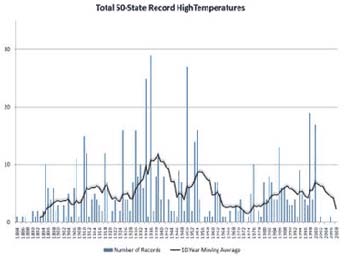
The all time state record highs show the dominance of the 1930s (24 of the 50 records). Larger here.
GLOBAL STATION DROPOUT
You can see the coverage difference between the stations on this GISS analysis of the NOAA gathered stations from 1978 versus that in 2008. You can see the stations grow then suddenly disappear in this animation from John W. Goetz here. See in this John Goetz post 1079 stations worldwide contributed to the GISS analysis, 134 of them being located in the 50 US states. Many, many hundreds of stations that have historically been included in the record and still collect data today continue to be ignored by NOAA and GISS in global temperature calculations (in 1970s the number of stations totaled well over 6000). Data is available in the large holes in places like Canada and Brazil and Africa, but NOAA appears not to be accessing it. The last year has been very cold in Canada.
FIXING OR IGNORING THE COOLING OCEAN PROBLEM
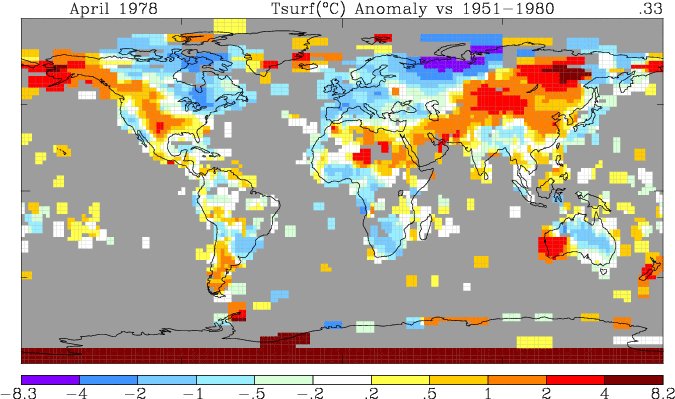
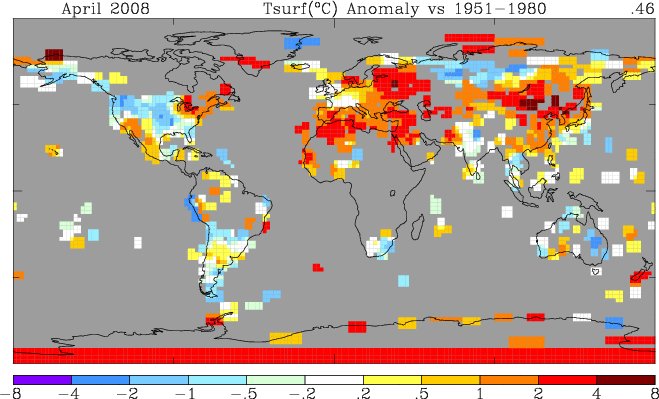
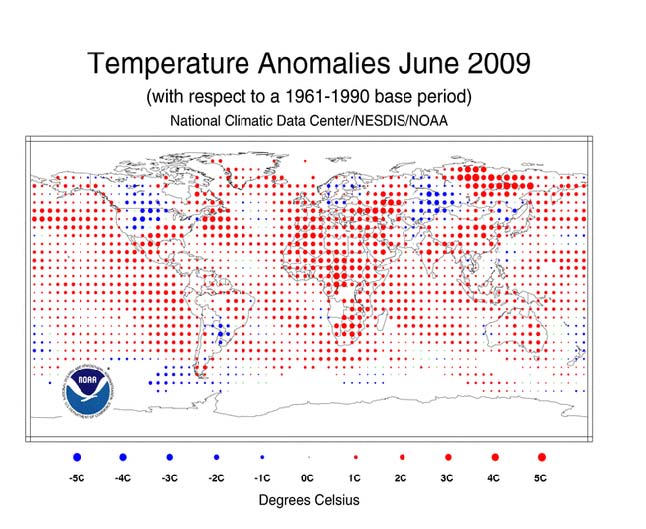
NOAA is a press release designed to assist in the battle to get Cap-and_trade enacted and provide fodder for Copenhagen announced the world’s oceans were last month the warmest on record. See AP nonsense story by GW toady Seth Borenstein here.
Even in the release, NOAA noted the last year made changes to the ocean temperature data base removing the satellite data (IR not the microwave UAH and RSS use) that they claimed was giving a cold bias to the data especially in the southern hemisphere middle and higher latitudes. The oceans now are shown to be warm just about everywhere and in June was the warmest of the record. See NOAA’s map below. Note most of the world’s ocean were warmer than normal (for the oceans it was the warmest June on record).
![]()
Larger here.
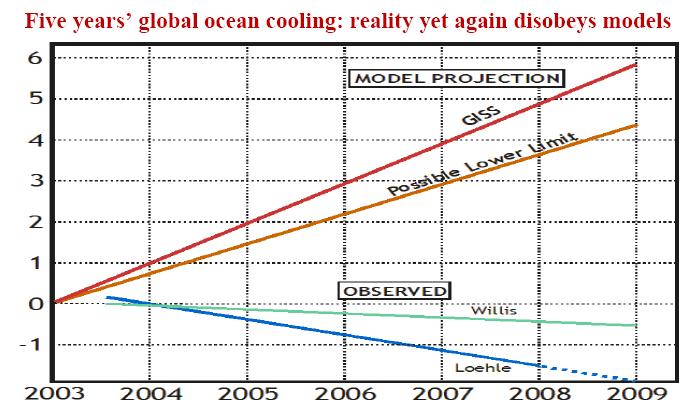
This is true even though the 3342 NOAA ARGO floats worldwide are showing cooling. Plotted data (graph courtesy of SPPI) from the ARGO buoys by NOAA’s Willis and Loehle (2009). NOAA is making no effort being made to use this in monthly global assessments for ‘budgetary reasons’ although that is a convenient excuse.The data is easily accessed.
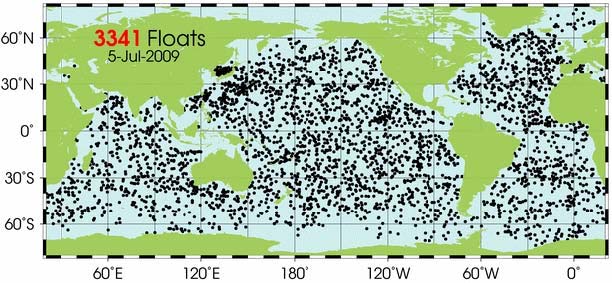
Larger here.
So Secretary Chu, as science advisor who claims to care about being responsible, may I suggest you do an investigation of this data debacle. I assure you that those of us who have worked with it for many years care about it more than you could ever imagine. I have a few names you start with. See more complete analysis here.
Dr. Vincent Gray’s New Zealand Newsletter just out covers some of the the same territory here.
Greenpeace Leader Admits Arctic Ice ExaggerationBy Phelim McAleer & Ann McElhinney
The outgoing leader of Greenpeace has admitted his organization’s recent claim that the Arctic Ice will disappear by 2030 was “a mistake.”
Greenpeace made the claim in a July 15 press release entitled “Urgent Action Needed As Arctic Ice Melts,” which said there will be an ice-free Arctic by 2030 because of global warming.
Under close questioning by BBC reporter Stephen Sackur on the “Hardtalk” program, Gerd Leipold, the retiring leader of Greenpeace, said the claim was wrong.
“I don’t think it will be melting by 2030. ... That may have been a mistake,” he said.
Sackur said the claim was inaccurate on two fronts, pointing out that the Arctic ice is a mass of 1.6 million square kilometers with a thickness of 3 km in the middle, and that it had survived much warmer periods in history than the present.
The BBC reporter accused Leipold and Greenpeace of releasing “misleading information” and using “exaggeration and alarmism.”
Leipold’s admission that Greenpeace issued misleading information is a major embarrassment to the organization, which often has been accused of alarmism but has always insisted that it applies full scientific rigor in its global-warming pronouncements.
Although he admitted Greenpeace had released inaccurate but alarming information, Leipold defended the organization’s practice of “emotionalizing issues” in order to bring the public around to its way of thinking and alter public opinion.
Leipold said later in the BBC interview that there is an urgent need for the suppression of economic growth in the United States and around the world. He said annual growth rates of 3 percent to 8 percent cannot continue without serious consequences for the climate.
“We will definitely have to move to a different concept of growth. ... The lifestyle of the rich in the world is not a sustainable model,” Leipold said. “If you take the lifestyle, its cost on the environment, and you multiply it with the billions of people and an increasing world population, you come up with numbers which are truly scary.” See post here.
(Watch the full BBC interview with Leipold here.)
Note: from Marc Morano to US media: Learn from BBC Reporter Stephen Sackur on how to question enviros claims! Bravo to Sackur for knowing the purpose of a journalist when it comes to questioning green claims! See also Marc’s Post by Navy Meteorologist Dr. Martin Hertzberg Trashing the New York Times for ‘Continuously regurgitating fear-mongering, anecdotal clap trap of global warming propagandists’ ‘Your coverage of the climate issues is a reflection of either extreme negligence or simply scientific illiteracy’ here. He discusses the claims the arctic ice continues to disappear.
Icecap Note: Also see the latest Ice coverage tracking well above 2007 and 2008 levels close to 2005 with 3 to 4 weeks of the melt season to go. Larger here.
See the comparison of the ice this year to last year at this date. Larger here.

Many scientists are believing a Dalton like solar minimum appears a real possibility given the recent solar behavior. Even David Hathaway of NASA has recently conceded that ‘possibility’ to the New York Times here.
I received this email from Dr. Richard Mackey of Australia, a solar statistician expert and peer-reviewed author on solar climate factors. I thought you might find his comments and insight interesting. In it he discusses the extreme scenario that the current solar cycle, the longest in at least 150 years and with more sunspotless days (689 days as of today - more than double the number in the cycles the last half century) during this transition could be telegraphing.
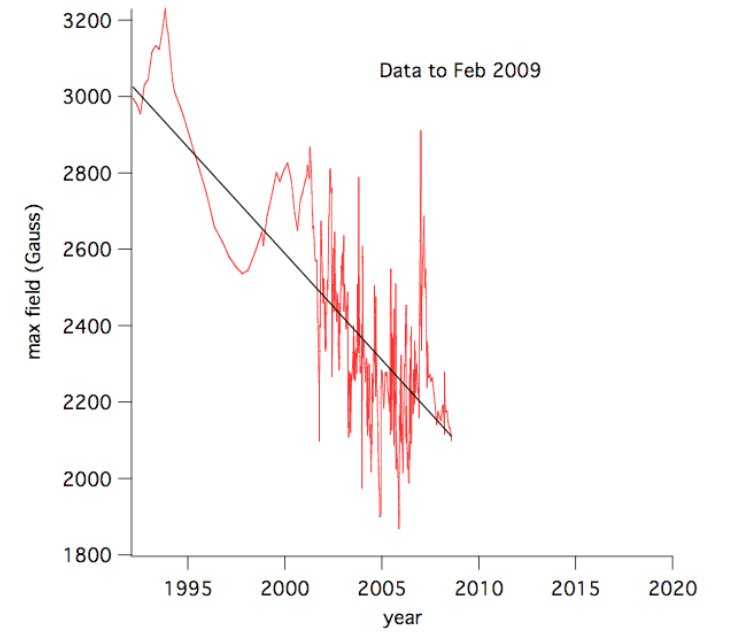
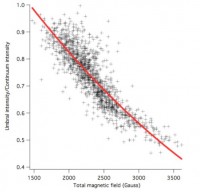
Astronomer Emeritus Dr. William Livingston and Associate Astronomer Dr Matthew Penn have for many years been measuring the magnetic field strength of the Sun’s magnetic fields. See for example this post. WUWT in June this year published a report by them concluding that, broadly speaking, over the last 15 years the magnetic field strengths of sunspots were decreasing with time independently of the sunspot cycle. A simple linear extrapolation of the magnetic data collected by their special observatory (the McMath-Pierce telescope) suggests that sunspots might largely vanish in five years time. In addition, other scientists report that the solar wind (a large proportion of the Sun’s output of matter in the plasma form) is in a lower energy state than found since space measurements began nearly 40 years ago.
In answer to the question: Why is a lack of sunspot activity interesting?, Livingston and Penn answer: “During a period from 1645 to 1715 the Sun entered an extended period of low activity known as the Maunder Minimum. For a time equivalent to several sunspot cycles the Sun displayed few sunspots. Models of the Sun’s irradiance suggest that the solar energy input to the Earth decreased during that epoch, and that this lull in solar activity may explain the low temperatures recorded in Europe during the Little Ice Age”.
EOS is the professional publication of the American Geophysical Union. It is a broadsheet sent every week to AGU members. It always has one feature article, but mainly lists job advertisements and notices about conferences, seminars and the like of interest to AGU members and news of members’ achievements. The feature articles are sometimes about climate change, which are generally supportive of the IPCC dogma.
In EOS of 28 July 2009 there is a very well written feature length article by Livingston and Penn entitled ”Are Sunspots Different During This Sunspot Minimum?” Livingston and Penn answer yes. Their central finding is that regardless of the relation to the sunspot cycles, magnetic intensity in sunspots is decreasing and if this continues in the same way as it has for the last 15 years, the Sun will be devoid of sunspots in five years time: overall the Sun’s energetic output will decline significantly inducing another little ice age on the Earth.
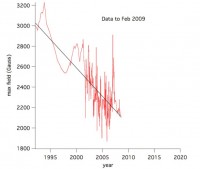
See larger image here.
Livingston and Penn conclude their EOS article with these comments: “Whether this [decline] is an omen of long-term sunspot decline, analogous to the Maunder Minimum, remains to be seen. Other indications of the solar activity cycle suggest that sunspots must return in earnest next year. Because other indications point to the Sun experiencing an unusual period of minimum solar activity, it is critically important to measure the Sun’s magnetic activity during this unique time.”
See larger image here.
Another interesting aspect of Livingston and Penn’s EOS article is that the AGU published it in its professional publication. This suggests to me that the professional societies are returning to practice of true scientific debate that has been suppressed for so long. It is worth recalling the feature article “Natural antidote to global warming” written by Sir John Maddox, then the editor of Nature and published in Nature on 21 September 1995. Sir John referred to the extensive research published up to 1995 indicating the Sun-climate relationship and that the Sun was likely to enter into a Maunder Minimum inducing state sometime during the first few decades of the new millennium.
Sir John, an enthusiastic apostle of the IPCC dogma, asked: “There remains the question of whether the Maunder Minimum will arrive in time to avoid a global carbon tax?” He answered that on the basis of his reading of the evidence published up till then there was only a small chance. However, he concluded by noting that it is a real possibility and that the moral of his commentary was “a better understanding of the Sun might now have practical value.”
Livingston and Penn and a large number of solar physicists (see, for example, the home page of the grandfather of modern solar physics, Professor Emeritus Cornelius de Jager, here would say that now the likelihood of the Earth being seized by Maunder Minimum is now greater that the Earth being seized by a period of global warming. They would answer Sir John’s question by saying: “Yes, the Maunder Minimum will arrive in time to save the planet from the utterly foolish global carbon tax”.
Richard Mackey
Indeed the next few years will be of great interest to see what happens with the sun and if it is indeed a dud few cycles, the climate. Will it refute the IPCC claims that the sun is not an important climate driver in modern times. Read full email and post here. It is my belief we are heading towards a Dalton like minimum based on the behavior of the last four cycles and their similarity to cycles 1-4 in the late 1700s. But the longer the sun stays quiet (today is the 37 straight sunspotless day and we have had 690 sunspotless days this transition already), the more one wonders. 2009 will make a run at the top 5 sunspotless years since 1849 and at 2008 with its 265 spotless days with 179 already this year with four and one half months to go.
By Roger Pielke Sr.
When I served on the committee that resulted in the CCSP (2006) report on reconciling the surface and tropospheric temperature trends, one of the issues I attempted to raise was a warm bias in the construction of long term surface temperature trends when near surface land minimum temperatures (and maximum temperatures when the atmospheric boundary layer remained stably stratified all day, such as in the high latitude winter) were used. This error will occur even for pristine observing sites. Tom Karl and his close associates suppressed this perspective as I document in
Pielke Sr., Roger A., 2005: Public Comment on CCSP Report “Temperature Trends in the Lower Atmosphere: Steps for Understanding and Reconciling Differences”. 88 pp including appendices.
As a result of the poor treatment by Karl as Editor of the CCSP (2006) report, I decided to invesitgate this issue, and others, in a set of peer reviewed papers with colleagues (listed here in the full post).
We now have a new paper accepted which documents further a warm bias in the use of multi-decadal global surface temperature trends to assess global warming. It is: Klotzbach, P.J., R.A. Pielke Sr., R.A. Pielke Jr., J.R. Christy, and R.T. McNider, 2009: An alternative explanation for differential temperature trends at the surface and in the lower troposphere. J. Geophys. Res., in press.
The abstract of the Klotzbach et al (2009) paper reads
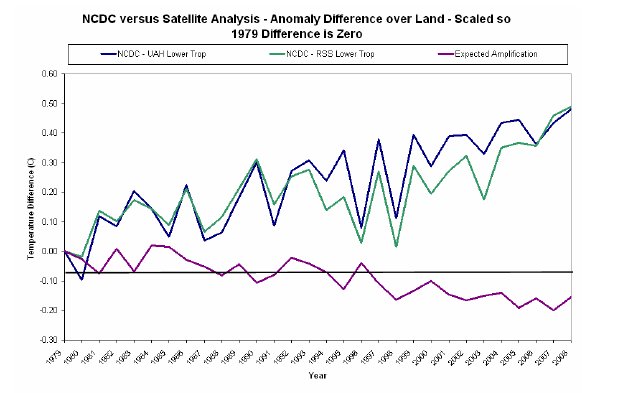
“This paper investigates surface and satellite temperature trends over the period from 1979-2008. Surface temperature datasets from the National Climate Data Center and the Hadley Center show larger trends over the 30-year period than the lower-tropospheric data from the University of Alabama-Huntsville and Remote Sensing Systems datasets. The differences between trends observed in the surface and lower tropospheric satellite datasets are statistically significant in most comparisons, with much greater differences over land areas than over ocean areas. These findings strongly suggest that there remain important inconsistencies between surface and satellite records.”
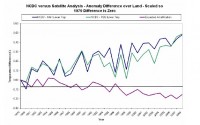
NCDC minus UAH lower troposphere (blue line) and NCDC minus RSS lower troposphere (green line) annual land temperature differences over the period from 1979-2008. Larger image here.
“We find that there have, in general, been larger linear trends in surface temperature datasets such as the NCDC and HadCRUTv3 surface datasets when compared with the UAH and RSS lower tropospheric datasets, especially over land areas. This variation in trends is also confirmed by the larger temperature anomalies that have been reported for near surface air temperatures (e.g., Zorita et al., 2008; Chase et al., 2006; 2008, Connolley, 2008). The differences between surface and satellite datasets tend to be largest over land areas, indicating that there may still be some contamination due to various aspects of land surface change, atmospheric aerosols and the tendency of shallow boundary layers to warm at a greater rate [Lin et al., 2007; Esau, 2008; Christy et al., 2009]. Trends in minimum temperatures in northern polar areas are statistically significantly greater than the trends in maximum temperatures over northern polar areas during the boreal winter months.
We conclude that the fact that trends in thermometer-estimated surface warming over land areas have been larger than trends in the lower troposphere estimated from satellites and radiosondes is most parsimoniously explained by the first possible explanation offered by Santer et al. [2000]. Specifically, the characteristics of the divergence across the datasets are strongly suggestive that it is an artifact resulting from the data quality of the surface, satellite and/or radiosonde observations. These findings indicate that the reconciliation of differences between surface and satellite datasets [Karl et al., 2006] has not yet occurred, and we have offered a suggested reason for the continuing lack of reconciliation.”
What our study shows is that maps prepared by NCDC are biased presentations of the surface temperature anomalies. Our new paper Klotzbach et al (2009) provides evidence of the significant error in the global surface temperature trend analyses of NCDC, and well of other centers such as GISS and CRU, due to the sampling of temperatures at just one level near the surface. It is also important to recognize that this is just one error of a number that are in the NCDC, GISS and CRU data sets, as we have summarized in our paper
Pielke Sr., R.A., C. Davey, D. Niyogi, S. Fall, J. Steinweg-Woods, K. Hubbard, X. Lin, M. Cai, Y.-K. Lim, H. Li, J. Nielsen-Gammon, K. Gallo, R. Hale, R. Mahmood, S. Foster, R.T. McNider, and P. Blanken, 2007: Unresolved issues with the assessment of multi-decadal global land surface temperature trends. J. Geophys. Res., 112, D24S08, doi:10.1029/2006JD008229.
See also Pielke Jr.’s guest post on Watts Up With That on that paper here.
Combine these errors due to station issues, global trends are biased by the removal of satellite based ocean temperatures because it is claimed to have a “cold bias” and the ignoring of the 3000 ARGO buoys which provide excellent global coverage because there is no provision to use them operationally in real or near real time (and because they are showing cooling). By allowing their data to show warm biases, the national data centers which all have a vested interest and involvement in the anthropogenic global warming agenda, are providing the fodder the proponents for carbon control - carbon taxes or cap-and-tax in the government and on Wall Street and among the environmental NGOs.
By Eric Berger, Houston Chronicle
Atlantic hurricanes have developed more frequently during the last decade than at any point in at least 1,000 years, a new analysis of historical storm activity suggests.
The new study, published today in Nature, attempts to reconstruct Atlantic hurricane activity back to the year 500. In doing so the authors found one era, a medieval period around the year 1000, when storm activity matched or exceeded recent hurricane seasons that included storms such as Katrina and Rita.
The scientists used two methods to reconstruct hurricane activity from a period when there were no satellites, reliable ship records or coastal residents taking notes.
One tack is based on the observation that the powerful storm surge of large hurricanes deposits distinct layers of sediment in coastal lakes and marshes. By taking cores of sediments at the bottom of these lakes, which span centuries, scientists believe they can tell when large hurricanes made landfall at a particular location.
The second method used a computer model to simulate storm counts based upon historical Atlantic sea surface temperatures, El Ninos and other climate factors.
The two independent estimates of historical storm activity were consistent, said Pennsylvania State University climate scientist Michael Mann, the paper’s lead author. Both, for example, pinpointed a period of high activity between 900 and 1100.
“This tells us these reconstructions are very likely meaningful,” he said.
This is not Mann’s first attempt to use “proxies” for actual observations of conditions to tease out historical climate details. He was among the scientists whose global temperature reconstruction of the last 1,000 years - dubbed the “hockey stick graph” because it showed a distinct upward trend since the mid-19th century attributed to greenhouse gases - received both praise and criticism.
‘Erroneous conclusions’
Now he appears to be doing the same with hurricane activity, and the new work is not without its detractors.
“The paper comes to very erroneous conclusions because of using improper data and illogical techniques,” said Chris Landsea, science and operations officer at the National Hurricane Center. In his criticism, Landsea notes that the paper begins by saying that Atlantic tropical activity has “reached anomalous levels over the past decade.”
This ignores recent work by Landsea and a number of other hurricane scientists who found that storm counts in the early 1900s - in an era without satellites and fewer seaborne observers - likely missed three or four storms a year. The addition of these storms to the historical record, he said, causes the long-term trend over the last century to disappear.
“This isn’t a small quibble,” he said. “It’s the difference between a massive trend with doubling in the last 100 years, versus no trend.” Read more here.
See Climate Audit’s take on the new Mann work here.
See Watts Up With That on the paper here.
Update: See WOOD TV’s blog post by Bill Steffen here.
See new NOAA study that there is no long term trends (century) in hurricanes/tropical activity by Landsea et al just published here.
UPDATE: Read open letter from Chris Landsea, one of the reviwers of the Mann Nature paper to Michael Mann here. (H/T Ric Werme)
Also see this post by Mark Vogan on the Mann study here.