


by Zeke Hausfather , Steven Mosher, Matthew Menne , Claude Williams , and Nick Stokes
Watts Up With That
[Note: this is an AGU poster displayed at the annual meeting, available here as a PDF. I’ve converted it to plain text and images for your reading pleasure. I’m providing it without comment except to say that Steven Mosher has done a great deal of work in creating a very useful database that better defines rural and urban stations better than the metadata we have available now. - Anthony]
Introduction
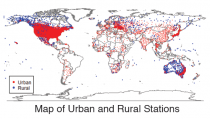
Large-scale reconstructions of surface temperature rely on measurements from a global network of instruments. With the exception of remote automated sensors, the locations of the instruments tend to be correlated with inhabited areas. This means that urban areas [sic] are probably oversampled in surface temperature records relative to the total land surface that is actually urbanized.
It has long been known that urbanized areas tend to have higher temperatures than surrounding less developed (or rural) areas due to the concentration of high thermal mass impermeable surfaces (Oke 1982). This has led to some concern that changes in urban heat island (UHI) effects due to rapid urbanization in many parts of the world over the past three decades may have been responsible for a portion of the rapid rise in measured global land surface temperatures. This concern is reinforced by lower observed trends in some interpretations of satellite measurements of lower tropospheric temperature over land areas during the same period (Klotzbach et al 2009).
An analysis of the impact of urbanization on temperature trends faces multiple confounding factors. For example, an instrument originally installed in a city frequently will have warmer absolute temperatures than one in a nearby rural area (especially at night), but will not necessarily show a higher trend over time unless the environs change in such a way that the UHI signal is altered in the vicinity of the instrument. Similarly, microsite characteristics that may be unrelated to the larger urban environment can have notable effects on temperature trends and act counter to or in concert with the ambient UHI signal.
Moreover, the definition of urban areas is subject to some uncertainty, both in terms of how urban form is characterized and at what distance from built surfaces urban-related effects persist. Published station metadata often includes outdated indications of whether a station is urban or rural, and instrument geolocation data can be imprecise, out of date, or otherwise incorrect.
There is also uncertainty over how much explicit correction is needed for urban warming in global temperature reconstructions, and how well homogenization techniques recently introduced in GHCN-Monthly version 3 both detect and correct for inhomogenities arising from changes in urban form.
To address these issues and obtain a more accurate estimation of the impact of urbanization on land temperature trends, we examine different urbanity proxies at multiple spatial resolutions and urbanity selection criteria through both simple spatial weighting and station pairing techniques. This study limits itself to unadjusted average temperature data, though we will examine homogenized data in the future to see how much of the UHI signal is removed.
Methods
We examine GHCN-Daily version 2.80 temperature data rather than the more commonly used GHCN-Monthly data as it contains significantly more stations, particularly during the past thirty years, and allows for separate examination of maximum and minimum temperatures. A relatively high spatial density of stations is useful to allow sampling into various urban and rural station subsets while minimizing biases due to loss of spatial coverage. After excluding stations that have fewer than 36 months at any time in the period of record or at least one complete year of data during the 1979 to 2010 period, we are left with 14,789 stations.
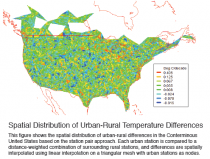
A complete set of metadata is calculated for each station using the station location information provided in station inventories and publically available GIS datasets. These datasets include: Distance From Coast (0.1 deg), Hyde 3.1 historical population data (5arc minute), 2000AD Grump Population density (30 arc seconds), Grump Urban Extent, Land use classes from the Harmonized Land Use inventory (5 arc minutes), radiance calibrated Nightlights (30 arc seconds), ISA- Global Impervious Surfaces (30 arc seconds), Modis Landcover classes (15 arc seconds), and distance from the closest airport (30 arc seconds). In addition, area statistics at progressive radii are calculated around each putative site location.
Stations are then divided into two classes based on various thresholds for urbanity and two analytical methods are used to estimate the bias in trend due to urbanity: a spatial method and a paired station approach. The spatial averaging method relies on solving a set of linear equations for the stations in each class. For each group of stations, urban and rural, a time series of average temperature offsets was created by fitting the model:
where T represents the observed temperature for each station, month and year, L is a local average temperature for each station for each month (incorporating seasonal variation) and G is the desired global (or regional) average, varying by year. This is fitted with a weighting that is inversely proportional to a measure of station density. With a G calculated for both urban and rural, the trends can be compared.
The pairwise method proceeds with the same classification of stations and the following steps are taken. An urban base pair is selected based on the length of record. To qualify as a base urban pair a station must have 30 complete years of data in the 1979-2010 window.
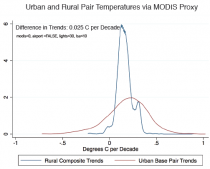
Ten out of 12 months of data are required to count as a complete year. For every urban base station rural pairs are selected based on distance and data overlap. For every urban base station the rural stations are exhaustively searched and all those rural pairs within 500km are assigned to the base station. Since rural stations may have short records the entire rural ensemble is evaluated for data overlap with the urban base pair. 300 months of overlap are required. If the collection of rural stations has less than 300 months of overlap with its urban pair, it is dropped from the analysis. A weighting function is deÞned in the neighborhood of each urban station, which diminishes with distance and is zero outside a certain radius. An average trend is computed for the rural stations within that radius by fitting the model where t is time in years, and B is the gradient. This trend is then compared with the OLS trend for the central urban station. The differences in the shapes of the distributions of the trends is a function of the number of stations that form the trend estimation.
Urban trends are trends for individual stations, while rural trends are the result of computing a trend for all the rural pairs taken as a complete ensemble.
Discussion
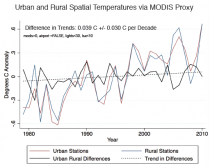
While urban warming is a real phenomenon, it is overweighted in land temperature reconstructions due to the oversampling of urban areas relative to their global land coverage. Rapid urbanization over the past three decades has likely contributed to a modest warm bias in unhomogenized global land temperature reconstructions, with urban stations warming about ten percent faster than rural stations in the period from 1979 to 2010. Urban stations are warming faster than rural stations on average across all urbanity proxies, cutoffs, and spatial resolutions examined, though the underlying data is noisy and there are many individual cases of urban cooling. Our estimate for the bias due to UHI in the land record is on the order of 0.03C per decade for urban stations.
This result is consistent with both the expected sign of the effect and regional estimates covering the same time period (Zhou et al 2004) and differs from some recent work suggesting zero or negative UHI bias (Wickham et al, submitted).
Stricter urbanity proxies that result in a smaller set of rural stations show larger urban-rural differences in trend. The upper limit on UHI bias between rural and urban stations is on the order of 0.06 to 0.1C per decade. However, these cases are clearly problematic from the spatial coverage aspect, as the number of rural stations becomes vanishingly small when the most stringent filters are applied. Adopting cutoffs that define rural less strictly leads to more reasonable spatial coverage and an estimate of UHI bias in the record that converges on 0.02C to 0.04C per decade across the proxies. The station pair approach avoids this issue by limiting the analysis to areas with both rural and urban stations available, but has limited global coverage and excludes large areas in India and coastal China where rapid urbanization has been occurring in recent decades.
It is likely that homogenization will further reduce the observed UHI-related bias, as many urbanity biases are detectable through break-point analysis via comparison to surrounding rural stations. We are currently in the process of using the Pairwise Homogenization Algorithm (Menne and Williams 2009) on GHCN-Daily data to examine the effects in more detail. However, it remains to be seen to what degree UHI bias can be removed via homogenization in areas like coastal China and India where there are few rural stations and where station densities are not particularly high in the current version of GHCN-Daily. In any case, the acquisition of additional station data outside of urban areas in these parts of the world would likely be benefitial.
Acquiring more accurate station location data will allow us to use higher-resolution remote sensing tools to identify urban characteristics below the 5 km threshold, and better test effects of site-specifc vs. meso-scale characteristics on urban warming biases. In addition, validated site locations allows for more refinement in the definition of rural stations as a function of distance from urban cores of various sizes.
References
Center for International Earth Science Information Network (CIESIN), Columbia University; International Food Policy Research Institute (IFPRI); The World Bank; and Centro Internacional de Agricultura Tropical (CIAT). 2004. Global Rural-Urban Mapping Project, Version 1 (GRUMPv1): Population Density Grid. Palisades, NY: Socioeconomic Data and Applications Center (SEDAC), Columbia University. Available at http://sedac.ciesin.columbia.edu/gpw.[Aug 14, 2011].
Elvidge, C.D., B.T. Tuttle, P.C. Sutton, K.E. Baugh, A.T. Howard, C. Milesi, B. Bhaduri, and R. Nemani, 2007, “Global distribution and density of constructed impervious surfaces”, Sensors, 7, 1962-1979
Fischer, G., F. Nachtergaele, S. Prieler, H.T. van Velthuizen, L. Verelst, D. Wiberg, 2008. Global Agro-ecological Zones Assessment for Agriculture (GAEZ 2008). IIASA, Laxenburg, Austria and FAO, Rome, Italy.
Klein Goldewijk, K. , A. Beusen, and P. Janssen (2010). Long term dynamic modeling of global population and built-up area in a spatially explicit way, HYDE 3 .1. The Holocene20(4):565-573.
Klotzbach, P., R. Pielke Sr., R. Pielke Jr., J. Christy, and R. T. McNider, 2009. An alternative explanation for differential temperature trends at the surface and in the lower troposphere. J. Geophys. Res.
Menne, M.J., I. Durre, R.S. Vose, B.E. Gleason, and T.G. Houston, 2011: An overview of the Global Historical Climatology Network Daily Database. Journal of Atmospheric and Oceanic Technology, submitted.
Menne, M.J., and C.N. Williams, Jr., 2009. Homogenization of temperature series via pairwise comparisons. J. Climate, 22, 1700-1717.
Schneider, A., M. A. Friedl and D. Potere (2009) A new map of global urban extent from MODIS data. Environmental Research Letters, volume 4, article 044003.
Schneider, A., M. A. Friedl and D. Potere (2010) Monitoring urban areas globally using MODIS 500m data: New methods and datasets based on urban ecoregions. Remote Sensing of Environment, vol. 114, p. 1733-1746.
T. R. Oke (1982). “The energetic basis of the urban heat island”. Quarterly Journal of the Royal Meteorological Society 108: 1–24.
Wickham, C., J. Curry, D Groom, R. Jacobsen, R. Muller, S. Perlmutter, R. Rohde, A. Rosenfeld, and J. Wurtele, 2011. Inßuence of Urban Heating on the Global Temperature Land Average Using Rural Sites IdentiÞed from MODIS ClassiÞcations.
Submitted.
Zhou, L., R. Dickinson, Y. Tian, J. Fang, Q. Li, R. Kaufmann, C. Tucker, and R. Myneni, 2004. Evidence for a significant urbanization effect on climate in China. Proceedings of the National Academy of Sciences.
Ziskin, D., K. Baugh, F. Chi Hsu, T. Ghosh, and C. Elvidge, 2010, “Methods Used For the 2006 Radiance Lights”, Proceedings of the 30th Asia-Pacific Advanced Network Meeting, 131-142
By Art Horn, Icecap
What is the definition of consensus? According to Webster it’s “General agreement. The judgment arrived at by most of those concerned.” It would appear that the much claimed consensus among leading climate scientists is, shall I say, not in such general agreement these days. If there really is such a consensus, than the opinions from leading climate scientists should be reasonably consistent among them. What I am seeing instead is an increasing divergence among the man made climate doom community.
Let’s set one thing strait from the get go. The data from all of the sources of earth’s measured average global temperature clearly show that there has been a pause in global temperature increase since 1998. People who claim otherwise simply don’t look at the data or believe someone who wrote a story that said warming is accelerating and it’s really, really bad. Don’t trust me on this, look for yourself.
There are those who see the pause and as a reaction to it, have now begun to focus on “extreme weather events” to keep the public engaged and convinced that civilization is gagging Mother Earth with its carbon dioxide pollution. Since the temperature is no longer increasing some other scare tactic needs to be employed to keep the research funding from drying up. In a time of economic turmoil research funding is threatened. For instance at Penn State University funds allocated for research for 2010/11 were $805,000,000, more than half of that lofty sum, $470,000,000 was Federal grants and contracts. An undetermined amount of that money goes to climate research at Penn State. If the lack of warming for over a decade begins to influence how congress doles out money for global warming research, large cuts in grants and contracts could result. Claims of increases in “extreme weather” due to global warming could be the prod that keeps the government funding spigot open.
The problem with trying to compare weather events today to the past is that observational networks have improved dramatically in the years after World War Two. Weather events in the past were vastly underreported due to a lack of reporting stations and primitive communications technologies. In its 2007 report the United Nations Intergovernmental Panel on Climate Change (IPCC) said “At continental, regional, and ocean basin scales, numerous long-term changes in climate have been observed. These include changes in Arctic temperatures and ice, widespread changes in precipitation amounts, ocean salinity, wind patterns and aspects of extreme weather including droughts, heavy precipitation, heat waves and the intensity of tropical cyclones.”
What the report does not say is that multi-decadal ocean temperature oscillations lasting 60 years or more reveal climate fluctuates on time scales that overwhelm our relatively short period of reliable observations. What the report also does not say is that changes in Arctic temperature and ice, widespread changes in precipitation amounts, ocean salinity, wind patterns and aspects of extreme weather including droughts, heavy precipitation, heat waves and the intensity of tropical cyclones are just as likely to be from natural variability as any man made global warming. The attempt to attribute changes in weather over decadal time scales to man made global warming is extremely limited by our short period of reliable weather records and a fundamental lack of understanding what causes climate to change in the first place.
What some would call an unprecedented storm or heat wave today, more experience observers would simply remind us that severe storms or unusual weather events sometime repeat only once every 50, 100, 200 or 500 years or more. There are vastly more rain gauges today than in the past. These gauges record heavy rain events that were missed decades ago. Satellites in space record every tropical cyclone whereas in the past many were missed by a primitive observational network. It is highly unlikely that in just a few decades the world has experience anything remotely near the full range of what Mother Nature can dish out.
Recently Dr. James Hansen of the Goddard Institute for Space Studies published a new paper, Climate Variability and Climate Change: The New Climate Dice. In the paper he said “Thus there is no need to equivocate about the summer heat waves in Texas in 2011 and Moscow in 2010...it is nearly certain that they would not have occurred in the absence of global warming.” He is saying that these heat waves were extreme and unquestionably caused by man made global warming. He went on to say “The increasing greenhouse gases will cause the rapid global warming of the past three decades to continue and this warming will cause the dice to become more and more loaded with greater and greater extreme events.”
Enter Dr. Ben Santer climate researcher at the Lawrence Livermore National Laboratory and former researcher at the University of East Anglia’s Climate Research Unit. He recently said “Looking at a single, noisy 10-year period is cherry picking, and does not provide reliable information about the presence or absence of human effects on climate.” Dr. Santer went on to say “A single decade of observational temperature data is inadequate for identifying a slowly evolving human caused warming signal.” Very interesting, on the one hand we have the head of the Goddard Institute for Space Studies saying that “Thus there is no need to equivocate about the summer heat waves in Texas in 2011 and Moscow in 2010…it is nearly certain that they would not have occurred in the absence of global warming.” And then we have the lead author of a new paper from the Lawrence Livermore National Laboratory saying “Looking at a single, noisy 10-year period is cherry picking, and does not provide reliable information about the presence or absence of human effects on climate.”
These two statements by leading climate researchers, both of whom have testified before congress as to the severity of global warming, are in complete opposition to each other. Dr. Hansen is saying the man made global warming signal is clear and is revealed in the summer heat waves in Moscow in 2010 and Texas in 2011. Dr. Santer is saying that looking at short term temperature trends and calling them a sign of man made global warming is “cherry picking” and that you can’t draw conclusions about man made global warming in such short periods of time. It would seem the “consensus” is not so generally agreed upon by two leading climate scientists.
Another example of the not so agreed upon consensus comes from a recently published summary from the IPCC. It says “It is virtually certain that increases in the frequency and magnitude of warm daily temperature extremes and decreases in cold extremes will occur in the 21st century on the global scale.” The report continued with “It is likely that the frequency of heavy precipitation or the proportion of total rainfall from heavy falls will increase over the 21st century over many areas of the globe.”
Incredibly in the same summary the IPCC says “Projected changes in climate extremes under different emissions scenarios generally do not strongly diverge in the coming two to three decades, but these signals are relatively small compared to natural climate variability over this time frame. Even the sign (higher or lower) of projected changes in some climate extremes over this time frame is uncertain.” They are saying that up to the year 2040 the climate changes from the emissions of carbon dioxide will be so small as to be virtually undetectable from natural climate variability. This also strongly implies that any effects from global warming on extreme weather now are so small, compared with natural variability, that they are undetectable. This IPCC statement also leads to the conclusion that any claims that global warming is causing noticeable extreme weather events today is false. However, after 2040 the effects of global warming will then overwhelm nature and extreme events will be increasing due to carbon dioxide emissions. It appears the IPCC is worried about the lack of recent warming and is pushing the climate calamity farther into the future. To the general public this must send a very confusing mixed message.
Dr. Richard Muller, a physics professor at the University of California, Berkley recently attempted to clarify what the measured temperature record reveals about global warming. His BEST (Berkley Earth Surface Temperature project) report generated a lot of media attention. On a BBC radio program Muller said “we see no evidence of it (global warming) having slowed down, no leveling off.” But his own BEST data says it has. The BEST data shows no warming since 2001. So what is it, is it warming or not? Give it your BEST guess. Apparently Dr. Muller is so confused about the whole thing that he doesn’t even know what his own report shows! In mid-November Dr. Muller was on MSNBC and said “We’re getting very steep warming” then in almost the same breath he said on a different day “Right now we don’t know that it’s warming. It may be constant, we don’t know.”
Real world temperature data shows that the warming of the earth’s average temperature that started in the mid 1970s stopped near the turn of the millennium. The years have progressed and warming has not resumed as predicted. As a direct result of this the government funded university system and the radical environmental movement climate doom industry is having big problems figuring out how to keep the fear alive. There appears to be a growing confusion among some of the world’s most prominent climate scientists and the IPCC as to just what is going on.
Some say it’s warming, some say it’s not. Some say global warming is causing extreme weather right now, some say it’s not going to happen until we’re nearly halfway through the 21st century. It’s time for these scientists and the IPCC to fess up to the fact that they really don’t know what is going on and that there is no “overwhelming consensus” as to what causes climate change. The implications of coming clean on this confusion are massive. Our energy policy and future prosperity are being shaped by fear of man made global warming. If the “experts” aren’t sure of what’s happening, how can we make sound decisions about what is the BEST path to insure plentiful and affordable energy in the future? PDF.
By Anthony Watts, Watts Up With That
Here’s the popup message solicitation you get when you visit the website for the first time:

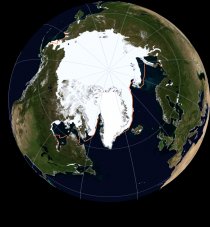
Climate change is melting the North Pole and it’s no longer safe for Santa and his Workshop. So our dear old friend is packing up the sleigh to find somewhere else to live.
You can help! Move your mouse over this website to find gifts you can buy Santa to help him set up a temporary Workshop and protect the North Pole for his return.
Of course, you’re savvy enough to know we won’t be sending actual gifts to Santa. You will receive a tax receipt for 100% of your purchase and proceeds will be used by the David Suzuki Foundation to support our critical work to protect nature and the environment from threats like climate change.
Buying these green gifts and personalized ecards on behalf of hard-to-buy-for friends or relatives on your holiday list is a great way to show you’re thinking of them - and the planet!
Act now to help Santa!
Sincere thanks,
The David Suzuki Foundation
This is nothing more than a thinly veiled revenue generator for the foundation.
No shame, no scruples, just send money. Is it any wonder informed people are doubting the climate change issue when presented with crap like this?
h/t to Mike Bromley in Canada who writes:
Canadian geneticist-turned-environmentalist David Suzuki targeted children in his latest outburst of emotionally-charged enviro-gab, this time scaring the fun out of Christmas by warning that Santa’s home was melting. In a post-black-Friday period of climate-ethical circus generation, this takes the cake. This is beyond reprehensible.
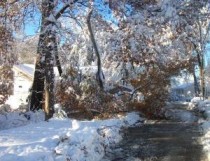
Here’s what the North Pole looks like today:
UPDATE: Here’s a clip from 1972 showing Suzuki comparing humans to maggots in his own words. Looks like that must have been his Che’ Guevara period. (h/t Daily Bayonet)
Dear Secretary of State
25 November 2011
We are pleased that you have decided that a public response to growing criticism of your climate policies is now required. We regret, however, that you do not address our main arguments and key concerns. Neither are we impressed by evidently ill-advised assertions.
For a start, you make the mistake of connecting the reality of 20th century global warming, which no one doubts, with the various causes for it. You claim that the evidence for man’s influence is getting stronger every year, yet you fail to provide any empirical evidence for this statement.
In reality, over the past few years there has been a growing realisation among scientists that other influences (such as solar, stratospheric water vapour, oceanic cycles, to name but the most dominant) are likely to be more significant than previously thought. These factors have seriously impinged on estimates of the magnitude of mankind’s influence.
Your faith in the conclusion of Australia’s Garnaut Review - that there has been no change in the rate of global warming in recent years - is wholly at odds with the latest scientific work and even the Government’s own Met Office: Most research papers published in the last 12 months confirm that there has been no warming trend in the last 10 years.
It is true that the fundamental greenhouse effect yields only a 1.2C increase for a doubling of CO2 (so-called climate sensitivity) and that larger increases depend upon various feedback mechanisms. There is no convincing evidence, however, to support your assertion that the increase of the level of water vapour in the atmosphere (as a result of doubling of CO2) would (other things being equal) raise global average temperature by around 3C.
In reality, the magnitude of water vapor feedbacks, positive as well as negative (such as increased cloud cover and precipitation) remains a poorly understood subject. Do you seriously believe that only ‘one or two people’ (sic) have published research that shows moderate rather than catastrophic warming in the next 100 years?
You do not seem to appreciate the incomplete state of scientific knowledge regarding these extremely complex feedbacks. In reality, most scientists will tell you that we do not know all of them; and that most of those we do know, we understand only rudimentary.
What is more, estimates for climate sensitivity in the peer reviewed literature have been going down. You and your advisers will no doubt take a look at the latest research findings on this very subject by Schmittner et al. published this week in the journal Science. This is yet another study that corroborates a low estimate of climate sensitivity and concludes that “these results imply a lower probability of imminent extreme climate change than previously thought.”
Your faith in the integrity of the IPCC process is no less ill-advised. There have been three reports on the IPCC - by the InterAcademy Council in 2010; the recent book by Donna Laframboise; and the report by Professor Ross McKitrick published recently by the GWPF (a copy of which is attached). You and your advisers need to study all three as they all identify a common set shortcomings in the IPCC’s scientific approach and its working methods.
The IPCC seeks to present itself as embodying the independent, impartial advice of the world’s best scientists in the field. All three reports reveal serious flaws in this claim - its lack of transparency in how the so-called experts are chosen, its resistance to views challenging its orthodoxy, its lack of proper governance to deal with conflicts of interest, its excessive use of non-peer reviewed (grey literature), and its infiltration by activists from environmental pressure groups.
We are surprised that you have been so slow to recognise that the IPCC, which has influenced a great deal of UK policy, no longer carries the credibility necessary to persuade society of the massive changes it is advocating. It should be drastically reformed or wound up and replaced.
We note that you appear to be denying the charge on unilateralism in UK policy. This is curious as you and your predecessors were keen to boast that the Climate Change Act made Britain a world leader in decarbonisation. And you personally have been urging the EU to adopt even more ambitious targets, fortunately unsuccessfully.
Admittedly, you limit your claim that Britain has not adopted unilateral policies to “until 2020,” but even this ceiling is at odds with the introduction of the carbon floor price which you wish to introduce in the next couple of years. This scheme most certainly is a unilateral folly which is already having a devastating effect on manufacturing and energy-intensive industries - which, of course, are also concerned about what is planned for after 2020.
In reality, the UK stands alone as the only country in the world to impose long-term legally binding CO2 emissions targets. No other country in the world is willing to inflict such unilateral burden on its business sector and economy.
Even within the EU Commission major concerns about its unilateral targets have begun to surface. The EU is now seriously considering to discontinue its unilateral decarbonisation in the absence of a global agreement.
Whether you like it or not, the Chancellor of the Exchequer, George Osborne, has pledged that the government will no longer be bound by unilateral decarbonisation targets that cut CO2 emissions in Britain faster and deeper than other countries in Europe. We trust that his promise to abandon the path of green unilateralism will be followed, sooner rather than later, by a less extreme and more pragmatic policy.
Lord Lawson
Lord Turnbull
A new batch of emails has emerged again at the Air Vent.. See Anthony Watts post Climategate 2.0 emails - They’re real and they’re spectacular!
As was the case with the first email release, I am traveling. Maybe if I had been travelling more, the farce would have been over long ago. Here is an excellent summary story with links to many important analyses of the whistleblower emails. The mainstream medie ignored the first Climategate emails. Will they brush off the second batch. Hopefully it will ensure the deraiiment /repeat failure of the UN Durban talks and the process which IPCC official Ottmar Edenhofer in November 2010 admitted “one has to free oneself from the illusion that international climate policy is environmental policy.” Instead, climate change policy is about how “we redistribute de facto the world’s wealth...”
---------------
Natural Variability To Dominate Weather Events Over Coming 20-30 Years
GWPF Press Release
London: For many decades to come, and probably longer, mankind’s influence on the frequency of extreme weather events will be insignificant.
According to a preliminary report released by the IPCC, there will be no detectable influence of mankind’s influence on the Earth’s weather systems for at least thirty years, and possibly not until the end of this century.
The Summary for Policymakers of the Special Report on Managing the Risks of Extreme Events and Disasters to Advance Climate Change Adaptation, is in stark contrast to other statements made by the IPCC. It shows that mankind’s influence on the weather is far smaller than natural factors.
If and when mankind’s influence becomes apparent it may be just as likely to reduce the number of extreme weather events as increase them.
Surveying the state of scientific knowledge IPCC scientists say they cannot determine if mankind’s influence will result in more, or fewer, extreme weather events over the next thirty years or more.
The IPCC report says:
“Projected changes in climate extremes under different emissions scenarios generally do not strongly diverge in the coming two to three decades, but these signals are relatively small compared to natural climate variability over this time frame. Even the sign of projected changes in some climate extremes over this time frame is uncertain”
“This shows the depth of our ignorance of this subject,” says Dr David Whitehouse, science editor of the GWPF. “Whilst it is always important to think about the future in the light of changes we observe to the Earth’s climate, in trying to draw conclusions so far ahead based on what we know, the IPCC scientists are speculating far beyond any reasonable scientific justification.”
Even making the questionable assumption that our computer models are good enough to predict what will happen in the future, for projected changes by the end of the 21st century, the uncertainties in those computer models, and the range of natural climatic variability, are far larger than any predicted human-influenced effects.
Extreme weather events have always been with us, and will continue to be so. It is the international community’s responsibility to make those likely to be subjected to them become more resilient.
Contact: Dr David Whitehouse david.whitehouse@thegwpf.org
----------------
COLDEST NOVEMBER TEMPERATURE AT FAIRBANKS SINCE 1994
FAIRBANKS, Alaska - Alaska’s second-largest city is used to cold weather, but few residents expected record-breaking cold this early in the season. Shawn Ross has lived in Fairbanks his entire life and says few people were prepared for this severe of a cold snap in mid-November. The Fairbanks Daily News-Miner reports that for the second time in three days, Fairbanks set a new low temperature record on Thursday. A temperature of 41 degrees below zero - the first 40 below temperature of the season - was recorded at Fairbanks International Airport at 6:29 a.m. The National Weather Service in Fairbanks says that broke the old record of 39 below set in 1969. The last time Fairbanks residents saw 40-below temperatures in November was in 1994.
Fairbanks set a new record of 35 below on Tuesday and the temperature bottomed out at 39 below on Wednesday, two degrees shy of the record.
Thursday’s record low of 41 below marked the sixth earliest 40-below temperature recorded by the National Weather Service in Fairbanks since 1904. The earliest it’s ever hit 40 below in Fairbanks was Nov. 5, 1907, when it hit 41 below.
The last time Fairbanksans saw 40-below temperatures in November was in 1994, when temperatures of 45, 43 and 45 below were recorded on Nov. 24, 25 and 30, respectively.
The bitter, early season cold had Interior residents wondering if somebody turned the calendar ahead a month or two.
“This sort of thing is certainly more common in December and January than November,”: meteorologist Dan Hancock at the National Weather Service in Fairbanks said. “We can go through an entire winter and not get this cold.”
by Steve Milloy
Alarmists try to downplay an entire decade of no-global-warming - while other alarmists cite individual weather events as reliable indicators of manmade climate change.
From a Lawrence Livermore National Laboratory media release:
In order to separate human-caused global warming from the “noise” of purely natural climate fluctuations, temperature records must be at least 17 years long, according to climate scientists.
To address criticism of the reliability of thermometer records of surface warming, Lawrence Livermore National Laboratory scientists analyzed satellite measurements of the temperature of the lower troposphere (the region of the atmosphere from the surface to roughly five miles above) and saw a clear signal of human-induced warming of the planet.
Satellite measurements of atmospheric temperature are made with microwave radiometers, and are completely independent of surface thermometer measurements. The satellite data indicate that the lower troposphere has warmed by roughly 0.9 degrees Fahrenheit since the beginning of satellite temperature records in 1979. This increase is entirely consistent with the warming of Earth’s surface estimated from thermometer records.
Recently, a number of global warming critics have focused attention on the behavior of Earth’s temperature since 1998. They have argued that there has been little or no warming over the last 10 to 12 years, and that computer models of the climate system are not capable of simulating such short “hiatus periods”: when models are run with human-caused changes in greenhouse gases.
“Looking at a single, noisy 10-year period is cherry picking, and does not provide reliable information about the presence or absence of human effects on climate,” said Benjamin Santer, a climate scientist and lead author on an article in the Nov. 17 online edition of the Journal of Geophysical Research (Atmospheres).
Many scientific studies have identified a human “fingerprint” in observations of surface and lower tropospheric temperature changes. These detection and attribution studies look at long, multi-decade observational temperature records. Shorter periods generally have small signal to noise ratios, making it difficult to identify an anthropogenic signal with high statistical confidence, Santer said.
“In fingerprinting, we analyze longer, multi-decadal temperature records, and we beat down the large year-to-year temperature variability caused by purely natural phenomena (like El Ninos and La Ninas). This makes it easier to identify a slowly-emerging signal arising from gradual, human-caused changes in atmospheric levels of greenhouse gases,” Santer said.
The LLNL-led research shows that climate models can and do simulate short, 10- to 12-year “hiatus periods” with minimal warming, even when the models are run with historical increases in greenhouse gases and sulfate aerosol particles. They find that tropospheric temperature records must be at least 17 years long to discriminate between internal climate noise and the signal of human-caused changes in the chemical composition of the atmosphere.
“One individual short-term trend doesn’t tell you much about long-term climate change,” Santer said. “A single decade of observational temperature data is inadequate for identifying a slowly evolving human-caused warming signal. In both the satellite observations and in computer models, short, 10-year tropospheric temperature trends are strongly influenced by the large noise of year-to-year climate variability.”
The research team is made up of Santer and Livermore colleagues Charles Doutriaux, Peter Caldwell, Peter Gleckler, Detelina Ivanova, and Karl Taylor, and includes collaborators from Remote Sensing Systems, the National Center for Atmospheric Research, the University of Colorado, the Canadian Centre for Climate Modeling and Analysis, the National Oceanic and Atmospheric Administration, the U.K. Meteorology Office Hadley Centre, and Lawrence Berkeley National Laboratory.
Click for the LLNL media release.
By Steve McIntyre, Climate Audit
In today’s post, I’m going to report for the first time on information on the Penn State Inquiry Committee from an inside source (PS) who was familiar with the activities of the Inquiry Committee. PS agreed that the Inquiry Committee didn’t do their job, but pointed me to different reasons than those discussed in an earlier post on the matter.
PS’s information requires interpretation, but left me convinced that William Easterling, who was said by the Inquiry Committee report to have “recused” himself from the inquiry, had continued to exert influence on the inquiry and, indeed, it was his influence that resulted in the Inquiry Committee’s failure to contact targets of the Climategate team, including, most notably me.
When I was first contacted by PS, I asked him/her why the Inquiry Committee had neglected to contact me. The Inquiry Committee’s eventual report stated that, while they had received many complaints, the complaints were not directly reducible to allegations under Penn State academic misconduct policies. As both a target and someone intimately familiar with the material, I was an obvious resource. The failure of the Inquiry Committee to contact me was a startling omission. Why had this happened?
The reply:
You were not contacted for a reason. Recuse but not excuse!
I didn’t understand what he/she was saying at all, answering as follows:
I don’t understand your comment below. “recuse” applies to a judge, not to someone giving evidence.
PS replied:
Reread the Inquiry Report for context for “recuse”.
I didn’t figure out this clue at the time and responded impatiently:
I doubt that you would change my mind that your inquiry didn’t do its job. Not for the reasons that many readers presume - but because the inquiry purported to assume tasks of the investigation phase that should not be done in an inquiry stage, a point that I made in posts last year - see. Procedurally, the process was totally botched. It’s too bad that you didn’t carry out the job that you were supposed to do, as it might well have somewhat cleared the air.
The final comment was an agreement that the Inquiry Committee hadn’t done its assigned job, but said that I had got to the right conclusion based on an incorrect analysis:
You have reached the right conclusion though based on incorrect assumptions.
In the wake of the Penn State scandal, I sent this correspondence to someone else who immediately solved the riddle. The word “recuse” occurs on one occasion in the Inquiry Committee report:
At this meeting [Nov 24, 2009], all were informed of the situation and of the decision to respond to the matter with an inquiry under RA-10. Dr. Pell then discussed the responsibilities that each individual would be expected to have according to policy. At this time, Dean Easterling recused himself from the inquiry for personal reasons.
While Easterling’s reasons were not stated in the report, the existence of some sort of conflict is evidenced by the mere fact that Easterling felt obliged to declare that he “recused” himself.
“Recuse but not excuse”.
My interpretation of this oracle is that, despite a conflict that obliged Easterling to declare that he had “recused” himself, Easterling, in fact, continue to influence the proceedings and was responsible, directly or indirectly, for the Inquiry Committee’s decision not to contact critics, including, most obviously, me. Instead, they used Gerry North and Donald Kennedy as experts on the emails, even though North admitted that he had not read the emails out of “professional courtesy”.
That the Penn State Inquiry Committee had not done its prescribed job was evident to me as soon as I read the report - for the reasons that I reported at the time. However, PS pointed to a reason that I had not contemplated: that despite his supposed “recusal”, Easterling continued to exert influence on the Inquiry Committee, including its decision not to contact critics.
Whether my specific interpretation of the events surrounding the Inquiry Committee is now correct, my conclusion that the Inquiry Committee had not done its assigned job was confirmed:
You have reached the right conclusion
As I had noted at the time, the procedural advice given to the Inquiry Committee seemed highly questionable. Wendell Courtney, counsel to the Inquiry Committee, has, of course, become prominent in the wake of his role in the Penn State scandal.
By Joseph D’Aleo
“Green” activism (including grants) worldwide is a $411 billion misinformation business.
We have let an unholy alliance of radical environmentalists, a corrupt UN, demagoging and rent-seeking politicians, power hungry and agenda driven agencies like the US EPA and their equivalents in places like the UK and Australia, unethical scientific and economic grant toting elites and their opportunistic academic institutions and an agenda driven media that control the message to their enormous benefit and the detriment of the world’s peoples and economies.
Because of their policies, we have seen explosion of people in fuel poverty even in the developed nations - where many elderly and pensioners and poor families must choose between heating and eating. Meanwhile needed energy sources have been denied to poorer parts of the third world because they claim that would increase the emissions of CO2, a beneficial gas that has NEVER been shown to have damaging effect on climate or health. Climategate and IPCC gate showed how vacuous the so called settled global warming science is. But the media ignored it. As warming failed and sea levels stopped rising, the movement refocused on extremes including cold and snow that their own models suggested would become rare as proof of man’s impact.
Our energy policy is turned upside down with costly, inefficient yet lavishly subsidized renewables forced on us and proven energy resources demonized, limited or denied.
We have learned nothing from the failed experiments in places like Spain where 2.2 jobs were lost for every 1 green job while 1 of every 10 green jobs were permanent and where soaring energy costs drove industry out of Spain resulting in 20.5% unemployment. In Italy, 3.5 jobs were lost for every subsidized green jobs and the world is watching the Italian economy collapse. Part of the world’s economic problems can be attributed to the unholy alliance’s work.
Why has the media ignored these facts and the real motive admission by IPCC official Ottmar Edenhofer in November 2010 “one has to free oneself from the illusion that international climate policy is environmental policy.” Instead, climate change policy is about how “we redistribute de facto the world’s wealth...”.
For today’s ‘illuminati’ in the unholy alliance, it is all about power and wealth. They have built their economic and energy policies on a house of cards scientific theory that deserves to be thrown in the trash heap of history. We have to recognize the light upstairs went out years ago. The Dark Ages are back.
By Anthony Watts
See update below: New comparison graph of US temperatures in 1999 to present added - quite an eye opener - Anthony
There’s been a lot of buzz and conflicting reports over what the BEST data actually says, especially about the last decade where we have dueling opinions on a “slowing down”, “leveling off”, “standstill”, or “slight rise” (depending on whose pronouncements you read) of global warming.
Here’s some media quotes that have been thrown about recently about the BEST preliminary data and preliminary results:
“‘We see no evidence of it [global warming] having slowed down,’ he told BBC Radio 4’s Today programme. There was, he added, ‘no levelling off’.” - Dr. Richard Muller
In The Sunday Mail Prof Curry said, the project’s research data show there has been no increase in world temperatures since the end of the Nineties:
- Dr. Judith Curry in The Sunday Mail“There is no scientific basis for saying that warming hasn’t stopped,’ she said. ‘To say that there is detracts from the credibility of the data, which is very unfortunate.’
Climatologist Dr. Pat Michaels in an essay at The GWPF wrote:
“The last ten years of the BEST data indeed show no statistically significant warming trend, no matter how you slice and dice them”. He adds: “Both records are in reasonable agreement about the length of time without a significant warming trend. In the CRU record it is 15.0 years. In the University of Alabama MSU it is 13.9, and in the Remote Sensing Systems version of the MSU it is 15.6 years. ”
In the middle of all those quotes being bandied about, I get an email from Burt Rutan (yes THAT Burt Rutan) with a PDF slideshow titled Winter Trends in the United States in the Last Decade citing NCDC’s “climate at a glance” data. This is using the USHCN2 data, which we are told is the “best”, no pun intended. It had this interesting map of the USA for Winter Temperatures (December-February) by climate region on the first slide:ICECAP NOTE That is an ICECAP graphic that Dr Rutan we are pleased to say used
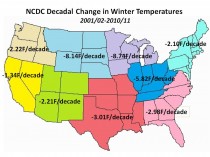
Hmmm, that’s a bit of a surprise for the steepness of those trend numbers. So I decided to expand and enhance that slide show by combining trend graphs and the map together, while also looking at other data (summer, annual). Here’s a breakdown for CONUS by region for Winter, Summer, and Annual comparisons. Click here to enlarge to full size to view the graphs.
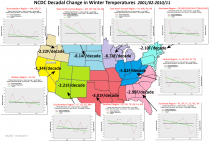
Winter temperatures and trends F, 2001-2011. Note that every region has a negative trend:
Here similarly is the summer trends 2001-2011. Note that 5 of 9 regions have a negative summertime trend.
And finally here is the Annual yearly mean temperature trend for the last decade. Since 2011 is not yet complete for annual data (though is for Winter and Summer data), I’ve plotted the last decade available, from 2000-2010.
Only 1 of 9 regions has a positive decadal trend for the Annual mean temperature, the Northeast.
This data is from USHCN2, from the National Climatic Data Center (NCDC). Note that I have not adjusted it or even self plotted it in any way. The output graphs and trend numbers are from NCDC’s publicly available ”Climate At A Glance” database interface, and these can be fully replicated by anyone easily simply by going here and choosing “regions”.
I find the fact that summer temperatures were negative in five of 9 regions interesting. But most importantly, the trend for the CONUS for the past 10 years is not flat, but cooling.
The trend line for the contiguous lower 48 states looks like this for the same period when we plot the Annual mean temperature data for 2001-2010 (we can’t plot 2011 yet since the year isn’t complete):
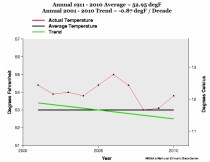
So according the the National Climatic Data Center, it seems clear that for at least the last 10 years, there has been a cooling trend in the Annual mean temperature of the contiguous United States. Pat Michaels in his GWPF essay talks about 1996 :
A significant trend since these periods began is not going to emerge anytime soon. MSU temperatures are plummeting and are now below where they were at this time of the year in the 2008 La Nina. NOAA is predicting an extreme La Nina low in 2012. If the 1976-98 warming trend is re-established in 2013, post-1996 warming would not become significant until 2021.
So when you run the NCDC “climate at a glance” plotter from 1996 for the USA on Annual mean temperature data for the contiguous United States for 15 years of data, you get this, flatness:
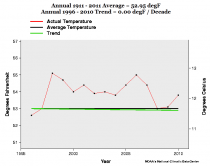
Warming, for the USA seems pretty “stalled” to me in the last 10-15 years. Bear in mind that BEST uses the same data source for the USA, the USCHN2 data. Granted, this isn’t a standard 30 year climatology period we are examining, but the question about the last 10 years is still valid. “Aerosol masking” has been the reason given by the Team. Blame China.
For the inevitable whining and claims of cherry picking that will come in comments, here’s the complete data set from NCDC plotted from 1895. I added the 1934 reference line in blue:
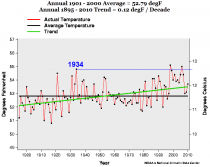
Interestingly, we’ve had only two years that exceeded 1934 for Annual mean temperature in the United States and they were El Nino related. 1998 and 2006 both had El Nino events.
While the United States is not the world, it does have some of the best weather data available, no pun intended. Given the NCDC data for CONUS, it certainly seems to me that warming has stalled for the United States in the last decade.
UPDATE: 11/06/2011 8AM PST
When I wrote the post above, I had concerns that the 1998 and 2006 peaks might not have actually exceeded 1934. I didn’t have the energy to explore the issue last night. This morning looking anew, I recalled the GISS Y2K debacle and recovered the graphs from Hansen’s 1999 press release. This was originally part of “Lights Out Upstairs” a guest post by Steve McIntyre on my old original blog. Just look at how much warmer 1934 was in 1999 than it is now. Much of this can be attributed to NCDC’s USHCN2 adjustments.
Steve wrote then:
In the NASA press release in 1999 , Hansen was very strongly for 1934. He said then:
The U.S. has warmed during the past century, but the warming hardly exceeds year-to-year variability.Indeed, in the U.S. the warmest decade was the 1930s and the warmest year was 1934.
This was illustrated with the following depiction of US temperature history, showing that 1934 was almost 0.6 deg C warmer than 1998.
From a Hansen 1999 News Release
However within only two years, this relationship had changed dramatically. In Hansen et al 2001 (referred to in the Lights On letter), 1934 and 1998 were in a virtual dead heat with 1934 in a slight lead. Hansen et al 2001 said
The U.S. annual (January-December) mean temperature is slightly warmer in 1934 than in 1998 in the GISS analysis (Plate 6)… the difference between 1934 and 1998 mean temperatures is a few hundredths of a degree.
From Hansen et al 2001 Plate 2. Note the change in relationship between 1934 and 1998.
Between 2001 and 2007, for some reason, as noted above, the ranks changed slightly with 1998 creeping into a slight lead.
The main reason for the changes were the incorporation of an additional layer of USHCN adjustments by Karl et al overlaying the time-of-observation adjustments already incorporated into Hansen et al 1999. Indeed, the validity and statistical justification of these USHCN adjustments is an important outstanding issue.
====
I’ve prepared a before and after graph using the CONUS values from GISS in 1999 and in 2011 (today).
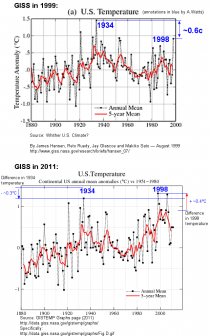
GISS writes now of the bottom figure:
Annual Mean Temperature Change in the United States
Annual and five-year running mean surface air temperature in the contiguous 48 United States (1.6% of the Earth’s surface) relative to the 1951-1980 mean. [This is an update of Figure 6 in Hansen et al. (1999).]
So clearly, the two graphs are linked, and 1998 and 1934 have swapped positions for the “warmest year”. 1934 went down by about 0.3C while 1998 went up by about 0.4C for a total of about 0.7C.
And they wonder why we don’t trust the surface temperature data.
In fairness, most of this is the fault of NCDC’s Karl, Menne, and Peterson, who have applied new adjustments in the form of USHCN2 (for US data) and GHCN3 (to global data). These adjustments are the primary source of this revisionism. As Steve McIntyre often says: “You have to watch the pea under the thimble with these guys”.
By Caroline May, The Daily Caller
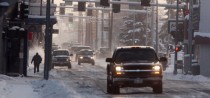
With summer over, climate concerns turn to extreme winter weather; and in the wake of the Eastern seaboard’s early cold snap, some are pointing to global warming as the cause of the unseasonable wintry mix.
In Philadelphia, following the recent Northeast snowstorm, Glenn “Hurricane” Schwartz, NBC 10’s chief meteorologist, chalked up the last three years’ extreme weather to global warming.
“So, the ONLY reasonable explanation is that ‘global warming’ is having some effect on this extreme weather,” Schwartz wrote Friday. “Computer models (and simple meteorological logic) have shown for a long time that higher carbon dioxide levels in the atmosphere would lead to more heat and more water vapor. I even believe our record October snowstorm is more evidence of global warming rather than the opposite, which would seem more logical.”
NBC Nightly News anchor Brian Williams also speculated that the winter weather was a part of climate change.
“Everybody out east said the same thing about this freak snowstorm: “This kind of thing didn’t used to happen, This never happened before."” Williams said prior to a segment on the accuracy of climate change reports. “And while that is true, it may also be true that we’ll all have to start getting used to this kind of thing over the long haul.”
The Associated Press reported last week that the Intergovernmental Panel on Climate Change (IPCC) will soon issue a report concluding that there is a two-thirds chance that man-made global warming is already creating “climate extremes.”
“The extremes are a really noticeable aspect of climate change,” “Gerry Meehl, senior scientist at the National Center for Atmospheric Research, told the Associated Press. “I think people realize that the extremes are where we are going to see a lot of the impacts of climate change.”
But the IPCC says climate change did not cause last month’s wintry surprise.
Weather Channel co-founder Joe D’Aleo is a noted global warming skeptic. He told The Daily Caller that recent weather extremes are largely a function of natural factors, including sun and ocean cycles and high-latitude volcanoes.
“[W]e forecast the recent record snows, droughts, floods, tornadoes and a landfalling hurricane on the East Coast weeks to months in advance based on those natural factors,” he explained. “We had similar conditions and extremes in the early 1800s, early 1900s, 1930s-1960s. The last few decades were benign because of the opposite states of these same factors.”
Meteorologist Art Horn, another global warming skeptic, said that in the past few years La Nina, a pattern of low solar activity and high pressure areas, has had a large effect on weather. “Extreme,” he said, is a subjective term that reflects more on the people making the claims than on any actual weather event.
“The weather is more active at times and less active at other times,” Horn told TheDC. “The claim that the October snowstorm was caused by global warming says more about the lack of historical knowledge of past weather events by the person making the claim than it does anything else.”
D’Aleo added that computer models of the greenhouse effect have not been accurately forecasting the actual emerging data."Greenhouse computer models are failing on every count - they forecast warming winters - the last decade the US winter temperatures have cooled 4.13F,” he wrote in an email. “[S]ea level rises accelerating up - they have fallen the last two years. See NOAA NCDC data analyzed here; they forecast building ocean heat content especially in the tropics (the heat content has not increased).”
“They forecasted an atmospheric hot spot over the low and middle latitudes in the atmosphere. It is not there,” D’Aleo added.
Former NASA scientist and University of Alabama in Huntsville climatologist Roy Spencer took issue with “Hurricane” Schwartz’s characterization of the winter storm as a function of global warming.
“His claims are just plain silly, for two reasons. First, he’s like a person who just won the lottery, claiming, ‘The chance of winning is microscopically small! The whole world must be winning the lottery!’ Well, unusual weather somewhere in the world is pretty common.
“Secondly, there is no way for more snowstorms and colder winters to be part of global warming theory, which predicts just the opposite.”
According to Spencer, Philadelphia has been experiencing natural climate variability which is likely a function of natural climate phenomena and “plain old bad luck”.
Bob Webster, Vero Beach
Letter: Story asserting reversal by climate skeptic omits important facts
The Associated Press is at it again. More bias masquerading as news.
A story headlined, “Prominent skeptic says he now believes global warming is real,” is another example of the AP propagandizing.
First, it is debatable whether it would be appropriate to characterize professor Richard Muller as a “prominent skeptic.” I’ve followed climate and weather for more than five decades and own an extensive library of books and online material devoted to claims of human-caused global warming. None of those resources, including “The Deniers” and “Shattered Consensus,” featuring interviews and essays from prominent scientific skeptics, contain his name.
Second, Muller’s claim first came to light in a piece he wrote for The Wall Street Journal he titled, “Cooling the Warming Debate,” based on data from the Berkeley Earth Surface Temperature project. Wall Street Journal editors changed it to “End of Skepticism,” and Muller was not happy with the change because it misrepresented his position. In fact, he takes no position on the cause of claimed warming. You wouldn’t know that from the AP story.
Third, the AP article concluded by repeating the unsupportable claim that an “overwhelming majority of climate scientists” attribute late 20th century warming to burning fossil fuels. That claim is pure rubbish simply tacked onto the Muller story. Neither Muller nor the Berkeley Earth Surface Temperature project made any claim about the cause of climate change that most scientists consider normal variability.
Finally, one of Muller’s BEST project co-authors, well-known distinguished climate researcher professor Judith Curry, chair of the Department of Earth and Atmospheric Sciences at Georgia Tech, stated Muller’s claim was a “huge mistake” and had no scientific basis. Curry accused Muller of failing to note that the BEST data showed global warming stopped a decade ago.
Please stick to the facts, AP.
By Joseph D’Aleo, CCM, Weatherbell Analytics
The media and warmists in the enviro and academic community have been troubled by the lack of warming the last decade. And Dr. Spencer shows it is in free fall again in October and early November.
The winters have been especially concerning (PDF) with US winters cooling 4.13F the last decade with cooling in every climate region.
They have latched onto extreme events as proof their climate change thesis. Again these journalists (the term is a stretch nowadays) and global warming scientists have no sense of history.
NBC’s Brian Williams in a special report after the Snowtober storm in the northeast said he did not remember weather like this when he grew up. Brian Williams grew up in Elmira, NY, born in 1959 so was a child during the snowy 1960s. He missed the hurricanes of the 1950s although his family lived in New Jersey then. He was a child when the tornado outbreaks of the 1960s and 1970s occurred and was likely in college (where his 18 college credits from Catholic University in DC likely did not include science) while he interned for Jimmy Carter’s administration when the great winters from 1976-1979 occurred.
NOAA has compiled a list of the most impactful eastern snowstorms since 1956 (NESIS). The 1960s is still the most prolific decade even after the flurry of major snows in recent years (something the IPCC, the Union of Concerned Scientists and other advocacy groups said would be become rare not increase)
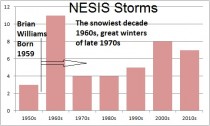
His $10 million a year salary doesn’t help his memory much I guess or he is one of many people just oblivious to weather.
The 1930s had the greatest most widespread heat and drought, the 1930s to 1950s the most hurricanes, the 1950s to 1970s the most significant tornado outbreaks. There have always been floods and droughts - no trend has been found in either. A new study conducted by federal scientists found no evidence that climate change has caused more severe flooding in the United States during the last century. The U.S. Geological Survey (USGS) study - titled “Has the magnitude of floods across the USA changed with global CO2 levels” - found no clear relationship between the increase in greenhouse gas emissions blamed for climate change and the severity of flooding in three of four regions of the United States.
A draft UN report three years in the making concludes that man-made climate change has boosted the frequency or intensity of heat waves, wildfires, floods and cyclones and that such disasters are likely to increase in the future.
Never mind that all the previous model based forecasts are failing. Temperatures instead of accelerating have flatlined, sea level is falling not rising, snow is increasing not diminishing, the winters are becoming colder not warmer, the global hurricane ACE index is near a 30 year low and on and on.
But lets come back to what we expect to happen. We believe the earth’s climate though locally influenced by man is controlled on the larger scale by changes in solar activity, by decadal oscillations in the oceans and volcanism (even moderate high latirtude ones).
Now in their effort to explain away why warming and sea level rises stopped even as CO2 continued to rise, they are discovering cycles.
“What’s really been exciting to me about this last 10-year period is that it has made people think about decadal variability much more carefully than they probably have before,” said Susan Solomon, an atmospheric chemist and former lead author of the United Nations’ climate change report, during a recent visit to MIT. Though they use these cycles to explain the lack of warming or the cooling the last decade, don’t expect them to to give any credit to them for the warming from 1977 to 1998.
What is ahead...well more extremes but not because of CO2 but because extremes occur when the Pacific is cold and Atlantic warm and when the sun is less active, all currently in progress.
Let me reprise what I wrote in early June about the La Nina relationship to extreme weather.
Would You Believe La Ninas Often Hurt the Economy More Than El Ninos?
There have been great extremes of weather in the last few years. Although many environmentalists and their supporting cast in the media want to blame green house gas related climate change, they are only partially right. Climate is changing…always has and always will. The only constant in nature is change.
The kind of extremes we have experienced are related to a climate change to a cooling planet after a warming period, both associated with 60 year cycles in weather related to multidecadal cycles on the sun and in the oceans.
The last time we underwent such a cooling from the 1950s to 1970s, we had a similar combination barrage of extreme weather with drought, snowstorms, bitter winters, spring tornadoes and floods and hurricanes.
Some of you may remember, in the 1980s and 1990s, before the media’s favorite weather topic was climate change or global warming, it was all El Nino. It was blamed for virtually any weather event that occurred in El Nino years. It is true that El Ninos when strong are capable of producing losses that can total in the billions of dollars. El Ninos are feared in places like Indonesia, Australia, India, Brazil, Mexico, and parts of Africa where devastating droughts are possible. In the United States, southern states from California to Florida are vulnerable to damage from a barrage of strong winter storms.
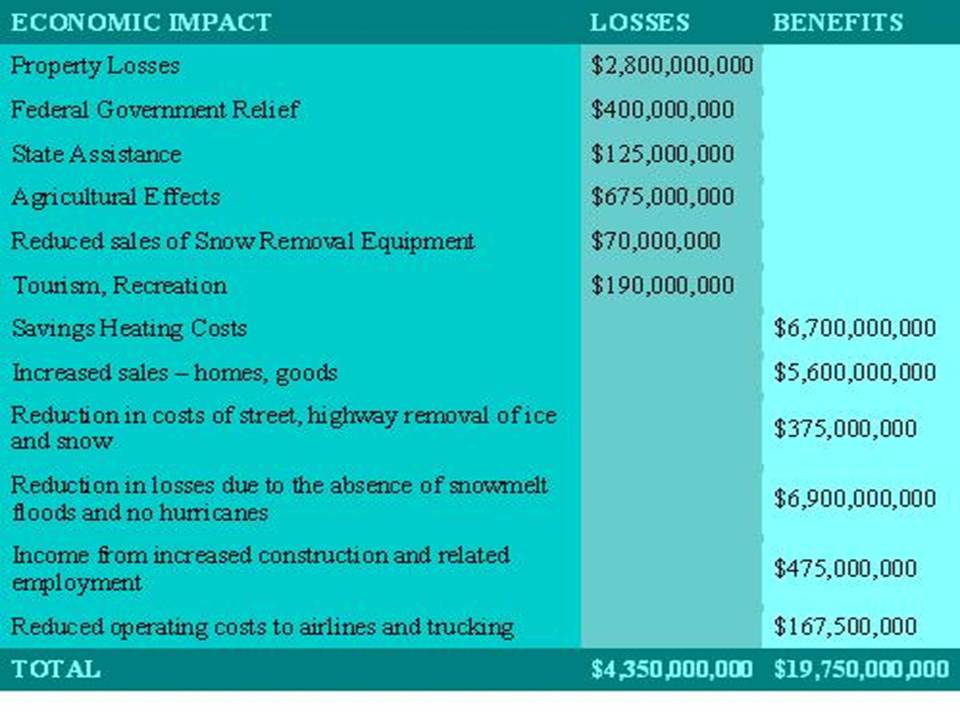
Here in the United States, the El Nino of 1997/98 played a role in 18 President declared disasters with a total damage exceeding $4 billion.
However, the patterns of weather associated with strong El Nino events also produce many very positive effects and benefits.
For example, the milder temperatures of most strong El Nino winters in the interior northern United States reduce heating costs for both homes and industry and the operating costs for transportation both by air and on land. Less snowfall in the north lowers the costs of snow removal for government and industry, and enables the construction industry to work more during the winter months. Shoppers are able to get to and from stores more easily and often and retail sales benefit. El Nino also typically results in less flooding during the spring and fewer hurricanes in the summer.
Stan Changnon, former head of the Illinois State Water Survey in the Bulletin of the American Meteorological Society in September, 1999 estimated the economic gains and losses during the great El Nino of 1997/98. He showed that the benefits were much greater than the losses.
LA NINAS ON THE OTHER HAND…
In La Nina, the picture is very different from that of El Nino. When periodic outbreaks of extreme cold weather and snow occur across the northern states, the costs of heating, snow removal, fuel for airline and trucking industries can become at least regionally significant. As snowstorms hit northern areas and snow and ice storms occur across the south or east, business may be shut down for days with major effects on commerce. Retail sales may be down due to travel difficulties. Construction work will be hampered with delays and loss of employment.
Also in La Ninas, losses from springtime flooding and from droughts and hurricanes typically are much greater than normal. Flooding in La Nina years averages nearly $4.5 billion compared to an average of $2.4 billion. We have already seen examples of that in 2008 and 2009 in Missouri and Arkansas and this year in the Ohio, Mississippi (worst since 1927), Champlain and now Missouri River Valleys.
Major tornado outbreaks occurred in January 1999 in Arkansas and Tennessee and in May in Oklahoma and Kansas with $2.3 billion in damages. And of course the super tornado outbreak of April 1974 with its 148 tornadoes that left 315 dead and 500 injured occurred during a very strong La Nina. And in the la nina year of 1967, there was the Palm Sunday outbreak. In 2008, we set a record for tornadoes in May, this year in April. The outbreaks this year focused more on the major urban centers with greater resulting damage and death toll.
A major heat wave and drought in the strong La Nina of 1988 caused an estimated $40 billion in damage or losses (mostly agricultural) in the central and eastern United States. 2010’s summer La Nina brought record heat like 1988 but not the drought because the winter had been so snowy and wet and the soils saturated. This winter and spring drought in the southern plains is very costly. In Texas it was the third worst May drought behind only 1918 and 1956.
Hurricane related losses in La Nina years, averages $5.9 billion compared to an all year average of $3 billion. In fact, most all the major east coast hurricanes have been in La Nina years especially those with a warm Atlantic as we have currently.
SOME BENEFITS TOO
On the other hand, the winter sports industry may benefit in the west and north from increased snowfall. The last three La Nina years have been boon years Though the northern tier pays more for energy costs with cold winters and the occasional hot summer, many others save on their energy bills. This past winter was unusually cold in Florida in December into January but spring warmth followed early.
Warmer than normal temperatures in the big cities of the east and south in most La Ninas may save consumers there billions through reduced heating costs. Tourism in ‘escape’ destinations like Florida and California is usually up. Sales of snow removal equipment and winter clothing are also higher in the north and west.
But unlike El Ninos, the benefits are often dwarfed by the losses.
TIES TO THE PACIFIC DECADAL OSCILLATION
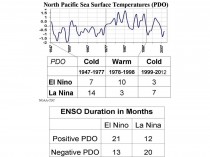
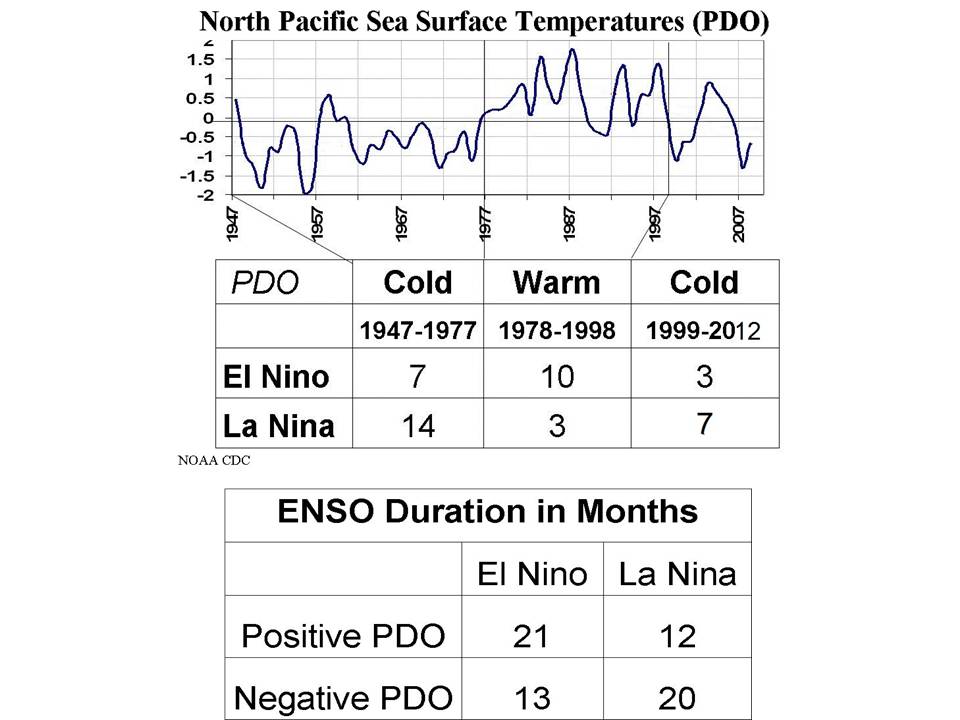
The frequency of both El Ninos and La Ninas is tied to the PDO. When the PDO is warm (positive) more El Ninos are favored and when negative La Ninas. The PDO phases average about 25-30 years in length. Though the PDO is a measure of conditions from 20N to the North Pacific, it turns out that warm water is favored in the tropics during the warm phase and cool water in the cool phase. This is what predisposes the Pacific towards an El Nino or La Nina state.
It appears the PDO which flirted with a change to negative in the late 1990s has returned solidly to a negative cold regime state. This is consistent with the 25-30 year phase length as the last shift called the Great Pacific Climate Shift occurred around 1977. If indeed it stays there this time, we can expect more La Ninas like this one in the years ahead just as we found in the last cold phase from 1947 to 1977. If that is the case and we see more La Ninas like this year, look for
(1) With more La Ninas than El Ninos, declining global temperatures especially as the Atlantic cools and during quiet solar periods or when volcanism increases
(2) More cold and snow across the northern tier from the Pacific Northwest and Northern plains to the Great Lakes and New York and New England. Ice storms are also more frequent on the southern end of the snow bands. they can be just as devastating as the early heavy snowstorm before the deciduous trees shed their leaves the last week. Recall 1973, 1974, 1997, 2008 for some recent examples in the northeast.
(3) Western snowpack increases. Scientists have measured new ice in Montana’s Glacier National Park and atop Colorado’s Front Range mountains. In northwest Wyoming, there is photographic evidence of snowfield growth after Bob Comey, director of the Bridger-Teton National Forest Avalanche Center, compared photos of peaks from year to year. His images taken before snow started falling again this autumn show what appears to be significantly more ice in the Teton Range compared with two years ago. Last spring, record snow depths and avalanches around Jackson Hole gave way to concern about possible flooding, but fairly cool weather kept much of the snow right where it was. The flooding that did occur, at least in Wyoming, was less severe than feared. “I’ve never seen a season with a gain like we’ve seen this summer,” Comey said.
(4) More winters with below normal snow Mid-Atlantic south. The occasional one year El Ninos will bring heavy snows to the south and east and be colder than the El Ninos in the warm PDO
(5) More late winter and spring floods from spring storms and snowmelt
(6) Dry winters and early springs in Arizona, Texas and Florida with spring brush fires and dust storms in the desert
(7) More tornado outbreaks and stronger tornadoes in the spring months with focus from the western Gulf to Missisissippi and Ohio Valley instead of Tornado Alley.
(8) More Atlantic hurricanes threatening the east coast from Florida north, especially as long as the Atlantic stays warm (Atlantic usually lags up to a decade or so after the Pacific in its multidecadal cycles).
(9) Greater chances of winter and following growing season drought in the major growing areas especially when La Ninas come on after an El Nino winter
SUMMARY
Some extremes of weather have been increasing even as the earth cools. But the causes are natural. La Ninas produce more winter cold and snows, more severe weather from fall through spring, more springtime flooding and summer droughts and heat waves, enhanced landfall hurricane threats with greater economic impact and declining global temperatures. Given the flip of the Pacific Decadal Oscillation to the cold mode which favors more La Ninas like this one, we may be looking back at recent decades when El Ninos dominated as the good old days when weather was unusually benign and favorable.
Please join us at weatherbell.com for daily posts by Joe Bastardi and I on forecast weather and climate. We forecast the devastating wet snowstorm’s effects many days in advance. JB appeared on FOX Business last Thursday to alert the viewers to devastating power outages. We had forecast the drought in the south, the floods in the north and Ohio/Mississippi Valleys, the tornado outbreaks, a landfalling hurricane on the east coast (even forecast NYC as target). Join us and see what we have in mind for global weather this upcoming winter (summer southern hemisphere).
By Roger Pielke Sr.
A news article appeared today titled
‘Snowtober’ fits U.N. climate change predictions
The article starts with the text
While the Northeast is still reeling from a surprise October snowstorm that has left more than a million people without power for days, the United Nations is about to release its latest document on adaptation to climate change.
The report from the Intergovernmental Panel on Climate Change is expected conclude that there is a high probability that man-made greenhouse gases already are causing extreme weather that has cost governments, insurers, businesses and individuals billions of dollars. And it is certain to predict that costs due to extreme weather will rise and some areas of the world will become more perilous places to live.
The historic snowstorm in the northeast United States a few days ago was due to an unusually far south Polar jet stream for this time of the year, and colder than average temperatures associated with the east coast storm. To claim that this event fits with the IPCC climate change predictions is ridiculous. The article reads as an op-ed in the guise of a news article.
Steve Goddard responds:
Here are the actual IPCC forecasts
2001 15.2.4.1.2.4. Ice Storms: “Milder winter temperatures will decrease heavy snowstorms” IPCC Draft 1995
And from the east coast - New York Times shrinking snow cover in winter.
----------------
The CO2 greenhouse warming theory is flawed. Not only has warming stopped in the atmosphere and ocean but the oceans can absorb readily anything we throw into the air. CO2 is a trace gas already. the oceans have an infintite capacity to remove it from the air when coolling accelerates.
Also note how in this experiment, Geologist Tom Segalstad shoots down the long lifetime for atmospheric CO2 assumed by the IPCC and their tinkertoy climate models.
An eloquent experiment by geologist Tom Segalstad, dramatic proof of the rapid absorption of CO2 by water. The calcium carbonate touch is inspired!
Segalstad explains:
This video shows that a candle floating on water, burning in the air inside a glass, converts the oxygen in the air to CO2. The water rises in the glass because the CO2, which replaced the oxygen, is quickly dissolved in the water. The water contains calcium ions Ca++, because we initially dissolved calcium hydroxide Ca(OH)2 in the water. The CO2 produced during oxygen burning reacts with the calcium ions to produce solid calcium carbonate CaCO3, which is easily visible as a whitening of the water when we switch on a flashlight. This little kitchen experiment demonstrates the inorganic carbon cycle in nature.
The oceans take out our anthropogenic CO2 gas by quickly dissolving it as bicarbonate HCO3-, which in turn forms solid calcium carbonate either organically in calcareous organisms or precipitates inorganically. The CaCO3 is precipitating and not dissolving during this process, because buffering in the ocean maintains a stable pH around 8. We also see that CO2 reacts very fast with the water, contrary to the claim by the IPCC that it takes 50 - 200 years for this to happen. Try this for yourself in your kitchen! (OR CLASSROOM).
Greenpeace Exposed!
October 31, 2011 11:36 A.M. By Greg Pollowitz
The Consumers Alliance for Global Prosperity has a new video out exposing Greenpeace and how Greenpeace’s environmentalism actually hurts the developing world. I don’t know who they got to do the voice in the vid, but he’s pretty scary. Perfect for Halloween today. Enjoy:
----------------------------
You Cannot have it Both Ways
By Harold Ambler

I spent 25 years of my life worried about global warming. And one of the best proofs that the scientists and the media both had to keep me convinced was warmer winters, with less snow. Al Gore talked about it. Robert F. Kennedy Jr. wrote about it. Dozens of scientists published papers showing that winters were getting warmer, with less snow.
Well, in the midst of this kind of certainty about warmer winters, with less snow, some scientists, among them a Russian named Habibullo Abdussamatov, dared to question the idea that warmer winters, with less snow, were caused by carbon dioxide in the first place and also questioned whether Earth would continue to warm during the next few decades.
Abdussamatov and the rest of the skeptical scientists were widely ridiculed, even condemned. Corrupt, sub-human, blind, people called them. And worse.
They were none of these things.
Then, a funny thing started happening a couple of autumns ago. First, significant early-season snow events began to materialize during fall. Second, winters in the Northern Hemisphere started to show characteristics of the winters that Al Gore and RFK Jr. said they missed so much.
But now, in our era of terror of weather, the return to colder winters, with more snow, has been twisted by the same people who missed the colder winters, with more snow, of their youth. These new cold winters, with more snow, were not evidence of natural climate cycles, they said. The snow was, in fact, caused by global warming. This is what they said. And I have to believe that it is what they meant.
But it cannot continue. The science claiming that the unfolding transition to colder winters, with more snow, is proof of global warming is bad science. And turning an entire generation of people into nature-fearers is a grave sin.
The ocean-atmosphere system did not used to sit in benevolent stasis. Sea level did not used to remain ever stable. Droughts are not a product of modernity, and they are not increasing in number. And early-season snowstorms like the one unfolding in the Northeast were never proof of global warming. Not when they happened in the past, and not now.
To Mr. Gore, and his still passionate supporters, I say this: You cannot have it both ways. You cannot count the absence of snow as proof of your theories and the presence of snow as the proof of your theories.
We’re smarter than that. And you’re going have to do better, if you wish to win this debate.
See post here.
Halloween is this weekend or Monday. Already before Halloween, two snowstorms have hit the east bringing record October snows. New York City’s snow is greatest for October since records began in 1869.
The excuse they used the last few years was that the snow and cold was the result of strong blocking high pressure in the arctic pushing cold air south. Well that is NOT currently hapoening. So how does one explain the cold and snow??? Or the fact that winters have cooled 4.13F the last decade for the lower 48 states. Every region has cooled.
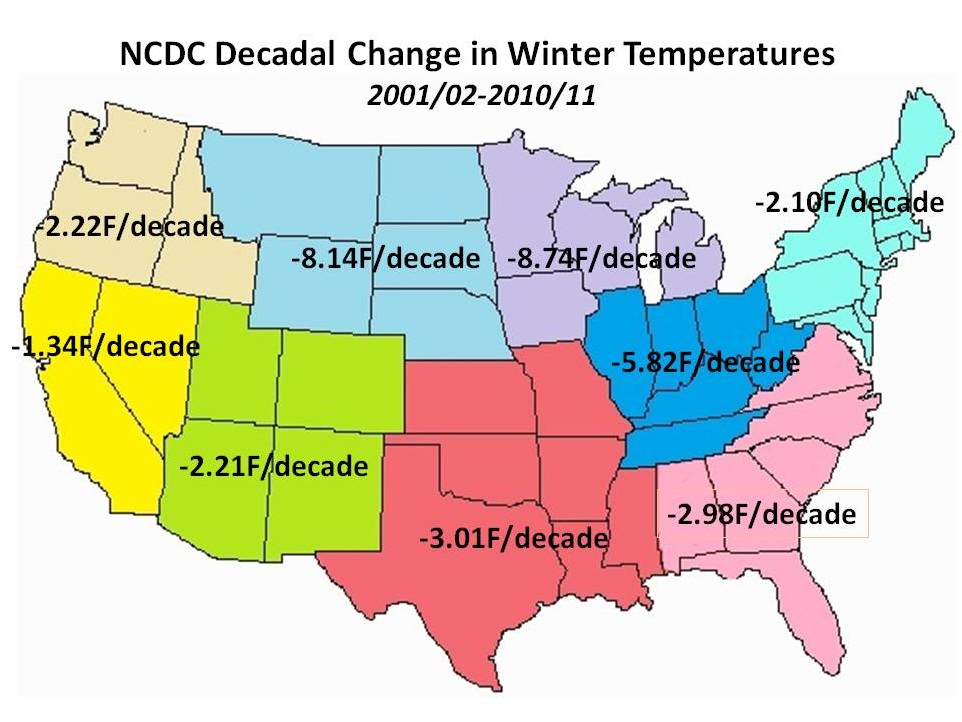

PDF of all regions.
By Roger Pielke Jr., Roger Pielke Jr.’s Blog
Here is another good example why I have come to view parts of the climate science research enterprise with a considerable degree of distrust.
A paper was released yesterday by PNAS, by Stefan Rahmstorf and Dim Coumou, which asserts that the 2010 Russian summer heat wave was, with 80% probability, the result of a background warming trend. But if you take a look at the actual paper you see that they made some arbitrary choices (which are at least unexplained from a scientific standpoint) that bias the results in a particular direction.
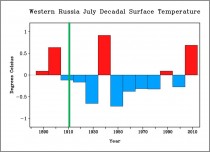
Look at the annotated figure above (enlarged), which originally comes from an EGU poster by Dole et al. (programme here in PDF). It shows surface temperature anomalies in Russia dating back to 1880. I added in the green line which shows the date from which Rahmsdorf and Coumou decided to begin their analysis—1911, immediately after an extended warm period and at the start of an extended cool period.
Obviously, any examination of statistics will depend upon the data that is included and not included. Why did Rahmsdorf and Coumou start with 1911? A century, 100 years, is a nice round number, but it does not have any privileged scientific meaning. Why did they not report the sensitivity of their results to choice of start date? There may indeed be very good scientific reasons why starting the analysis in 1911 makes the most sense and for the paper to not report the sensitivity of results to the start date. But the authors did not share that information with their readers. Hence, the decision looks arbitrary and to have influenced the results.
Climate science—or at least some parts of it—seems to have devolved into an effort to generate media coverage and talking points for blogs, at the expense of actually adding to our scientific knowledge of the climate system. The new PNAS paper sure looks like a cherry pick to me. For a scientific exploration of the Russian heat wave that seems far more trustworthy to me, take a look at this paper.