


By Joseph D’Aleo
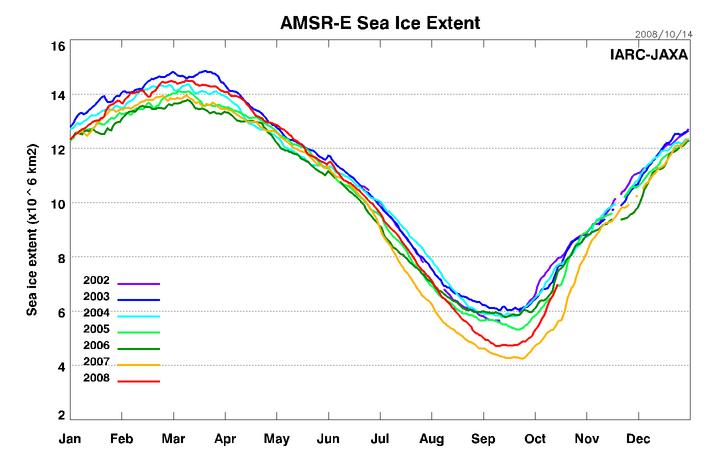
As Anthony Watts blogged last week, the arctic ice is increasing at a very rapid rate. You can see how we fell short of last year’s record extent and have recently been rebounding at the fastest rate of the years shown. October 18 UPDATE: Now we are running 31.3% ahead of last year. 10/17/2007 5,663,125 square kilometers, 10/17/2008 7,436,406 square kilometers.

See larger image here
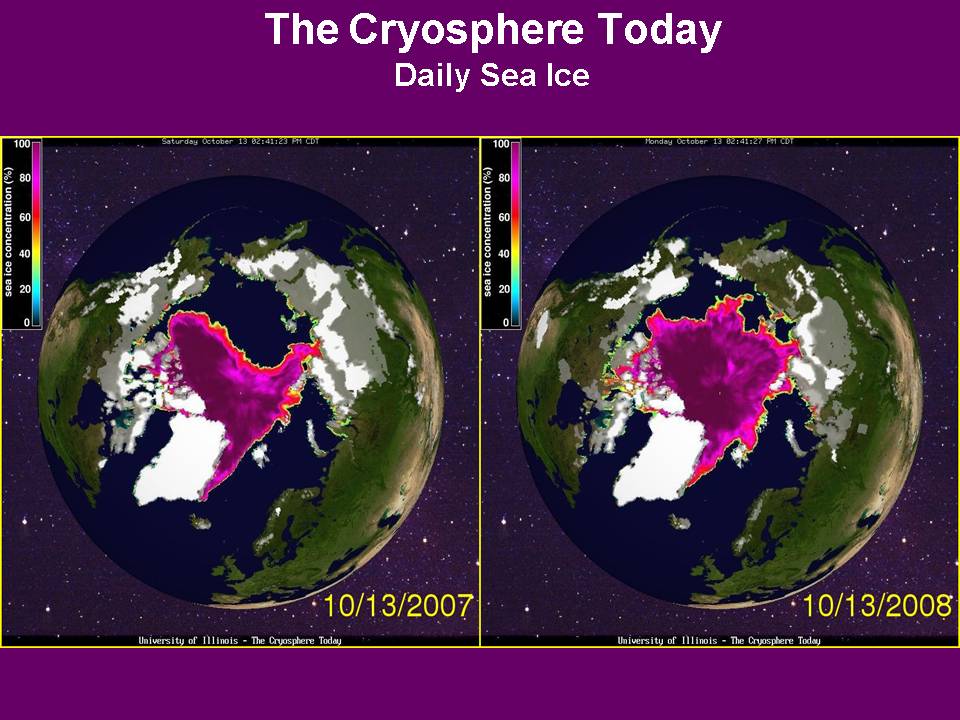
Hans LaBohm points out the side by side comparison is dramatic between this date last year and this year.

See larger image here
According to this Tom Nelson blog, the Arctic sea ice extent was now 27% GREATER than last year as of October 15, 2008.
The recent enhanced warm season melting of the arctic ice has precious little to do with greenhouse gases but is a cyclical phenomena related to multidecadal cycles in both the Atlantic and the Pacific. The Atlantic appears to be the most important. The Atlantic has been in its warm mode since 1995 with a peak around 2004 and 2005. Warm water from the Atlantic makes its way into the arctic through the Barents Sea and the Pacific through the Bering Strait.
Last year before the alarmists took control, the University of Colorado’s National Snow and Ice Data Center (NSIDC) summarized the role of the ocean cycles very well in October 2007 in this way:
“One prominent researcher, Igor Polyakov at the University of Fairbanks, Alaska, points out that pulses of unusually warm water have been entering the Arctic Ocean from the Atlantic, which several years later are seen in the ocean north of Siberia. These pulses of water are helping to heat the upper Arctic Ocean, contributing to summer ice melt and helping to reduce winter ice growth. Another scientist, Koji Shimada of the Japan Agency for Marine–Earth Science and Technology, reports evidence of changes in ocean circulation in the Pacific side of the Arctic Ocean. Through a complex interaction with declining sea ice, warm water entering the Arctic Ocean through Bering Strait in summer is being shunted from the Alaskan coast into the Arctic Ocean, where it fosters further ice loss. Many questions still remain to be answered, but these changes in ocean circulation may be important keys for understanding the observed loss of Arctic sea ice.”
Note Rutger’s Jennifer Frances found a similar relationship between Arctic ice and Atlantic water temperatures. Ignore the comment in the ‘abstract’ that the ocean changes are ‘consistent’ with greenhouse warming as we have seen the ocean changes are cyclical and predictable and quite natural. Dr. Willie Soon also found a strong correlation with solar irradiance which may ultimately drive these ocean cycles of warming and cooling.
With a cooling of the Pacific and a less warm North Atlantic and a long, deep solar minimum, the ice should continue to rebound in the next few years. Read more on the arctic and Greenland here.
By Roger Pielke Sr., Climate Science
In his latest post, Roger reports that Dr. Richard Keen of the Department of Atmospheric and Oceanic Sciences (ATOC) at the University of Colorado has a very interesting set of questions that he has posted with respect to global warming. It can be viewed here.
His class website, which illustrates his expertise in atmospheric science. His global warming quiz is quite informative.
Climatologist Dr. Richard Keen is a lecturer in the Department of Atmospheric and Oceanic Sciences at the University of Colorado, a member of the American Meteorological Society and has worked with the National Center for Atmospheric Research. Keen specializes in volcanic aerosols and climate change studies and wrote the book ”Skywatch: The Western Weather Guide.”
According to Keen, global warming ranges between a “minor inconvenience that’s overblown” or “nothing - it doesn’t exist” or “a good thing.” “Earth has cooled since 1998,” Keen noted, “in defiance of the predictions by the UN-IPCC.” According to Keen, “The global temperature for 2007 was the coldest in a decade and the coldest of the millennium.” After noting the recent cooling temps, Keen wrote “which is why ‘global warming’ is now called ‘climate change.’” Keen also pointed out that the most Antarctic sea ice on record was recorded in 2007 and then he rhetorically asked: “Did you see [that fact] reported in the news?” Keen’s quiz also showed that 10 out of 11 “wacky weather” events occurred in the U.S. before 1957.
Wacky Weather: When did most of the following events occur?
1. Alaskan glaciers melt at the rate of 1 mile per year 1900
2. Alaska bakes at 100 degrees north of the Arctic Circle 1915
3. North Dakota bakes at 120 degrees 1936
4. Hurricane hits Boston with Category 5 winds (180 mph) 1938
5. Hurricane kills half the population of a large southern city Galveston 1900
6. Hurricane destroys most of Los Angeles 1839
7. Half a dozen hurricanes hit the East Coast of the US 1954-1955
8. A dozen tornadoes strike Los Angeles 1983
9. A major US city hit by a hurricane, tornado & earthquake Charleston 1886
10. U.S. warmest year ever; 20 states set new all time heat records 1934
11. Greenland warms - Farmers raise crops and brew beer 1000 A.D.
By Carl Wunsch, MIT et al. in Journal of Climate
Abstract:
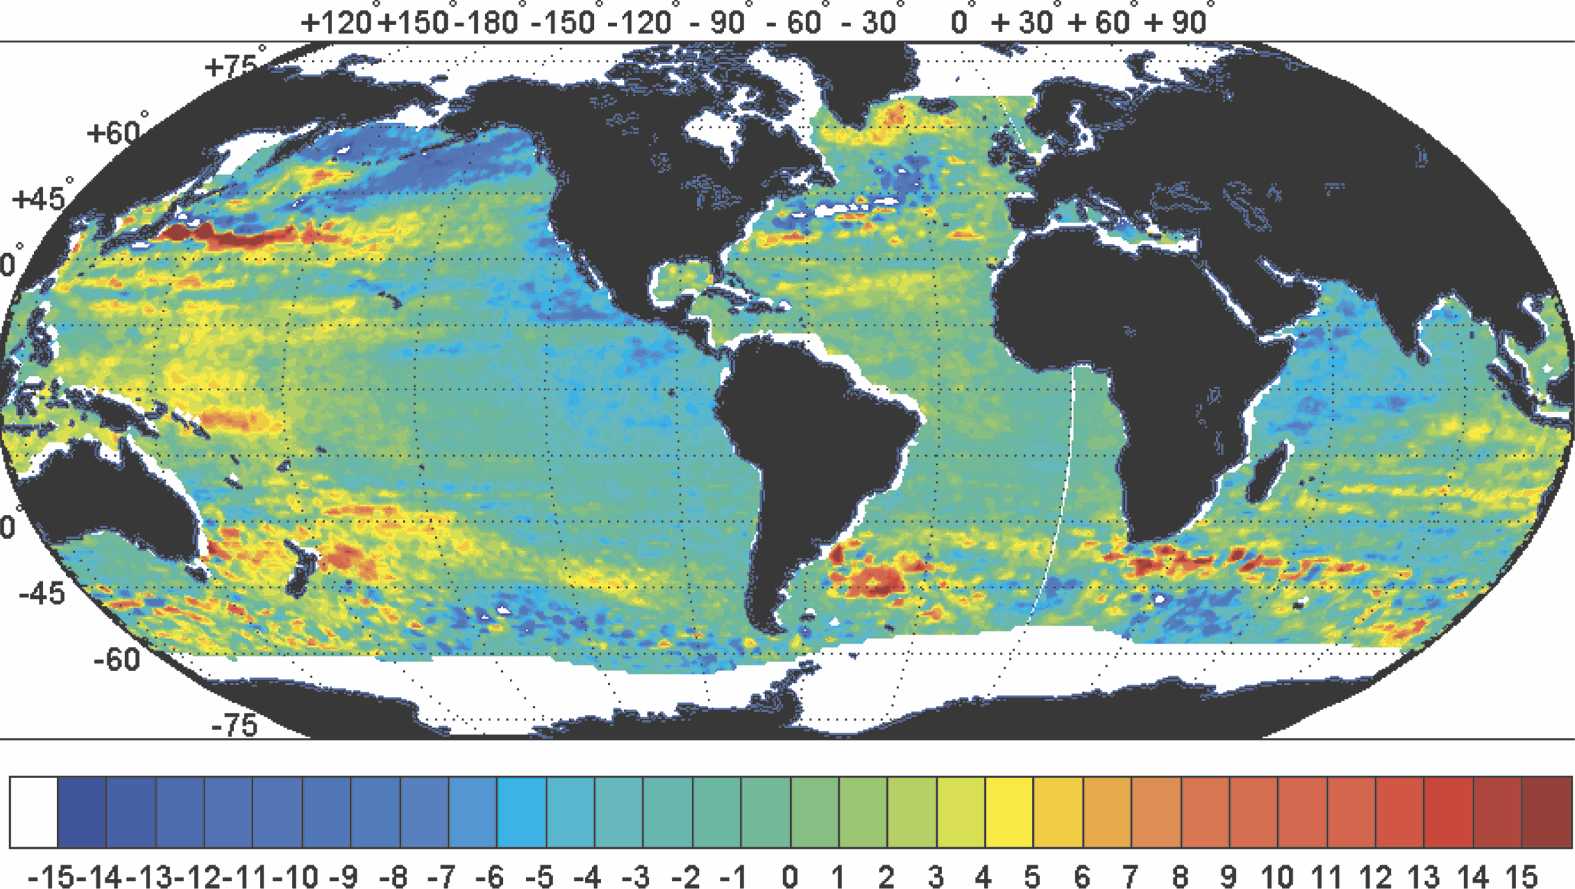
Estimates of regional patterns of global sea level change are obtained from a 1 degree horizontal resolution general circulation model constrained by least squares to about 100 million ocean observations and many more meteorological estimates during the period 1993-2004. The data include not only altimetric variability, but most of the modern hydrography, Argo float profiles, sea surface temperature, and other observations. Spatial-mean trends in altimetric data are explicitly suppressed to isolate global average long-term changes required by the in situ data alone.
On large scales, some regions display strong signals although few individual points have statistically significant trends. In the regional patterns, thermal, salinity, and mass redistribution contributions are all important, showing that regional sea level change is tied directly to the general circulation. Contributions below about 900 m are significant, but not dominant, and are expected to grow with time as the abyssal ocean shifts. Estimates made here produce a global mean of about 1.6 mm/yr, or about 60% of the pure altimetric estimate, of which about 70% is from the addition of freshwater.
Interannual global variations may be dominated by the freshwater changes rather than by heating changes. The widely quoted altimetric global average values may well be correct, but the accuracies being inferred in the literature are not testable by existing in situ observations. Useful estimation of the global averages is extremely difficult given the realities of space-time sampling and model approximations. Systematic errors are likely to dominate most estimates of global average change: published values and error bars should be used very cautiously.
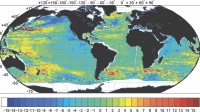
Twelve-year (1993-2004) trend in sea level (mm yr/1; updated from CN2004) as determined directly from the TOPEX/Poseidon altimetric data. See larger image here.
From Conclusion:
At best, the determination and attribution of global mean sea level change lies at the very edge of knowledge and technology. The most urgent job would appear to be the accurate determination of the smallest temperature and salinity changes that can be determined with statistical significance, given the realities of both the observation base and modeling approximations. Both systematic and random errors are of concern, the former particularly, because of the changes in technology and sampling methods over the many decades, the latter from the very great spatial and temporal variability. It remains possible that the database is insufficient to compute mean sea level trends with the accuracy necessary to discuss the impact of global warming - as disappointing as this conclusion may be. The priority has to be to make such calculations possible in the future. See pdf from MIT here.
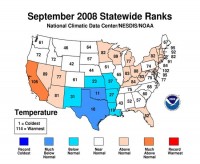
September 2008 was the 49th warmest and 38th wettest on record for the contiguous United States, according to an analysis by NOAA’s National Climatic Data Center in Asheville, N.C., based on records dating back to 1895.
California had its 10th warmest September, while Texas had its 10th coolest September on record. The southern United States experienced its 11th coolest September on record, with an average temperature of 71.7 degrees F, 2.6 degrees below the 20th century mean.
See larger image here
Based on NOAA’s Residential Energy Demand Temperature Index, the contiguous U.S. temperature-related energy demand (primarily cooling degree days) was 1.7 percent below average in September.
The United States measured below-average precipitation in areas west of the Rockies, and from Florida to Kentucky. However, the remnants of hurricanes Gustav, Hanna and Ike brought above average precipitation from Louisiana to Michigan and throughout the Northeast.
California had its driest September on record, with an average of just 0.01 inch of precipitation - 0.45 inches below the 20th century average. Kentucky, Florida, Georgia, Nevada and Tennessee had one of their driest Septembers on record.
Arkansas, Connecticut, Illinois, Louisiana, Maine, Massachusetts, Michigan, Missouri, New Hampshire, and Rhode Island experienced one of their 10 wettest Septembers on record.

See larger image here
Gustav, Hanna and Ike made landfall in the United States in September. Gustav struck as a Category 2 storm near Cocodrie, La. on September 1. Hanna came ashore near Myrtle Beach, S.C. as a tropical storm on September 6 and moved northeast along the Atlantic coast. Hurricane Ike made landfall at Galveston, Texas on September 13 as a Category 2 storm.
Wildfire activity was well below average across the United States in September. See full release here.
By Paul Chesser, Climate Strategies Watch
The Center for Climate Strategies and their fellow economic holocaust deniers in North Carolina continued their shenanigans this week as they formally released 56 recommendations to create artificial green jobs at the expense of useful ones. The state’s Climate Action Plan Advisory Group (CAPAG—sounds like some kind of garment, doesn’t it? “That’s one ugly CAPAG you’re wearing!") posted its final report this week, which is not dissimilar to what they’ve done with other state climate commissions.
What is different with North Carolina, as opposed to the other states, is that CCS went out of their way to go to an outside entity—Appalachian State University’s (should be called “Alternative") Energy Center—to conduct an additional economic analysis of their recommendations. The reason for this is obvious: my colleagues at the John Locke Foundation” have pounded away for over a year at CCS’s/CAPAG’s willful disregard for current climate science and trends; their absurd economic claims; and their suspect changing of numbers, seemingly on a whim. It got so bad that CCS felt the need to shore up their credibility by overhauling the personnel page on their Web site to emphasis more economics credentials.
Anyway, CCS subcontracted the Energy Center to put lipstick on their pig, and the ASU gang used a distinctly rosy shade (PDF) in doing so.

Here’s what the swine left on the CAPAG collar: a projection that the state would realize 15,000 new jobs, $565 million in “employee and proprietor income,” and $302 million in gross state product by 2020. Compare that to what the Beacon Hill Institute, who analyzed CAPAG’s recommendations for the Locke Foundation earlier this year, found: “By 2011, the state would shed more than 33,000 jobs, annual investment would drop by about $502.4 million, real disposable income by more than $2.2 billion, and real state Gross Domestic Product by about $4.5 billion.” So I guess the question boils down to, whose analysis do you believe: a political science graduate student’s or PhD economists’? Read more here.
A similar story is going on in many states including my home state of New Hampshire where the Governors’ NHDES committee without any real climatologist input (just the ravings of an unqualified Union of Concern Scientists alarmist) will be advancing their final plans tomorrow. They too promise nothing but benefits with plenty of green jobs and revenue, when in reality the hard working citizens may find themselves like many other states hurt by government intervention just as they have been with the federal government intervention in the banking and housing markets. The state has forgotten that New Hamsphire license plates have the slogan “live free or die”.
By Jennifer Marohasy, Politics and Environmental Blog
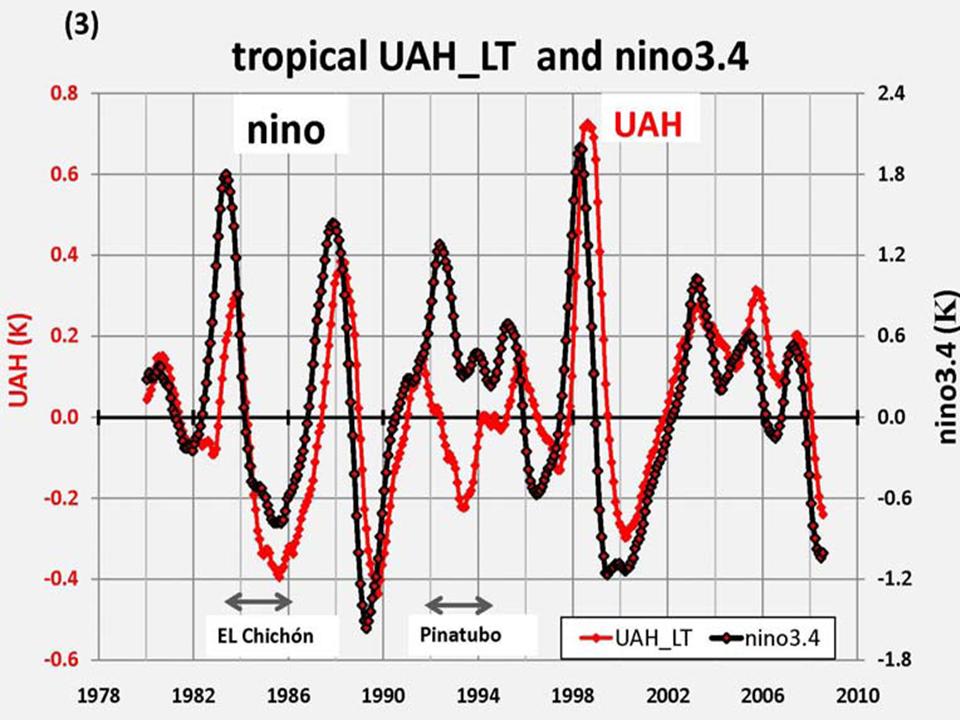
The Intergovernmental Panel on Climate Change (IPCC) has stated that: Most of the observed increase in global average temperatures since the mid-20th century is very likely due to the observed increase in anthropogenic greenhouse gas concentrations, mainly carbon dioxide. This conclusion is based on output from global climate computer models known as General Circulation Models (GCM). David Douglass and John Christy, in a paper recently accepted for publication and already available on the internet, have come to a different conclusion. By considering observed, as opposed to modelled, temperature changes and at different latitude bands they conclude that:
1. El Nino and La Nina effects in the tropics have a more significant affect on global temperature anomalies than carbon dioxide, in particular it was an El Nino event that drove the 1998 global temperature maximum.

See larger image here
2. Variations in global temperatures since 1978 have mostly been due to climate effects in the northern hemisphere (northern extratropics) and these effects cannot be attributed to carbon dioxide.
3. Carbon dioxide has contributed a small amount to an increase in global temperatures but without what is commonly referred to as feed-back.
David Douglas and John Christy are practicing climate scientists from the Department of Physics and Astronomy, University of Rochester, and Department of Atmospheric Science and Earth System Science Center, University of Alabama, respectively. Their paper entitled ‘Limits on CO2 Climate Forcing from Recent Temperature Data of Earth’, was recently accepted for publication in Energy and Environment.
A regular at this blog, Cohenite, comments on the Douglass-Christy paper in a fairly technical note already posted at the community webpage of this blog, and entitled ‘Temperature Trends and Carbon Dioxide’, suggests that there is no evidence for a contribution from carbon dioxide to global temperatures and that the role of the sun has been underestimated. Read more here.
In the opinion of Congress of Racial Equality chairman Roy Innis, few words better describe the latest Democratic “energy” bill than fraud, swindle, con job or hoax. While cons are great entertainment when they’re just a movie, they’re justifiably the source of anger and outrage when they’re perpetrated on consumers and families by corporations or Congress. That’s what we’re dealing with here, says Innis: An outrageous swindle, in the form of “expanded offshore leasing” that in reality –
* permanently locks up 88% of our OCS oil and gas - and the revenues and jobs that production would bring; and
* is supposed to be replaced with “alternative energy” that would bring brownouts and blackouts, and wouldn’t survive without costly mandates and subsidies
Energy Fraud
By Roy Innis, CORE
Democrats are engineering another energy swindle that will cost consumers and taxpayers. Since publication of my book, Energy Keepers - Energy Killers: The new civil rights battle, millions of Americans have become aware that this country has vast untapped energy resources. Three-fourths of US voters now support expanded onshore and offshore drilling. A bipartisan coalition in Congress wants to increase domestic petroleum, coal and nuclear power, while fostering conservation and wind, solar and other energy opportunities. They’ve been blocked at every turn by liberal Democrats, many of whom are working with radical environmentalists to eliminate proven hydrocarbon and nuclear technologies that provide 93% of our energy, and replace them with systems that currently generate less than 1% of the energy that safeguards our jobs, homes, security and prosperity.
However, political realities and voter outrage over soaring gasoline, food and heating costs forced House Speaker Nancy Pelosi and Senate Majority leader Harry Reid to devise an elaborate hoax. It had the trappings of a pro-energy bill - but was as authentic as the betting house and announcer in the classic Newman-Redford film, The Sting. Their legislation “expanded offshore leasing” - but only beyond 100 miles off most of our coasts, and 50 miles off four states that would get no revenues from leasing or production, and thus would have no incentive to permit leasing. In other words, it allowed leasing only where there was no petroleum, or where drilling and production would be so far offshore and so expensive that no sane company would do it. The bill made 88% of our nation’s offshore oil and gas permanently off limits - along with jobs and some $800 billion in revenues that development would generate for state and federal governments. The pseudo-energy bill also imposed new subsidies to promote unreliable wind and solar power - paying for them with higher taxes, higher electricity rates and new taxes on oil companies, which then would have less money to drill in the few places that aren’t off limits. It mandated that utilities magically increase their wind and solar electricity generation from 1.5% today to 15% 2020.
Drafted largely by environmentalists and lobbyists, the legislation would have undermined our free market system and given Congress and bureaucrats the power of Roman emperors to give thumbs up or down to companies, industries and jobs. It would have made lobbyists and pressure groups more important to business success or failure than quality products and services, innovative R&D or sound management.Our energy woes have nothing to do with technology or the will of oil companies to lease and drill. They’re due to politics, moratoriums, lawsuits and anti-drilling pressure-group tactics that block drilling everywhere we turn. We’re fed up with it.
This anti-energy insanity has got to stop. We’re the only country on Earth that deliberately locks up its own energy resources, and then spends $700 billion a year (the price of the Wall Street bailout) to import substitutes. We’re driving up energy prices and forcing poor families to choose between buying a gallon of milk or a gallon of gasoline. If Congress can’t get its act together this year, we’ll make darn sure it gets religion next year. Read more here
NASA Observatory
Astronomers who count sunspots have announced that 2008 is now the “blankest year” of the Space Age. As of Sept. 27, 2008, the sun had been blank, i.e., had no visible sunspots, on 200 days of the year. To find a year with more blank suns, you have to go back to 1954, three years before the launch of Sputnik, when the sun was blank 241 times. “Sunspot counts are at a 50-year low,” says solar physicist David Hathaway of the NASA Marshall Space Flight Center. “We’re experiencing a deep minimum of the solar cycle.”
And it is a very quiet time. If solar activity continues as low as it has been, 2008 could rack up a whopping 290 spotless days by the end of December, making it a century-level year in terms of spotlessness. Hathaway cautions that this development may sound more exciting than it actually is: “While the solar minimum of 2008 is shaping up to be the deepest of the Space Age, it is still unremarkable compared to the long and deep solar minima of the late 19th and early 20th centuries.” Those earlier minima routinely racked up 200 to 300 spotless days per year.
A histogram showing the blankest years of the last half-century. The vertical axis is a count of spotless days in each year. The bar for 2008, which was updated on Sept. 27th, is still growing. [Larger images: 50 years, 100 years]
Some solar physicists are welcoming the lull. “This gives us a chance to study the sun without the complications of sunspots,” says Dean Pesnell of the Goddard Space Flight Center. “Right now we have the best instrumentation in history looking at the sun. There is a whole fleet of spacecraft devoted to solar physics--SOHO, Hinode, ACE, STEREO and others. We’re bound to learn new things during this long solar minimum.” As an example he offers helioseismology: “By monitoring the sun’s vibrating surface, helioseismologists can probe the stellar interior in much the same way geologists use earthquakes to probe inside Earth. With sunspots out of the way, we gain a better view of the sun’s subsurface winds and inner magnetic dynamo.”
“There is also the matter of solar irradiance,” adds Pesnell. “Researchers are now seeing the dimmest sun in their records. The change is small, just a fraction of a percent, but significant. Questions about effects on climate are natural if the sun continues to dim.” Pesnell is NASA’s project scientist for the Solar Dynamics Observatory (SDO), a new spacecraft equipped to study both solar irradiance and helioseismic waves. Construction of SDO is complete, he says, and it has passed pre-launch vibration and thermal testing. “We are ready to launch! Solar minimum is a great time to go.”
Coinciding with the string of blank suns is a 50-year record low in solar wind pressure, a recent discovery of the Ulysses spacecraft. (See the Science@NASA story Solar Wind Loses Pressure.) The pressure drop began years before the current minimum, so it is unclear how the two phenomena are connected, if at all. This is another mystery for SDO and the others. Who knew the blank sun could be so interesting? More to come. See release here.
Sneaky: Current Credit Bailout Bill Contains Carbon Tax Provisions!By Anthony Watts, Watts Up With That
If you look at page 180 of the 451-page monster bailout bill that easily passed the Senate yesterday (PDF here), you will see that it includes at Section 116 language about the tax treatment of “industrial source carbon dioxide.” It also provides, at Section 117, for a “carbon audit of the tax code.”
What could a provision about the tax treatment of “industrial source carbon dioxide” and another provision about doing a “carbon audit” of the tax code possibly have to do with restoring confidence in Wall Street’s troubled credit and banking markets?
The answer: NOTHING.
This appears to be an attempt by global warming alarmists to lay the foundation for a carbon tax in the middle of another crisis, hoping nobody will notice. Call your congressman now! More at Planet Gore.
UPDATE FROM CAPITAL RESEARCH:
Apparently the bill with the carbon provisions existed already and was passed by the Senate. So, the Senate used the bill as a vehicle for advancing the bailout package. They couldn’t under the Constitution initiate a spending bill in the Senate, so they had to amend one that was already passed by the House. Nonetheless, what was so urgent about the carbon provisions that they had to go with the bailout bill? Who decided which bill to use as the vehicle? Why not pick a non-controversial bill? My guess would be that Senate Majority Leader Harry Reid made the call but it’s just a guess.
An expert offers a better explanation of one of the carbon-related provisions that is in the Bailout 2.0 bill.
According to this wizard of Wall Street, one provision provides preferential tax treatment for publicly-traded partnerships when they trade so-called carbon offsets. It was reportedly already passed in another bill: What’s so urgent about that tax provision that it absolutely had to go into another bill that aims to deal with a financial emergency? So, you can see it’s a little more complex than explained above. However, it’s still bad because it gives legitimacy to these strange indulgences known as carbon offsets and provides a tax incentive for trading them.
I am also informed by this source that Henry Paulson did not push to insert these two carbon-related provisions, but he certainly didn’t object to them, and his track record strongly suggests he would support them. When he ran Goldman Sachs, Paulson released a statement specifically endorsing carbon trading. As the Washington Post reported (June 1, 2006) reported: Last year under Paulson’s direction, Goldman Sachs issued an eight-page position paper on environmental policy, saying it accepts a scientific consensus, led by United Nations climate experts, that global warming poses one of the greatest threats this century.
Like Bush, the Goldman Sachs statement endorsed a market for businesses to buy and sell rights to emit greenhouse gases, saying it will spur technology advances by companies “that lead to a less carbon-intensive economy.” But, it added, “Voluntary action alone cannot solve the climate change problem,” a position contrary to the Bush administration’s view. Source: Capital Research. The text of the provision on page 180 of the bill (PDF here). See this complete post and comments here.
By Syun-Ichi Akasofu, Community Perspective on Newsminer.com
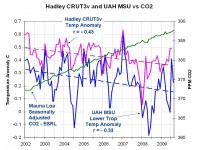
Recent studies by the Hadley Climate Research Center (UK), the Japan Meteorological Agency, the National Oceanic and Atmospheric Administration, the University of East Anglia (UK) and the University of Alabama Huntsville show clearly that the rising trend of global average temperature stopped in 2000-2001. Further, NASA data shows that warming in the southern hemisphere has stopped, and that ocean temperatures also have stopped rising.
See larger image here
The global average temperature had been rising until about 2000-2001. The International Panel for Climate Change (IPCC) and many scientists hypothesize rising temperatures were mostly caused by the greenhouse effect of carbon dioxide (CO2), and they predicted further temperature increases after 2000. It was natural to assume that CO2 was responsible for the rise, because CO2 molecules in the atmosphere tend to reflect back the infrared radiation to the ground, preventing cooling (the greenhouse effect) and also because CO2 concentrations have been rapidly increasing since 1946. But, this hypothesis on the cause of global warming is just one of several.
Unfortunately, many scientists appear to forget that weather and climate also are controlled by nature, as we witness weather changes every day and climate changes in longer terms. During the last several years, I have suggested that it is important to identify the natural effects and subtract them from the temperature changes. Only then can we be sure of the man-made contributions. This suggestion brought me the dubious honor of being designated “Alaska’s most famous climate change skeptic.”
The stopping of the rise in global average temperature after 2000-2001 indicates that the hypothesis and prediction made by the IPCC need serious revision. I have been suggesting during the last several years that there are at least two natural components that cause long-term climate changes. The first is the recovery (namely, warming) from the Little Ice Age, which occured approximately 1800-1850. The other is what we call the multi-decadal oscillation. In the recent past, this component had a positive gradient (warming) from 1910 to 1940, a negative gradient (cooling - many Fairbanksans remember the very cold winters in the 1960s) from 1940 to 1975, and then again a positive gradient (warming - many Fairbanksans have enjoyed the comfortable winters of the last few decades or so) from 1975 to about 2000. The multi-decadal oscillation peaked around 2000, and a negative trend began at that time. The second component has a large amplitude and can overwhelm the first, and I believe that this is the reason for the stopping of the temperature rise. Since CO2 has only a positive effect, the new trend indicates that natural changes are greater than the CO2 effect, as I have stated during the last several years.
Future changes in global temperature depend on the combination of both the recovery from the Little Ice Age (positive) and the multi-decadal oscillation (both positive and negative). We have an urgent need to learn more about these natural changes to aid us in predicting future changes. See more here.
Syun-Ichi Akasofu is a former director of the Geophysical Institute and the International Arctic Research Center, both on the campus of the University of Alaska Fairbanks
Exchange Morning Post
New theory predicts the largest ozone hole over Antarctica will occur this month.
A University of Waterloo scientist says that cosmic rays are a key cause for expanding the hole in the ozone layer over the South Pole—and predicts the largest ozone hole will occur in one or two weeks. Qing-Bin Lu, a professor of physics and astronomy who studies ozone depletion, says that it was generally accepted for more than two decades that the Earth’s ozone layer is depleted by chlorine atoms produced by sunlight-induced destruction of chlorofluorocarbons (CFCs) in the atmosphere. But more and more evidence now points to a new theory that the cosmic rays (energy particles that originate in space) play a major role. The ozone layer is a layer in Earth’s atmosphere that contains high concentrations of ozone. It absorbs almost all of the sun’s high-frequency ultraviolet light, which is potentially damaging to life on Earth and causes diseases such as skin cancer and cataracts. The Antarctic ozone hole can be larger than the size of North America.
Lu says that data from several sources, including NASA satellites, show a strong correlation between cosmic ray intensity and ozone depletion. Lab measurements demonstrate a mechanism by which cosmic rays cause drastic reactions of ozone-depleting chlorine inside polar clouds. Satellite data in the period of 1980-2007, covering two full 11-year solar cycles, demonstrate the significant correlation between cosmic rays and ozone depletion. “This finding, combined with laboratory measurements, provides strong evidence of the role of cosmic-ray driven reactions in causing the ozone hole and resolves the mystery why a large discrepancy between the sunlight-related photochemical model and the observed ozone depletion exists,” Lu says.
For example, the most recent scientific assessments of ozone depletion by the World Meteorological Organization and the United Nations Environment Programme, which use photochemical models, predict ozone will increase by one to 2.5 per cent between 2000 and 2020 and Antarctic springtime ozone is projected to increase by five to 10 per cent between 2000 and 2020. In sharp contrast, Lu says his study predicts the severest ozone loss—resulting in the largest ozone hole—will occur over the South Pole this month. The study also predicts another large hole will probably occur around 2019. See story here. H/T Alexandre Aguiar at the METSUL.
By Timothy Birdnow, American Thinker
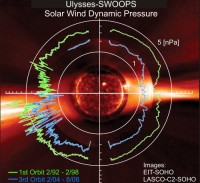
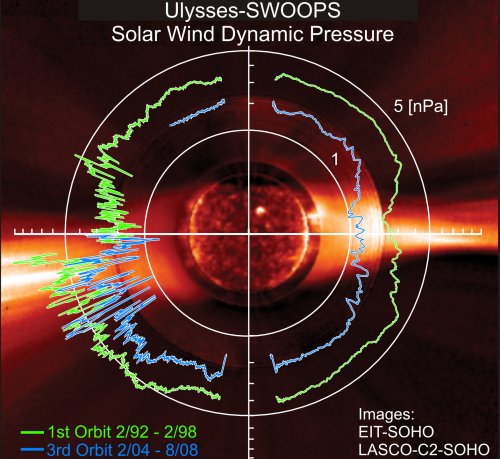
Global warming alarmists face yet another challenge to their predictions of an inferno of doom. The solar wind is losing power, and is at a fifty year low, according to NASA.
The Ulysses solar probe reports a 13% drop in temperature, a 20% drop in density, and a 30% drop-off in the sun’s magnetic field, marking this as the weakest period of solar wind on record (records go back to the 1960’s).
See larger image here
What does this mean? The Heliosphere is thinning, and thus will block fewer cosmic rays. Heinrick Svensmark theorizes that an increase in cosmic rays reaching the Earth will drive cloud formation, increase the planet’s albedo (reflectivity), thus cooling it.
Is this the cause of the Earth’s unusually cool year? According to Anthony Watts, the Earth’s albedo reached a nadir in 1997, and has risen sharply since. Is this related to the weakening of solar activity? We`ve seen few sunspots in Solar Cycle 24, the solar conveyor belt has slowed to a crawl, and now the solar wind is bottoming out.
This will allow us to see if we are really in the throes of Anthropogenic Global Warming; if temperatures rise (and they haven’t since 1998) then factors other than solar activity are driving climate trends, if not then the greenhouse gas theory is falsified.
See larger image here
If a cooling trend continues, the climate alarmists will have to throw in the towel. Never fear; they’ll come up with a new cause to keep their adrenaline flowing! Probably ocean acidification, or the loss of bees. See more here. See NASA press conference slides here. See Anthony Watts take on the press conference here.
By Dr. Zbigniew Jaworowski in NZCPR
In an op-ed in a Polish weekly I commented recently on a remarkable decrease of global temperature in 2008, and over the past decade. Not surprisingly the op-ed evoked a strong reaction from Polish co-workers of IPCC, denying the existence of cooling. Surprising, however, was that the criticism dwelled upon a “global climatic conspiracy”, and “colossal international plot”. I did not use these words nor even hinted at such an idea. The idea was probably apparent from the data and facts I presented, showing weaknesses of the man-made global warming hypothesis. Without irrational political or ideological factors, it is really difficult to understand why so many people believe in human causation of the Modern Warm Period, which was never plausibly proved by scientific evidence. Some of these factors I will discuss here.
A suicidal conspiracy stratagem was openly presented by Maurice Strong, a godfather of the global environmental movement, and a former senior advisor to Kofi Annan, the U.N. Secretary-General. In 1972 Strong was a Secretary-General of the United Nations Conference on the Human Environment, which launched the world environment movement, and he has played a critical role in its globalization. In 1992 Strong was the Secretary-General of the “World Summit” conference in Rio de Janeiro, where on his instigation the foundations for the Kyoto Protocol were laid.
In an interview Strong disclosed his mindset: “What if a small group of world leaders were to conclude that the principal risk to the Earth comes from the actions of rich countries? And if the world is to survive, those rich countries would have to sign an agreement reducing their impact on the environment. Will they do it? The group’s conclusion is “no.” The rich countries won’t do it. They won’t change. So, in order to save the planet, the group decides: Isn’t the only hope for the planet that the industrialized civilizations collapse? Isn’t it our responsibility to bring that about? This group of world leaders form a secret society to bring about an economic collapse.” (Wood, 1990) .
The climatic issue became now perhaps the most important agenda of the United Nations and politicians, at least they say so. It became also a moral issue. In 2007 addressing the UN General Assembly Gro Harlem Brundtland, the UN Secretary-General’s Special Envoy on Climate Change, pointing at climatic skeptics stated: “It is irresponsible, reckless and deeply immoral to question the seriousness of the real danger of climate change”. But earlier “scare them to deaths!” morality of “climatists” was explained by Stephen Schneider, one of their top gurus: “On the one hand, as scientists we are ethically bound to the scientific method, in effect promising to tell the truth, the whole truth, and nothing but. On the other hand, we are not just scientists but human beings as well, we need to get some broadbased support, to capture the public’s imagination. That, of course, entails getting loads of media coverage. So we have to offer up scary scenarios, make simplified, dramatic statements, and make little mention of any doubts we might have. Each of us has to decide what the right balance is between being effective and being honest” (Schneider, 1989).
The same moral standard is offered by Al Gore: “I believe it is appropriate to have an over-representation of factual presentations on how dangerous (global warming) is, as a predicate for opening up the audience to listen to what the solutions are” (Gore, 2006). In similar vein Rajendra K. Pauchari, the chairman of IPCC, commented in the last Fourth PCCC Report: “I hope this will shock people and governments into taking more serious action” (Crook, 2007) . Thus IPCC does not have ambition to present an objective climatic situation, but rather “to shock” the people to take actions which would bring no climatic effects (NIPCC, 2008) , but rather disastrous global economic and societal consequences. Implementation of these actions would dismantle the global energy system, the primary driving force of our civilization. This is what Maurice Strong and other leaders of Green Movement apparently have in mind. Read more and the science that argues cooling is more likely than this promised warming which is failing here.
By Jeff Id at The Air Vent
ICECAP UPDATE: Also see Lubos Motl’s comments on this posting concluding “If This Isn’t Fraud, What Is?” here.
Ok, two days ago I published a report on the data called The All Important Blade of the Stick Uses Less Than 5% of the Data. This report detailed what I consider powerful evidence that Mann and his group may have intentionally manipulated data in creating this paper. I don’t say this lightly.
It is very clear that the proxies, which no one is sure represent temperature, were in fact extended using questionable statistics and then correlated to demonstrate that they match measured temperature. The addition of an up slope to 90% of the data was pasted on according to less than 5% of the data. I am very suspicious that this 5% was chosen specifically because of its up slope in recent times. Think about that only 55 series determined the outcome of the majority of the 1209 series data!!
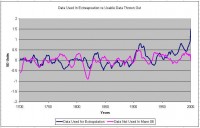
See larger image here.
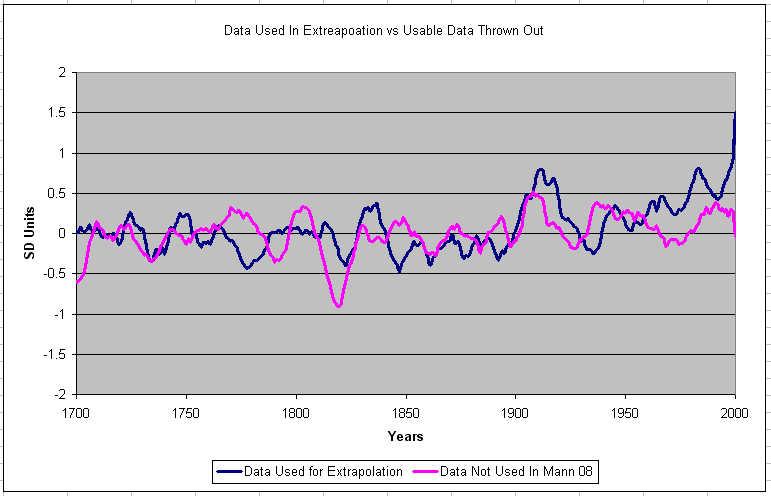
Mann used a select few data sets to paste an up slope on the end of 90% of the data in his latest paper. The series used to make the pink line above could have been used in the process but were conveniently eliminated from the paper without mention. Mann accidentally posted these series on a national server and cannot eliminate them easily.
It was my guess that these series would have a reduced up slope compared to the data selected in the last 50 years, I had no idea the selected data would demonstrate such an extreme slope so I could have lost. I can’t prove it yet but this now looks like deliberate manipulation of data to me! Read more here.
Scientific Alliance, Newsletter, September 19, 2008
Last week, we wrote of the reduced tolerance shown by courts to those who had deliberately trashed GM crop trials; an encouraging trend which seemed to redefine what is or is not acceptable in the name of protecting the environment. However, the opposite has now occurred in a case of climate change protestors.
Five Greenpeace activists scaled the chimney of E.ON’s coal-fired power station in Kingsnorth, Kent last October to try to shut down the plant (this year also saw several days of protest against plans to build a new coal station on the site). Their original plan to paint “Gordon, bin it” was cut short, leaving a chimney apparently named Gordon. A prosecution for criminal damage was brought against them plus a sixth Greenpeace member who planned the protest.
The defense argued that the damage was justified because of the dangers caused by additional carbon dioxide emissions, an argument previously used mainly when damage has been caused to protect the property of others from immediate harm. The defence called the well-known American climate scientist, Professor Jim Hansen of NASA, as an expert witness. His testimony included the claim that emissions from the current Kingsnorth plant would lead to the extinction of up to 400 species. Millionaire Zac Goldsmith, ex-editor of The Ecologist, environmental adviser to David Cameron and prospective Tory MP, also gave evidence, and argued support for coal-fired stations would make it difficult for the UK to push for emissions reductions in other countries.
To the surprise - indeed, shock - of many, the jury accepted the defence of “lawful excuse” and acquitted all of the defendants. This is a clear signal for more such protests to be carried out with impunity. Not only will headlines be made, but the protestors will likely get off scot-free. This is a dangerously slippery slope, allowing Greenpeace and others to promote their view of the world with little fear of the consequences. Hopefully, this tolerance will not last.
The “lawful excuse” defence was successfully used also in 2000 in the case against Lord Melchett and another merry band of Greenpeace activists who decided to destroy a GM field trial. Since then, as we have seen, the legal system (in some countries, at least) has started taking a more robust view of environmental vandalism and some of the perpetrators have received fines or prison sentences. But the damage was done; the message was that society would to a large extent find acceptable what it considered to be damage done in a good cause. The green movement has always considered that the end justifies the means, and this reinforced their belief in themselves. Read more here.