


By Joseph D’Aleo, CCM, AMS Fellow
Dr. Wil Happer of Princeton wrote “The Montreal Protocol to ban freons was the warm-up exercise for the IPCC. Many current IPCC players gained fame then by stampeding the US Congress into supporting the Montreal Protocol. They learned to use dramatized, phony scientific claims like “ozone holes over Kennebunkport” (President Bush Sr’s seaside residence in New England). The ozone crusade also had business opportunities for firms like Dupont to market proprietary “ozone-friendly” refrigerants at much better prices than the conventional (and more easily used) freons that had long-since lost patent protection and were not a cheap commodity with little profit potential” (link).
Even James Lovelock agrees. James Lovelock formulated the Gaia hypothesis, which postulates that the biosphere is a self-regulating entity with the capacity to keep our planet healthy by controlling the chemical and physical environment. He later became concerned that global warming would upset the balance and leave only the arctic as habitable. He began to move off this position in 2007 suggesting that the Earth itself is in “no danger” because it would stabilize in a new state.
James Lovelock’s reaction to first reading about the leaked CRU emails in late 2009 was one of a true scientist. “I was utterly disgusted. My second thought was that it was inevitable. It was bound to happen. Science, not so very long ago, pre-1960s, was largely vocational. Back when I was young, I didn’t want to do anything else other than be a scientist. They’re not like that nowadays. They don’t give a damn. They go to these massive, mass-produced universities and churn them out. They say: “Science is a good career. You can get a job for life doing government work.” That’s no way to do science.
I have seen this happen before, of course. We should have been warned by the CFC/ozone affair because the corruption of science in that was so bad that something like 80% of the measurements being made during that time were either faked, or incompetently done.
Fudging the data in any way whatsoever is quite literally a sin against the holy ghost of science. I’m not religious, but I put it that way because I feel so strongly. It’s the one thing you do not ever do. You’ve got to have standards.”
On a March 2010 Guardian interview, Lovelock opined “The great climate science centres around the world are more than well aware how weak their science is. If you talk to them privately they’re scared stiff of the fact that they don’t really know what the clouds and the aerosols are doing...We do need skepticism about the predictions about what will happen to the climate in 50 years, or whatever. It’s almost naive, scientifically speaking, to think we can give relatively accurate predictions for future climate. There are so many unknowns that it’s wrong to do it.”
Will Happer further elaborated “The Montreal Protocol may not have been necessary to save the ozone, but it had limited economic damage. It has caused much more damage in the way it has corrupted science. It showed how quickly a scientist or activist can gain fame and fortune by purporting to save planet earth. We have the same situation with CO2 now, but CO2 is completely natural, unlike freons. Planet earth is quite happy to have lots more CO2 than current values, as the geological record clearly shows. If the jihad against CO2 succeeds, there will be enormous economic damage, and even worse consequences for human liberty at the hands of the successful jihadists.”
LIKE GLOBAL WARMING THE DATA DOESN’T SUPPORT THE THEORY
The ozone hole has not closed off after we banned CFCs. See this story in Nature about how the Consensus about the Ozone Hole and Man’s Role (with CFCs) May Be Falling Apart.
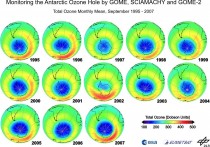
The size of the hole has hardly changed since 1990 (enlarged here).
“As the world marks 20 years since the introduction of the Montreal Protocol to protect the ozone layer, Nature has learned of experimental data that threaten to shatter established theories of ozone chemistry. If the data are right, scientists will have to rethink their understanding of how ozone holes are formed and how that relates to climate change. Markus Rex, an atmosphere scientist at the Alfred Wegener Institute of Polar and Marine Research in Potsdam, Germany, did a double-take when he saw new data for the break-down rate of a crucial molecule, dichlorine peroxide (Cl2O2). The rate of photolysis (light-activated splitting) of this molecule reported by chemists at NASA’s Jet Propulsion Laboratory in Pasadena, California1, was extremely low in the wavelengths available in the stratosphere - almost an order of magnitude lower than the currently accepted rate.
“This must have far-reaching consequences,” Rex says. “If the measurements are correct we can basically no longer say we understand how ozone holes come into being.” What effect the results have on projections of the speed or extent of ozone depletion remains unclear.
Other groups have yet to confirm the new photolysis rate, but the conundrum is already causing much debate and uncertainty in the ozone research community. “Our understanding of chloride chemistry has really been blown apart,” says John Crowley, an ozone researcher at the Max Planck Institute of Chemistry in Mainz, Germany. “Until recently everything looked like it fitted nicely,” agrees Neil Harris, an atmosphere scientist who heads the European Ozone Research Coordinating Unit at the University of Cambridge, UK. “Now suddenly it’s like a plank has been pulled out of a bridge.”
STILL COMING
Yet like the cultists whose spacecraft didn’t arrive on the announced date, the government scientists find ways to postpone it and save their reputations (examples “Increasing greenhouse gases could delay, or even postpone indefinitely the recovery of stratospheric ozone in some regions of the Earth, a Johns Hopkins earth scientist suggests” here and “Scientists Find Antarctic Ozone Hole to Recover Later than Expected” here.
“The warmers are getting more and more like those traditional predictors of the end of the world who, when the event fails to happen on the due date, announce an error in their calculations and a new date.” Dr. John Brignell, Emeritus Engineering Professor at the University of Southampton, on Number Watch (May 1) PDF
By Joseph D’Aleo, CCM, AMS Fellow
Enlarged here.
THE UNITED KINGDOM
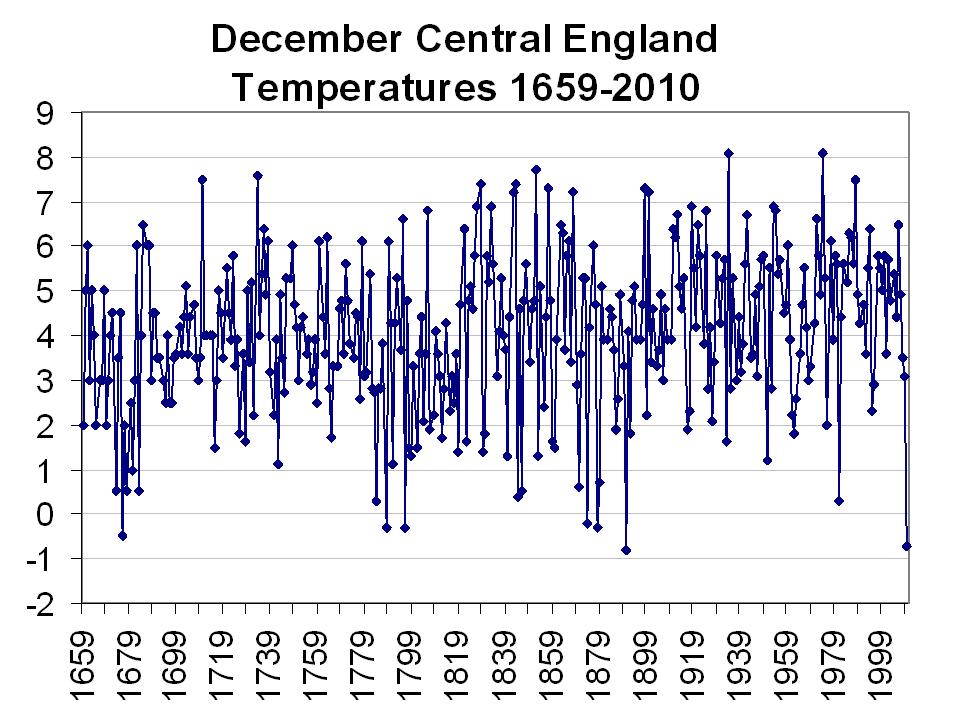
The Central England Temperature record is one of the longest continuous temperature record in the world extending back to the Little Ice age in 1659. December 2010 was the coldest December in 120 years with an average of -0.7C just short of the record of -0.8C recorded in December 1890 and the Second Coldest December Temperature in the entire record (352 years).
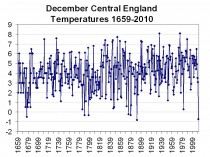
Enlarged here. Note 2010 at the far right.
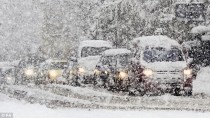
In addition to the cold, heavy snow hampered travel by air, rail and road.
In Ireland, this has been the coldest start to winter for the last 130 years, when general records began. According to Met Eireann, Ireland’s meteorological service, December has officially been the coldest month ever on record. County Mayo recorded low temperatures of -17.2C (1F).
Ireland’s Armagh Observatory has a longer period of record extending back to 1795. The Armagh mean monthly temperature was -0.3 degrees Celsius (31.4 degrees Fahrenheit), about 5.4 Celsius below average, making December 2010 the second coldest December in Armagh. The three coldest Decembers in Armagh are now those of 1878, 2010 and 1796, with average temperatures of -0.5 C, -0.3 C and 0.6 C respectively.
The maximum air temperature was 10.8 C on the 28th, whilst the lowest air temperature was -11.9 C on 21st, making the morning of the winter solstice the fourth coldest December night in Armagh since records of daily temperature maxima and minima began in August 1843. Previous cold December nights were -14.6 C on Christmas Day 1878, -13.7 C on Christmas Eve 1878, and -12.2 C on December 20th 1886. In 2010 there were twenty-four nights with grass frost and twenty-four with air frost, with snow falling on six days.
The winter solstice, December 21st, was also the coldest day since 1843, with a maximum temperature of -8.0 C and an average temperature of -10.0 C. This was probably the coldest day in Armagh since the very cold 13th January 1814, which with morning and evening temperatures of -12.2 C and -13.3 C reportedly had ‘the hardest frost recorded here for the space of 20 years’.
Probably the most notable record of the winter so far is the new all time record low for Northern Ireland, of -18.7C recorded on the 23rd of December at Castlederg, County Tyrone. In addition, all of the following weather stations recorded their all time record lows since recording began, this winter:
• RAF Leeming at -17.9C on the 3rd of December
• RAF Topcliffe at -19.0C on the 3rd of December
• Linton-on-Ouse at -17.3C on the 3rd of December
• Church Fenton at -17.5C on the 3rd of December
• RAF Scampton at -13.6C on the 3rd of December
NORTHEAST EUROPE
Germany has experienced the coldest December in more than 40 years, the German Weather Service (DWD) said. See report here.
The average temperature in December was 4.3 degrees below the past records on average, the DWD said. People have never seen such a freezing December since 1969.
The bitter cold was mainly stuck in the north and east of the country, where night temperatures in many places were below minus 20 degrees, the weather agency added. A DWD monitoring station near northeastern city of Postdam recorded only four days when the temperatures were above zero degree this month.
Snowfall was very heavy. Munich, Germany, recorded a snowfall total for December of 52 inches and the temperature averaged 6.3C below normal. 42 inches of snow was reported in Berlin. For the first time since 1981, all people in every place of the country celebrated “a white Christmas” together in this December.
In western Poland, the city of Poznan had a snowfall total of 58 inches. Poland temperatures were over 5C below normal.
SCANDINAVIA’S BRUTAL DECEMBER
According to the Swedish meteorological agency SMHI, several parts of Sweden, including the southern region Gotaland and eastern Svealand, experienced “the coldest December in at least 110 years.” Temperatures were as much 8C (15F) below normal.
As Norway entered its fifth week of bitterly cold weather over most of the country, Norwegians were being warned that their electricity bills in January may be three times as high as they were this past January, when cold weather also had sent rates soaring.
Cold weather has sent power demand up and supplies down, resulting in record high electricity rates. PHOTO: Views and News
The ongoing cold snap has left mountain reservoirs with the lowest water levels in 28 years. That’s bad news for a country that relies on hydroelectric power. Spot prices for power have risen from 40 ore per kilowatt hour in the Oslo area earlier this fall to 72 ore this week, with more increases looming. The situation is worse for residents of central Norway, where rates are even higher.
CHINA SNOW AND COLD
Days of continuous snowfall hit northwestern and eastern China, causing roadblocks and delays. Heavy snow fell in China’s northwest Xinjiang province after December 20 and accumulated to over one meter in some parts. The eastern province of Shandong has also been affected. Temperatures dropped to -25C in some areas, causing concern that China might see a repeat of the extreme weather of early 2008 that killed 129 people, left millions stranded and brought the country to a standstill during the Lunar New Year celebrations. Read more here.
INDIA SHIVERS
Dr. Madhav Khandekar, a meteorologist from Canada vacationing in India writes: “Here in Vadodara , a western India city, early morning temp is at 7-8C and afternoon at 20C or so. It feels cold inside houses of most residents, especially poorly built houses of many and that is what makes a colder climate more dangerous now. It is time to write about ‘dangerous cold climate ahead!’ Delhi had a maximum of 15C on Sunday. And inside our apartment, the temperature dipped to 12C. Most Indian homes, do not have any heating facility as a result, we spend our time at home completely wrapped up in winter clothes.”
More than 100 people have died as a cold wave intensified its grip over northern and eastern parts of India, officials and news reports said Saturday.
The northern state of Uttar Pradesh, which has been the worst hit, has seen 22 new deaths since Wednesday, taking the death toll from a fortnight of cold weather to 63, according to figures released by the state government.
Most victims were either elderly or poor, with inadequate shelter and warm clothing, state officials said.
The town of Churk was the coldest place in Uttar Pradesh on Saturday, recording a low temperature of 1.4 degrees Celsius. Meanwhile, more deaths were also blamed on freezing temperatures in the eastern state of Jharkhand, increasing the death toll there to 62, the IANS news agency reported.
The capital New Delhi and the Himalayan states of Jammu and Kashmir and Himachal Pradesh have also experienced cold weather, leaving more than a dozen people dead there, according to local news channels.
PDF here. Part II is the United States and Part III the Southern Hemisphere.
By Dr. Richard Keen
The winter of 2009-2010 was a memorable one in the Northeast and Mid-Atlantic states, with locations like Philadelphia enjoying multiple massive snow storms that led to record totals for the winter. As with all exceptional weather events of late, the usual suspects blamed the occurrence on global warming. In a NOAA press release reported in USA Today, Jay Lawrimore stated that…
“Heavy snow, like the record snows that crippled Baltimore and Washington last winter, is likely to increase because storms are moving north.” To which I commented on “Watts Up With That” here on July 16, 2010 that Lawrimore’s remarks show a complete lack of understanding of weather (which makes up climate).
Anyone who spends a few winters on the East coast knows that snow there is generally caused by lows off the coast, and if the storms move north (as Lawrimore claimed), Baltimore, Philadelphia, NYC et al. find themselves in the warm sectors of the lows, and enjoy warm southerly winds and rain.
That’s the theory; how about some data to show that a warmer climate should lead to less snow, not more. The data are easy to find and interpret. More than a century of winter snow totals and average winter temperatures (December-January-February) are posted on the NWS Philadelphia web site.
Seasonal snow totals in Philadelphia are dominated by the occurrence (or non-occurrence) of large snow events (i.e., the snowiest winters have two or three major storms, and the least snowy winters had none). Here are some charts and correlations.
Chart 1 (enlarged here) compares yearly winter snow totals (in blue) with winter mean temperatures (in red). The small circles are for individual winters, and the heavy lines are 30-year running means (since climate is defined by some, such as the WMO, as a 30-year average). The winter temperatures are plotted upside-down to show the correlation better. And the correlation is that warm spells, like those in the 1930s, 1950s, and 1990s, have less snow overall than cold epochs like the 1900s, 1910s, 1960s, and 1970s.
Note that the 30-year running means are plotted and the end of each 30-year period, so while the 30-year means are shifted a bit from the highs and lows of the annual values, the 30-year curves for snow and temperature line up together. Also note that over 126 years, Philadelphia’s winters are not getting warmer or colder, and there’s not much change in snowfall.
Chart 2 (enlarged here) is a direct comparison of yearly snowfall with winter temperatures. The correlation coefficient (square root of R2) is greater than -0.5, which is not bad for anything in climate. It clearly shows a trend for more snow during colder winters, and less snow during mild winters. Philadelphia’s average annual snow fall is 20.5 inches, and the coldest winters produce about twice that amount, while the warmest winters are almost snowless.
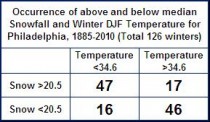
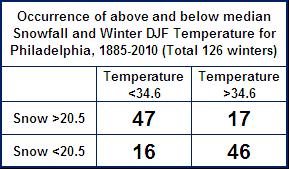
The occurrence of snowy and less snowy winters during cold and mild winters is summarized in the table below. Although half of the winters are warmer than the median temperature (of course!) and half are colder, and half of the winters are snowier than median and half are less snowy, the co-occurrence of snow vs. temperature is not so even.
Enlarged here.
There are several ways to describe the relation between winter temperature and snowfall…
Colder winters are three times more likely to be snowier than the median.
Snowy winters are three times more likely to be cold.
Warm winters are three times more likely to have less snow than the median.
Less snowy winters are three times more likely to be mild.
One way the relation between snowfall and winter temperature CANNOT be described is that warmth leads to more big snowstorms and greater total winter snowfall.
By the way, I did this analysis for Philadelphia because it’s where I was raised and learned about weather before moving to Colorado. The warmers will no doubt raise their usual charge of “cherry-picking” when inconvenient data shows up. I challenge them to examine others locations in the northeast to find one they can “cherry pick” to support their claims. Until they do, the recent large snowstorms stand not as a symptom of global warming, but as yet another indication that global warming may not be happening at all. See PDF.
See also the New York Times story: ‘Bulge’ in Atmospheric Pressure Gives Us a Super-Cold Winter Amid Global Warming” here.
Update: See James Delingpole’s How the Doomed Met Office tried to spin its way out of trouble here. See the GWPF story and letter “Did UK Government Keep Cold Winter Warning Secret In Run-Up To UN Climate Conference?” here.
-----------
By Rachel Quigley, UK Daily Mail
The Met Office warned ministers to expect an ‘exceptionally cold winter’ but then kept the prediction secret from the public. The forecaster decided not to reveal the information because it was embarrassed after wrongly predicting a ‘barbecue summer’ in 2009, BBC analyst Roger Harrabin said.
Instead of a seasonal forecast, it offered only monthly snapshots.
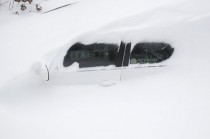
Cars try to make their way through the centre of York in the snow at the start of December.
The disclosure raises questions over whether transport authorities and councils could have been better prepared for the cold snap which brought chaos before Christmas.
As temperatures fell to a record low, train services were badly disrupted, roads were covered by snow and thousands were stranded at Heathrow as flights were cancelled and the airport struggled to clear the backlog.
Last night Mr Harrabin said: ‘With Britain shivering through a third winter in a row, shouldn’t the weather forecasters have warned us well in advance? Why didn’t the Met Office tell us?
‘The truth is it did suspect we were in for an exceptionally cold early winter, and told the Cabinet Office so in October. ‘But we weren’t let in on the secret because the Met Office no longer publishes its seasonal forecasts due to the ridicule it suffered for predicting a barbecue summer in 2009.
‘It did forecast in November that December would be bitter, but many of us may have taken the prediction with a truckload of salt.’ Last night the Met Office confirmed it had passed on the advice, but a spokesman denied that withholding it from the public was motivated by embarrassment.
‘We did brief the Cabinet Office in October on what we believed would be an exceptionally cold and long winter,’ she said. ‘Despite media claims to the contrary, the decision not to publish any more seasonal forecasts came after we undertook public research about the way in which we deliver the weather.
‘It was the public who decided that a monthly outlook would be more useful than a seasonal forecast to give a general indication of what the weather will be like for the following month.’ The Met office was widely criticised in 2009 for predicting a barbecue summer which turned out to be a washout. Mr Harrabin, who made his comments in the Radio Times, is one of the BBC’s most respected figures.
He has been reporting on the environment for more than 20 years and lectures at Oxford and Cambridge universities. His claims come after the forecaster was criticised for its advocacy of climate change.
Campaigners have claimed it has become too interested in calling for action to cut carbon emissions. They say it is in thrall to a belief that temperatures will rise in the long term, and so has neglected its focus on accurate short and medium term forecasts. The BBC announced last year that it was considering dropping the Met Office as its official forecaster after 87 years. But in July it decided to extend the contract for a further five years.
The Cabinet Office said that Met Office forecasts are shared ‘as appropriate’ but could not say if roads authorities, airports and water companies had been passed the explicit deep freeze alert. A spokesman said: ‘The Met Office provides the Government with regular updates throughout the year to inform short, medium and longer term planning. This information is shared as appropriate between departments and with local responders.
‘Government departments have, since winter 2009, continued to enhance preparedness and build resilience, informed by Met Office advice as well as the recommendations from David Quarmby’s review into last winter’s disruption and Dame Deirdre Hine’s review of the 2009 swine flu pandemic.’
Read more. See also post in nature News with comments by Julia Slingo, chief scientist of UKMO here.
No comment is really necessary. However, can you imagine if someone in private industry didn’t tell his clients what he or she truly thought and was as wrong as the UKMO has been. Back in 1996, I was part of a team that launched a cable Weather Network in the UK. The UKMO had decided it could commercialize some of its data - radar and METEOSAT satellite imagery. We bought radar and satellite from them. But during our weekend launch and the following Monday (a Bank Holiday), the radar and satllite link was not working. We finally reached them on Tuesday and were informed that a server was down and they were shocked we didn’t underestand it was a Bank Holiday weekend so they were not staffed. Again private industry operates 24x7 including holidays. BTW, The Weather Channel which had similar cable ambitions, bought our operations and merged it with theirs. But with the operations in expensive downtown London, operating costs were so high (10 times higher than our effort), they abandoned service within a year. Another in a long list of TWC fiascos.
December 2010 Blizzard Timelapse from Michael Black on Vimeo.
Note: 32 inches fell.
UPDATE: Note an historic middle January period of extreme cold and snow appears likely for the United States and Eurasia. More to follow.
----------------
By Larry Solomon, The National Post
[SPPI Note: Also see the Dennis Ambler SPPI report.
How do we know there’s a scientific consensus on climate change? Pundits and the press tell us so. And how do the pundits and the press know? Until recently, they typically pointed to the number 2500 - that’s the number of scientists associated with the United Nations Intergovernmental Panel on Climate Change. Those 2500, the pundits and the press believed, had endorsed the IPCC position.
To their embarrassment, most of the pundits and press discovered that they were mistaken - those 2500 scientists hadn’t endorsed the IPCC’s conclusions, they had merely reviewed some part or other of the IPCC’s mammoth studies. To add to their embarrassment, many of those reviewers from within the IPCC establishment actually disagreed with the IPCC’s conclusions, sometimes vehemently.
The upshot? The punditry looked for and recently found an alternate number to tout - “97% of the world’s climate scientists” accept the consensus, articles in the Washington Post and elsewhere have begun to claim.
This number will prove a new embarrassment to the pundits and press who use it. The number stems from a 2009 online survey of 10,257 earth scientists, conducted by two researchers at the University of Illinois. The survey results must have deeply disappointed the researchers - in the end, they chose to highlight the views of a subgroup of just 77 scientists, 75 of whom thought humans contributed to climate change. The ratio 75/77 produces the 97% figure that pundits now tout.
The two researchers started by altogether excluding from their survey the thousands of scientists most likely to think that the Sun, or planetary movements, might have something to do with climate on Earth - out were the solar scientists, space scientists, cosmologists, physicists, meteorologists and astronomers. That left the 10,257 scientists in disciplines like geology, oceanography, paleontology, and geochemistry that were somehow deemed more worthy of being included in the consensus. The two researchers also decided that scientific accomplishment should not be a factor in who could answer - those surveyed were determined by their place of employment (an academic or a governmental institution). Neither was academic qualification a factor - about 1,000 of those surveyed did not have a PhD, some didn’t even have a master’s diploma.
To encourage a high participation among these remaining disciplines, the two researchers decided on a quickie survey that would take less than two minutes to complete, and would be done online, saving the respondents the hassle of mailing a reply. Nevertheless, most didn’t consider the quickie survey worthy of response - just 3146, or 30.7%, answered the two questions on the survey:
1. When compared with pre-1800s levels, do you think that mean global temperatures have generally risen, fallen, or remained relatively constant?
2. Do you think human activity is a significant contributing factor in changing mean global temperatures?
The questions were actually non-questions. From my discussions with literally hundreds of skeptical scientists over the past few years, I know of none who claims that the planet hasn’t warmed since the 1700s, and almost none who think that humans haven’t contributed in some way to the recent warming - quite apart from carbon dioxide emissions, few would doubt that the creation of cities and the clearing of forests for agricultural lands have affected the climate. When pressed for a figure, global warming skeptics might say that human are responsible for 10% or 15% of the warming; some skeptics place the upper bound of man’s contribution at 35%. The skeptics only deny that humans played a dominant role in Earth’s warming.
Surprisingly, just 90% of those who responded to the first question believed that temperatures had risen - I would have expected a figure closer to 100%, since Earth was in the Little Ice Age in the centuries immediately preceding 1800. But perhaps some of the responders interpreted the question to include the past 1000 years, when Earth was in the Medieval Warm Period, generally thought to be warmer than today.
As for the second question, 82% of the earth scientists replied that that human activity had significantly contributed to the warming. Here the vagueness of the question comes into play. Since skeptics believe that human activity been a contributing factor, their answer would have turned on whether they consider a 10% or 15% or 35% increase to be a significant contributing factor. Some would, some wouldn’t.
In any case, the two researchers must have feared that an 82% figure would fall short of a convincing consensus - almost one in five wasn’t blaming humans for global warming - so they looked for subsets that would yield a higher percentage. They found it - almost - in those whose recent published peer-reviewed research fell primarily in the climate change field. But the percentage still fell short of the researchers’ ideal. So they made another cut, allowing only the research conducted by those earth scientists who identified themselves as climate scientists.
Once all these cuts were made, 75 out of 77 scientists of unknown qualifications were left endorsing the global warming orthodoxy. The two researchers were then satisfied with their findings. Are you?
LawrenceSolomon@nextcity.com. Lawrence Solomon is executive director of Energy Probe and the author of The Deniers.
See SPPI blog post here.
Posted on WUWT, December 29, 2010 by Verity Jones
BBC news has reported that 40,000 homes are still without water in Northern Ireland after the recent spell of freezing temperatures. Many have been without water for more than 10 days, and reservoirs are being drained due to an unprecedented number of leaks since the thaw. Calls to a few friends confirmed that, yes, it is bad - friends in Lisburn have been without water since Christmas Eve due to a frozen mains supply (i.e. not in their house); others in Belfast report low water pressure. Water is being rationed in places.
Was it really that cold? A search of the BBC site revealed “‘Baltic’ Northern Ireland” tucked away on the BBC NI news page. Castlederg in the West of the province recorded a low of -18C on 20th December - a new record. The thing about Ireland is that it sits on the very western fringes of Europe, bathed by the warm Gulf Stream (which is why Doug Keenan considered the 7000 years of Irish tree ring data so important that he pursued Queen’s University through FOI requests). Ireland, despite its latitude, just doesn’t do ‘very cold’ (or ‘very hot’ for that matter).
When I first got interested in climate I ended up corresponding with Tonyb about the temperature records of the Armagh Observatory in Northern Ireland. These stretch back to 1796. How does this current cold month compare with the historical record at Armagh? Was the recent cold unprecedented?
The currently incomplete December record for Armagh consists of raw data - three automated readings per hour. Rather than waiting until they calculate the December average I looked for nearby stations on Weather Underground and found Glenanne PWS, about 15km to the SW of Armagh. The average temperatures for the two stations over the month of November is plotted in Figure 1. This gave a good linear fit (R^2 = 0.889) with an offset - Armagh being on average colder by just over 1C.
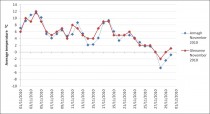
Figure 1. Average temperatures for Armagh and Glenanne N. Ireland through November 2010 (enlarged here).
Figure 2 shows the December data for Glenanne on the same scale. Up to the 28th December, the monthly average is -0.86C. Mild conditions are expected for the next three days and, if I plug the forecast max/min (29th 8/6; 30th 8/4; 31st 6/2) into my spreadsheet to complete the month, the monthly average rises to an estimated -0.23C for Glenanne, remembering that this is an approximation for Armagh, which is typically colder.
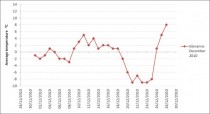
Figure 2. Average temperatures for Glenanne N. Ireland through December 2010 (enlarged here).
In the Armagh historical record, which I have for 1796-2002 from [1] the average temperature for December is 4.9C; January average is colder (4.1C). There are just two individual months colder than December 2010: January 1814 (-2.2C) and January 1881 (-0.9C) which puts this one as the third coldest on record at Armagh (2010 might yet tie with 1881 when the actual average for the month is published).
Coldest months according to the Armagh record:
1.January 1814 -2.2C
2.January 1881 -0.9C
3.December 2010 -0.2C
4.February 1855 0.0C, January 1963 0.0C
5.February 1895 0.2C
6.February 1947 0.4C
7.January 1985 0.5C, December 1878 0.5C
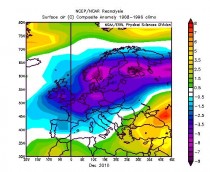
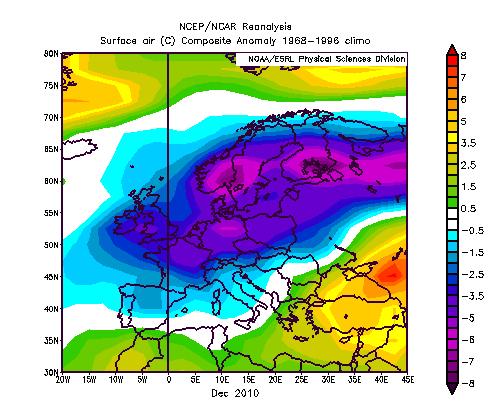
The list above also puts it in perspective with respect to other extreme years in living memory - most notably 1963 and 1947. According to the Armagh records none of the coldest months in these years saw such extreme cold as the Christmas period this year. The Arctic cold cut though the mild Atlantic air this year resulting in a monthly average 4-5C below normal (Figure 3).
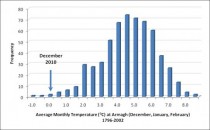
Figure 3. Enlarged here.
Even without all the warming we have been led to expect ![]() December’s cold probably can be described as unprecedented. I’ll await with interest the actual December figures for Armagh (and those from the Met Office). As for this being caused by global warming - bull - it was just an extreme weather event. They happen. Go back >100 years and they happened then too.
December’s cold probably can be described as unprecedented. I’ll await with interest the actual December figures for Armagh (and those from the Met Office). As for this being caused by global warming - bull - it was just an extreme weather event. They happen. Go back >100 years and they happened then too.
Reference
[1] C.J. Butler, A. M. García-Suárez, A.D.S. Coughlin and C. Morrell. Air Temperatures at Armagh Observatory, Northern Ireland, from 1796 to 2002 Int.J.Climatol. 25: 1055-1079 (2005) [Full paper]
UPDATE - from the Daily Mail (h/t Spectator in Tips & Notes). Looks as if this will be a similar record in other parts of the UK too:
“Met Office figures show that the average temperature from December 1, the first day of winter, to December 28 was a bitter minus 0.8C (30.5F). This equals the record December low of 1890.”
The article goes on to point out that December is rarely the coldest month in the UK and a continued cold spell could beat the record set in 1683-84 of -1.17C.
-----------
The first of many official reports from around the country and world of a brutal, even coldest ever December is here in South Florida.
By Dr. Don Easterbrook
1934 has long been considered the warmest year of the past century. A decade ago, the closest challenger appeared to be 1998, a super-el nino year, but it trailed 1934 by 0.54C (0.97F). Since then, NASA GISS has “adjusted” the U.S. data for 1934 downward and 1998 upward (see December 25, 2010 post by Ira Glickstein) in an attempt to make 1998 warmer than 1934 and seemingly erased the original rather large lead of 1934 over 1998.
The last phases of the strong 2009-2010 El Nino in early 2010 made this year another possible contender for the warmest year of the century. However, December 2010 has been one of the coldest Decembers in a century in many parts of the world, so 2010 probably won’t be warmer than 1998. But does it really matter?
Regardless of which year wins the temperature adjustment battle, how significant will that be? To answer that question, we need to look at a much longer time frame-centuries and millennia.
One of the best ways to look at long-term temperatures is with isotope data from the GISP2 Greenland ice core, from which temperatures for thousands of years can be determined. The ice core isotope data were obtained by Minze Stuiver and Peter Grootes from nuclear accelerator measurements of thousands of oxygen isotope ratios (16O/18O), which are a measure of paleo-temperatures at the time snow fell that was later converted to glacial ice. The age of such temperatures can be accurately measured from annual layers of accumulation of rock debris marking each summer’s melting of ice and concentration of rock debris on the glacier.
The past century
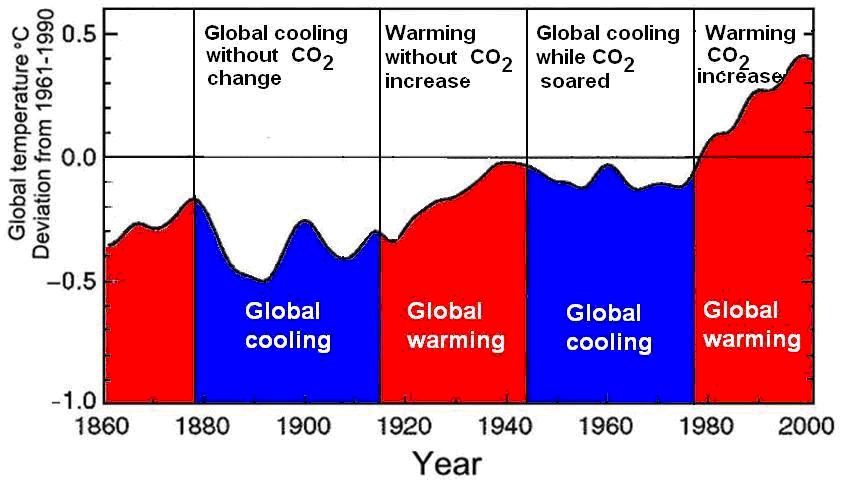
Two episodes of global warming and two episodes of global cooling occurred during the past century:
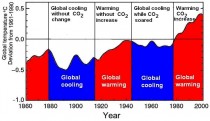
Figure 1. Two periods of global warming and two periods of global cooling since 1880. Enlarged here.
1880 to 1915 cool period. Atmospheric temperature measurements, glacier fluctuations, and oxygen isotope data from Greenland ice cores all record a cool period from about 1880 to about 1915. Many cold temperature records in North America were set during this period. Glaciers advanced, some nearly to terminal positions reached during the Little Ice Age about 400 years ago. During this period, global temperatures were about 0.9C (1.6F) cooler than at present. From 1880 to 1890, temperatures dropped 0.35C (0.6F) in only 10 years. The 1880-1915 cool period shows up well in the oxygen isotope curve of the Greenland Ice Sheet.
1915 to 1945 warm period
Global temperatures rose steadily in the 1920s, 1930s, and early 1940s. By the mid-1940s, global temperatures were about 0.5C (0.9F) warmer than they had been at the turn of the century. More high temperature records for the century were recorded in the 1930s than in any other decade of the 20th century. Glaciers during this warm period retreated, temperatures in the 1930s in Greenland were warmer than at present, and rates of warming were higher (warming 4C (7F) in two decades). All of this occurred before CO2 emissions began to soar after 1945, so at least half of the warming of the past century cannot have been caused by manmade CO2.
1945 to 1977 cool period
Global temperatures began to cool in the mid-1940’s at the point when CO2 emissions began to soar. Global temperatures in the Northern Hemisphere dropped about 0.5C (0.9F) from the mid-1940s until 1977 and temperatures globally cooled about 0.2C (0.4F). Many of the world’s glaciers advanced during this time and recovered a good deal of the ice lost during the 1915-1945 warm period. Many examples of glacial recession cited in the news media show contrasting terminal positions beginning with the maximum extent at the end of the 1880-1915 year cool period and ending with the minimum extent of the recent 20 year warm period (1977-1998). A much better gauge of the effect of climate on glaciers would be to compare glacier terminal positions between the ends of successive cool periods or the ends of successive warm periods.
1977 to 1998 global warming
The global cooling that prevailed from ~1945 to 1977 ended abruptly in 1977 when the Pacific Ocean shifted from its cool mode to its warm mode in a single year and global temperatures began to rise, initiating two decades of global warming. This sudden reversal of climate in 1977 has been called the
“Great Pacific Climate Shift” because it happened so abruptly. During this warm period, alpine glaciers retreated, Arctic sea ice diminished, melting of the Greenland Ice Sheet occur.
The abruptness of the shift in Pacific sea surface temperatures and corresponding change from global cooling to global warming in 1977 is highly significant and strongly suggests a cause-and-effect relationship. The rise of atmospheric CO2, which accelerated after 1945 shows no sudden change that could account for the “Great Pacific Climate Shift”.
1999 to 2010 global cooling
No global warming has occurred above the 1998 level and temperatures have declined slightly.
The past 500 years
Temperature oscillations recorded in Greenland ice cores over the past 500 years (Fig. 2) are truly remarkable. At least 40 periods of warming and cooling have occurred since 1480 AD, all well before CO2 emissions could have been a factor.
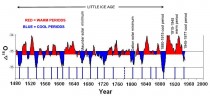
Figure 2. Warming and cooling periods from 1480 to 1960 AD. Enlarged here.
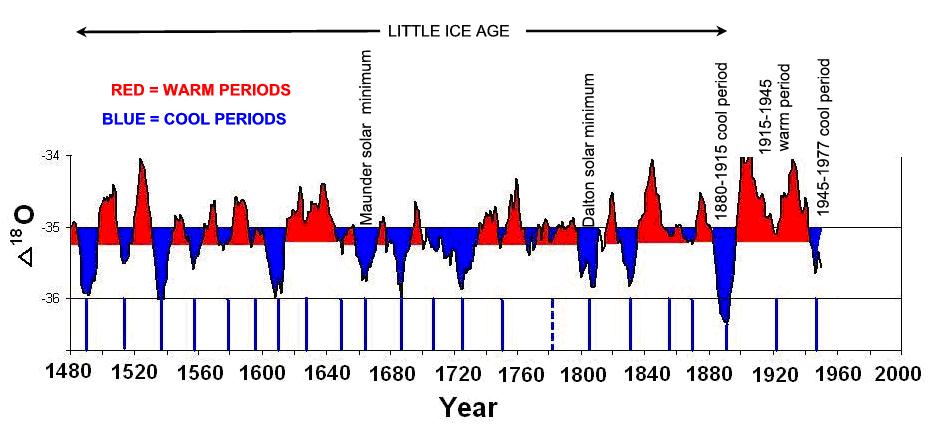
The past 5,000 years
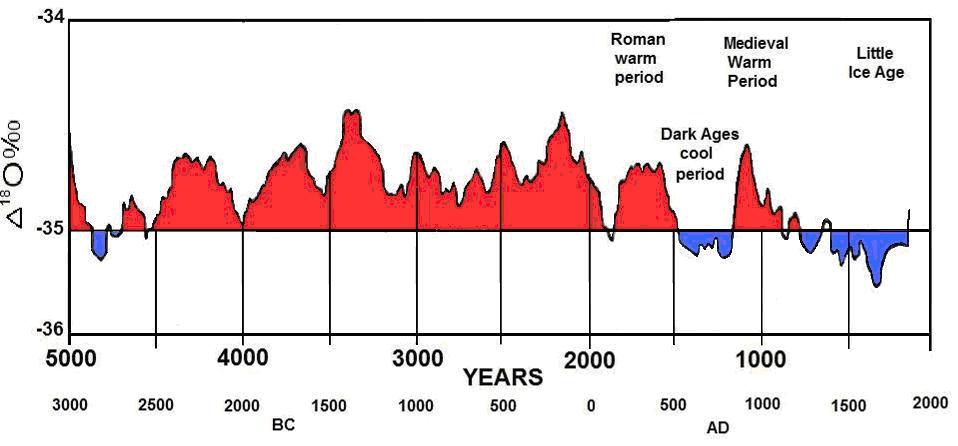
Figure 3 shows oxygen isotope ratios from the GISP2 Greenland ice core for the past 5,000 years. Note that temperatures were significantly warmer than present from 1500 to 5000 years ago.
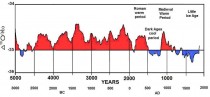
Figure 3. Oxygen isotope ratios for the past 5,000 years. Red areas are warm periods, blue areas are cool periods. Enlarged here.
The past 10,000 years
Most of the past 10,000 have been warmer than the present. Figure 4 shows temperatures from the GISP2 Greenland ice core. With the exception of a brief warm period about 8,200 years ago, the entire period from 1,500 to 10,500 years ago was significantly warmer than present.
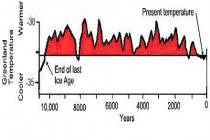
Figure 4. Temperatures over the past 10,500 years recorded in the GISP2 Greenland ice core. (Modified from Cuffy and Clow, 1997)
Enlarged here.
Another graph of temperatures from the Greenland ice core for the past 10,000 years is shown in Figure 5. It shows essentially the same temperatures as Cuffy and Clow (1997) but with somewhat greater detail. What both of these temperature curves show is that virtually all of the past 10,000 years has been warmer than the present.
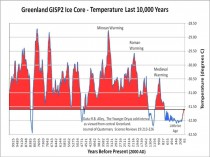
Figure 5. Temperatures over the past 10,000 years recorded in the GISP2 Greenland ice core. Enlarged here.
So where do the 1934/1998/2010 warm years rank in the long-term list of warm years? Of the past 10,500 years, 9,100 were warmer than 1934/1998/2010. Thus, regardless of which year ( 1934, 1998, or 2010) turns out to be the warmest of the past century, that year will rank number 9,099 in the long-term list. The climate has been warming slowly since the Little Ice Age (Fig. 5), but it has quite a ways to go yet before reaching the temperature levels that persisted for nearly all of the past 10,500 years. It’s really much to do about nothing. PDF
Headline 2000: “Snowfalls are now just a thing of the past”By Marlo Lewis
On March 20, 2000, The Independent, a British newspaper, reported that “Snowfalls are just a thing of the past.” Global warming was simply making the UK too warm for heavy snowfalls. The column quotes Dr. David Viner of the Climatic Research Unit (CRU) of the University of East Anglia - yes, the epicenter of what would become the Climategate scandal - as saying that within a few years snowfall will become “a very rare and exciting event.” Indeed, Viner opined, “Children just aren’t going to know what snow is.”
Icecap Note: The Union of Confused Concerned Scientists said in 2004 Scientists claim winters becoming warmer and less snowy.
Similarly, David Parker, at the UK’s Hadley Centre for Climate Prediction and Research, said that eventually British children could have only “virtual” experience of snow via movies and the Internet.
Well, last week another British newspaper, the Daily Mail, reported ”The Coldest December since records began as temperatures plummet to minus 10C bringing travel chaos across Britain.” Here’s a snippet from the article (also excerpted by Wesley J. Smith in First Things):
Swathes of Britain skidded to a halt today as the big freeze returned - grounding flights, closing rail links and leaving traffic at a standstill. And tonight the nation was braced for another 10 in of snow and yet more sub-zero temperatures - with no let-up in the bitterly cold weather for at least a month, forecasters have warned. The Arctic conditions are set to last through the Christmas and New Year bank holidays and beyond and as temperatures plummeted to -10C (14F) the Met Office said this December was ‘almost certain’ to become the coldest since records began in 1910.
Meanwhile, back in the USA, the lead item in Google News is a Bloomberg story, “Snow Blankets US East Coast, Stranding Travelers.” Bloomberg reports that, “New York City’s Central Park had 20 inches (51 centimeters) of snow by 8 a.m., the most for the month in 62 years.” This was “the most snow in the park for any December since 1948, the agency’s website showed.” (Icecap Note: Over 30 inches fell in parts of New Jersey)
As in the UK, the record-breaking snowfall is disrupting transportation, keeping travelers snowbound and delaying Santa’s deliveries. It’s also downing power lines and turning off the Christmas lights. Some highlights:
“More than 6,000 flights were canceled in the region since yesterday as airports closed.”
“The day after Christmas is one of the five busiest shopping days of the year, and it may take retailers two weeks to capture sales lost yesterday,” an industry analyst told Bloomberg.
“NJ Transit, which transports about 170,000 commuters to and from New York City daily, suspended bus service as of 8:30 p.m. yesterday, according to a statement.”
“Four hundred subway passengers were aboard an A train that was stuck in Queens for more than six hours, until it could be pushed to a station by another train. The Coney Island area was without subway service.”
“Consolidated Edison Inc. reported there were 6,167 customers in Queens, New York, and 1,811 in Westchester County without power.”
“National Grid Plc, which provides electricity in New York and Massachusetts, was reporting power outages at 14 sites throughout New York and Massachusetts affecting about 29,727 homes and businesses. The largest was in Norfolk, Massachusetts, where 10,902 customers were without power.”
Hemispheric snowcover December 26, 2010 enlarged here.
As my colleague Heritage Foundation economist David Kreutzer observed at a panel discussion, winter is the biggest climate-related threat to public health and welfare!
Britain has had three snowy winters in a row, and this year’s Snowmageddon USA follows last year’s Snowpocalypse. Despite global warming, it seems, our children may never enjoy either Florida’s balmy weather in New York and Boston or Mediterranean “liveability” in the British isles. Post here.
See Bryan Walsh of Time magazine’s predictable annual alarmist story blaming the northeast snow on global warming. The ideologs are never wrong.
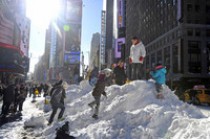
Times Square, New York, December 28, 2010

Brooklyn Street
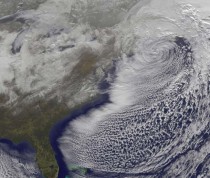
The storm from space on Monday afternoon.
See also how Tucker Carlson Mocks Environmentalist For Believing Global Warming ‘Spaceship’ Theory here. In the debate Chris Horner and Carlson frustrate Betsy Rosenberg who tries to defend herself about the cold and snow being caused by global warming and claiming 97% of scientists agreed.
In actual fact, Dennis Ambler reported on that ‘survey’ on SPPI here. Ambler wrote “… they originally contacted 10,257 scientists, of whom 3,146 responded, less than a 31% response rate. Of that number, only 5% described themselves as climate scientists, numbering 157. The authors reduced that by half by only counting those who they classed as “specialists”.
“In our survey, the most specialized and knowledgeable respondents (with regard to climate change) are those who listed climate science as their area of expertise and who also have published more than 50% of their recent peer-reviewed papers on the subject of climate change (79 individuals in total). Of these specialists, 96.2% (76 of 79) answered “risen” to question 1 and 97.4% (75 of 77) answered yes to question 2.” So the world’s scientists boiled down to just a selection of 79 respondees.
The survey questions:
1. When compared with pre-1800s levels, do you think that mean global temperatures have generally risen, fallen, or remained relatively constant?
This is quite banal and shows the desperation of those involved in this “unbiased survey of a large and broad group of Earth scientists.” Has it got warmer since pre-1800 levels? This really depends on the time period referred to. Do they mean the Little Ice Age, when disastrously cold temperatures caused massive loss of life and untold hardship? Of course temperatures are now warmer than that desperate period in climate history. Is that what they would wish to regard as normal?
2. Do you think human activity is a significant contributing factor in changing mean global temperatures?
This is the classic closed question, in that it implies mean global temperatures are being changed and someone must be responsible. The response to this question was 75 specialists out of 77, so here we have our massive 97%.
I WOULD ANSWER YES TO QUESTIONS 1 and 2. For question 1, we obviously are warmer than the Little Ice Age. The human activity in question 2 being some combination of UHI/land use changes and the manipulation by Hansen, Jones, Karl, etc.
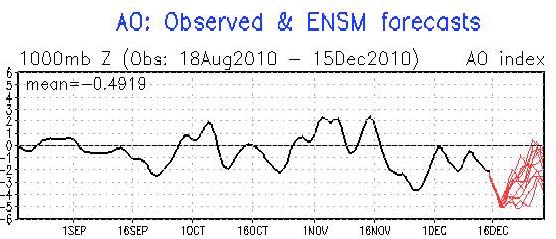
By Joseph D’Aleo, CCM
The warming NASA remarked about in the story below this fall in northeast Canada and Hudson Bay is part of the very strong negative arctic oscillation pattern we have seen the last few years, in part related to the long solar minimum and high latitude volcanoes.
Enlarged here.
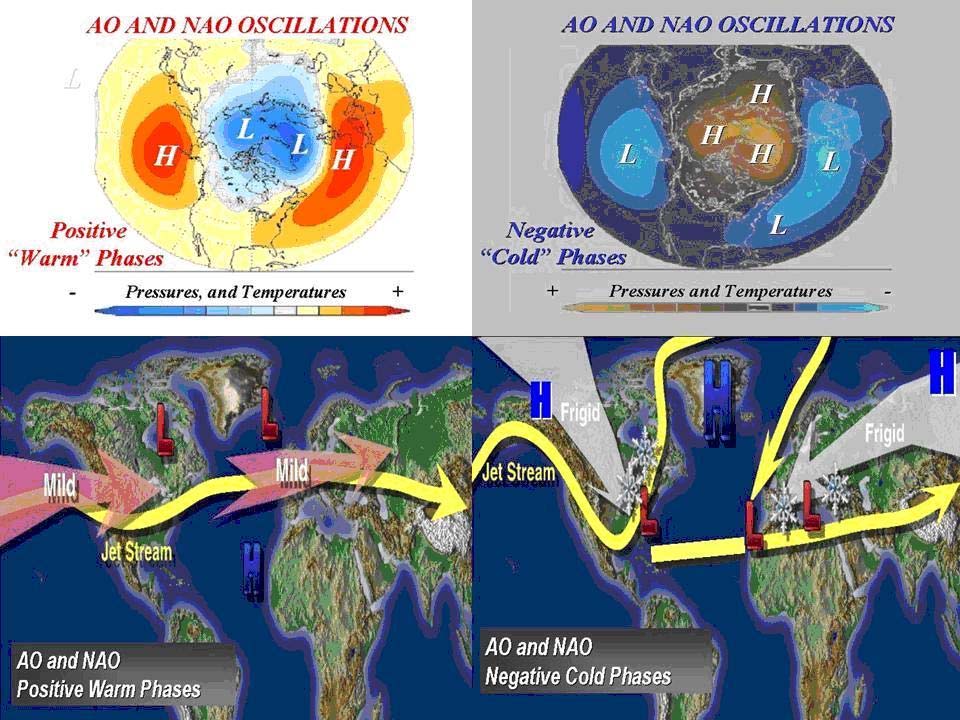
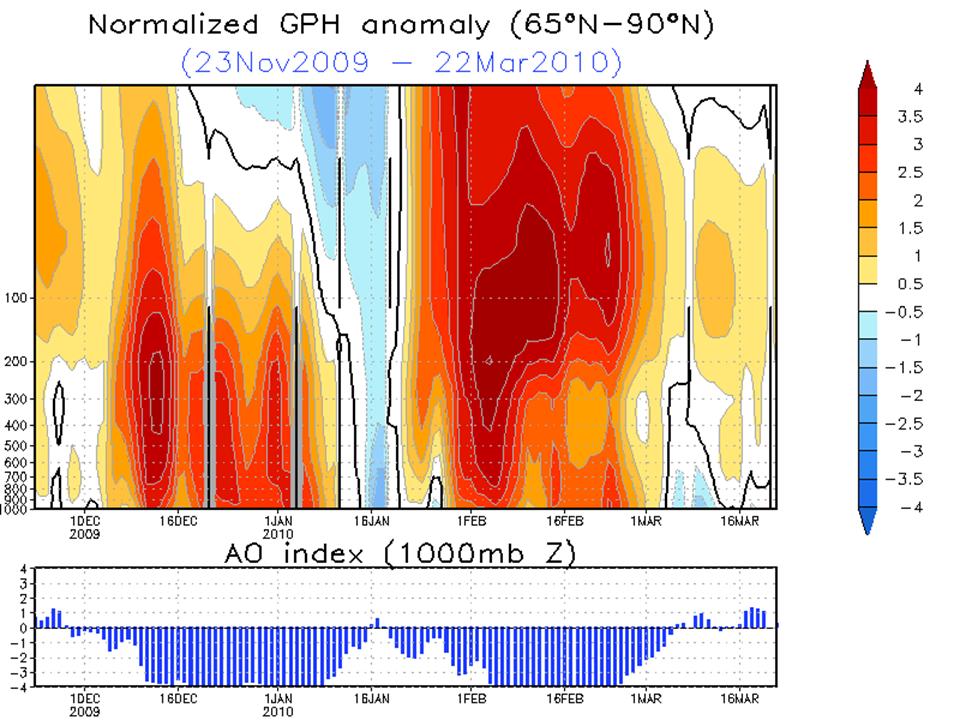
Last winter saw the most negative AO of the record back to 1950. It persisted in the negative state from early December to the first day of spring.
Enlarged here.
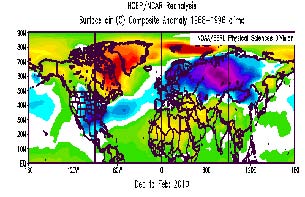
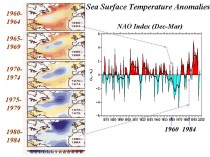
The global anomalies with a negative winter AO are as follows:

Enlarged here.
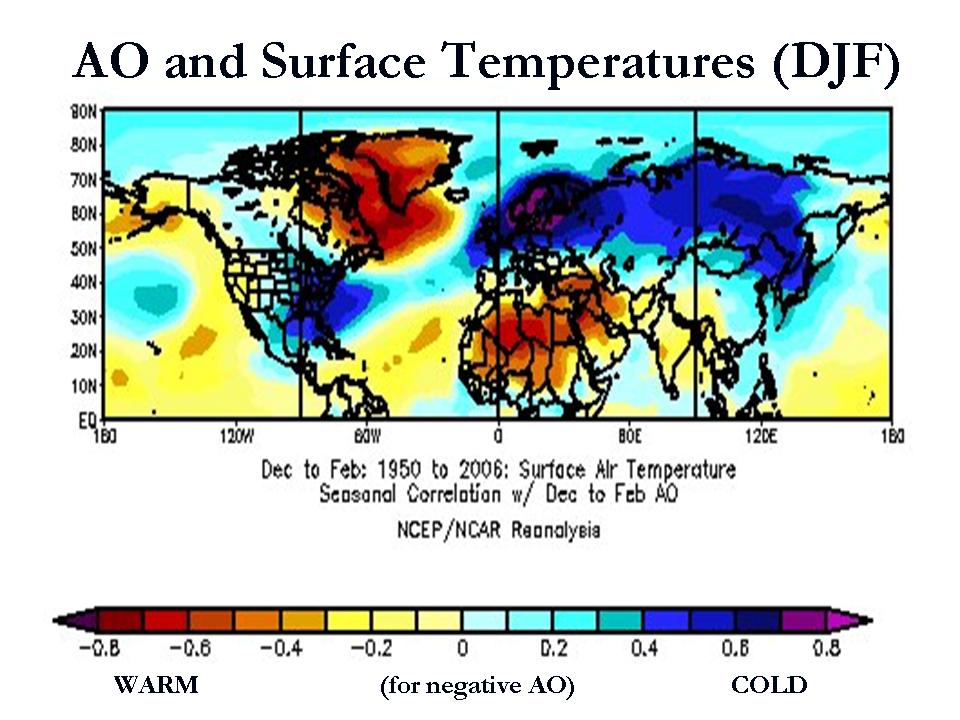
See how well that verified this past winter. No GHGs need apply.

Enlarged here.
NOTE AMAZINGLY how even though we have replaced the strong El Nino with a strong La Nina, the result so far has been virtually the same for the start of the Northern Hemisphere winter. It is even colder in the southeast US, in Alaska and India. In the southern Hemisphere note the cold December to date in Australia and much of South America (the start of their summer). Summer snow even fell in southeast Australia.
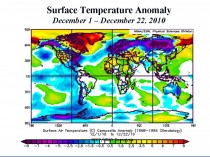
Enlarged here.
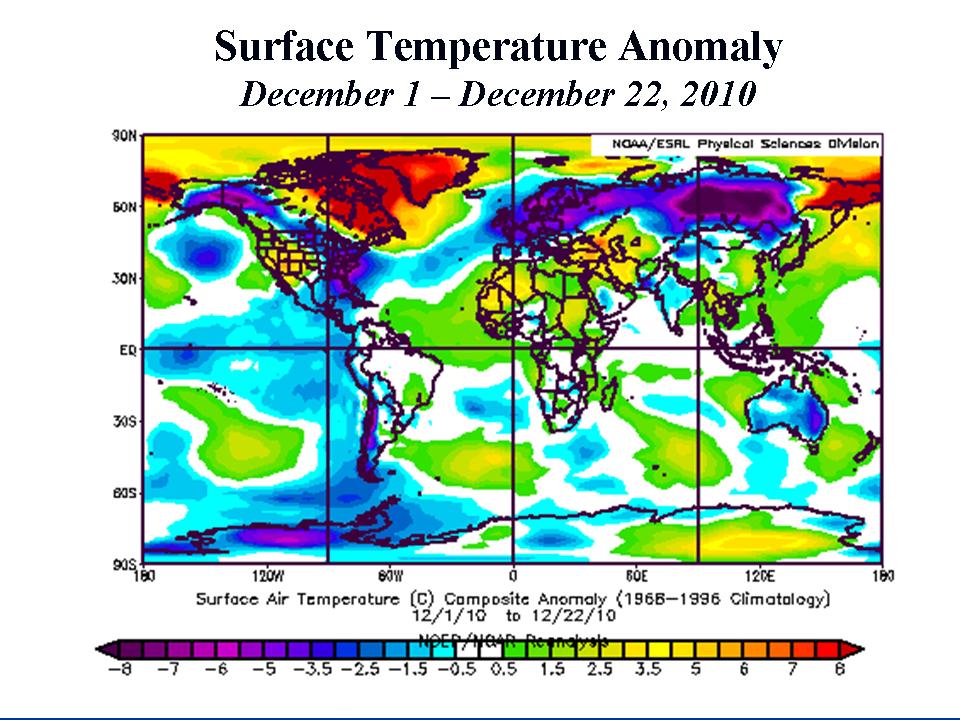
The cross section through the polar region last year (above, enlarged here) showed the strong stratospheric warming favored in low solar east QBO (Quasi-biennial Oscillation) winters.
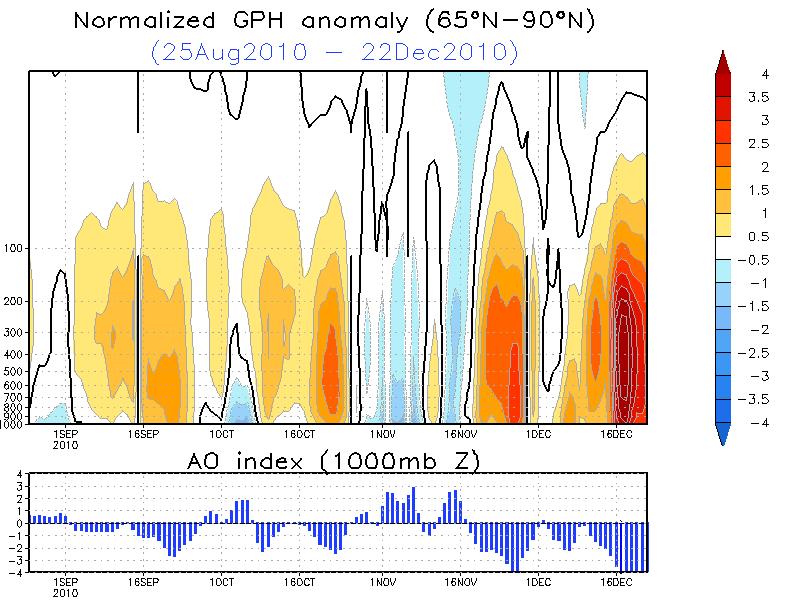
This year the QBO is west, which doesn’t favor stratospheric warmings but doesn’t prohibit polar warming in the troposphere (like we saw in 1995/96). This blocking then is more intermittent with blocks moving west being absorbed into the upstream mid latitude ridges and then reloading in the eastern Atlantic to Scandinavia and retrogressing westward. You can see that here in the cross section through the third week of December.
Enlarged here.
Note the AO is again off the charts (5 STD negative at times). It is forceast to diminish but then reload in a few weeks. Note also how the warmth is lower, at pressures above 100 mb compared to last year. To be effective in our weather it has to reach down to jet stream and middle troposphere - the case in both years.
At the end of blocking episodes when the blocks enter Canada, often there is a major nor’easter along the east coast as is forecast the next few days. The storm that will become the nor’easter brought a rare white Christmas to parts of the southeast. In Europe, snow and cold continues to disrupt holiday travel by air, rail and road.
By Joseph D’Aleo, CCM
In a recent post to counter the snow and cold in the news that was spoiling the announcement by Dr. Hansen that it was the warmest year on record, NASA GISS authors note for November:
“Northern Europe had negative anomalies of more than 4C, while the Hudson Bay region of Canada had monthly mean anomalies greater than +10C. The extreme warmth in Northeast Canada is undoubtedly related to the fact that Hudson Bay was practically ice free. It is for this reason that some of the largest positive temperature anomalies on the planet occur in the Arctic Ocean as sea ice area has decreased in recent years.
The cold anomaly in Northern Europe in November has continued and strengthened in the first half of December. Combined with the unusual cold winter of 2009-2010 in Northern Hemisphere mid-latitudes, this regional cold spell has caused widespread commentary that global warming has ended. That is hardly the case.”
Enlarged here.
See in this Steve Goddard post here how Hansen blamed the cooling in recent years on La Nina but now has decided this El Nino warming is global greenhouse warming.
Bob Tisdale has relevant posts on Watts Up With That that here shows how NASA GISS removed Arctic and Southern Ocean sea surface temperature data and then used 1200km smoothing that uses land stations to refill in the data (resulting in a warming) -note also shown by Steve Goddard here - and here how leftover warm ater from a strong El Nino gets spun up into the Kuroshio-Oyashio Extension (KOE) where it continues to release heat to help explain why the ‘global warmth’ has persisted into the early stages of the current La Nina.
Even Kevin Trenberth, head of climate analysis at the National Center for Atmospheric Research in Colorado, admitted here: “We have seen rapid warming recently, but it is an example of natural variation that is associated with changes in the Pacific rather than climate change.”
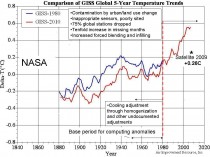
We have shown how NASA and the other data centers have mined the data for warmth and manipulated the data - new and old - to enhance the apparent warming. This includes a cooling (up to a quarter degree or more celsius) of the pesky warm period from the 1920s to 1950s right up to 1980. This includes the NASA GISS base period for anomalies of 1951 to 1980. Numerous data issues post 1980 have exaggerated the warmth.
Enlarged here.
The warming NASA remarked about this fall in northeast Canada and Hudson Bay is part of the very strong negative arctic oscillation pattern we have seen the last few years, in part related to the long solar minimum and high latitude volcanoes.
Enlarged here.
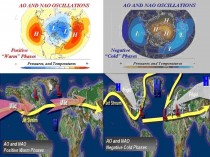
The positive AO state is characterized by an anomalously strong polar vortex that traps cold air in high latitude and more zonal mid-latitude jet stream that allows maritime Pacific air to invade North America and Atlantic air to flood Europe often as far east as the Urals. In the negative mode, high pressure dominates the polar region and North Atlantic, shunting arctic air south in North America and Siberian air west to Western Europe.
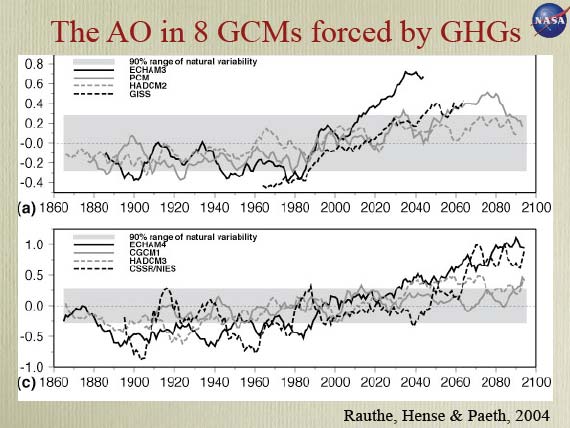
The greenhouse models all predict an increase in the frequency and strength of the positive arctic oscillation in time, most (2/3rds) exceeding the 90% range of natural variability.

Enlarged here.
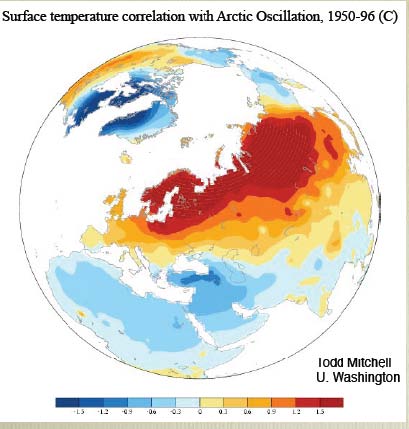
A positive AO would lead to increasing temperatures in the Northern Hemisphere continents with colder than normal air trapped in the arctic down to the northern parts of Canada and Hudson Bay. The following from Mitchell shows the warmth over Eurasia in the positive AO phase.

Enlarged here.
Last winter saw the most negative AO of the record back to 1950. It persisted in the negative state from early December to the first day of spring.
Enlarged here.
The global anomalies with a negative winter AO are as follows:
Enlarged here.
See how well that verified this past winter. No GHGs need apply.
Enlarged here.
As noted, the North Atlantic Oscillation, an important component of the overall arctic oscillation varies with the ocean temperature tripole in the Atlantic, known as the AMO or Atlantic Multidecadal Oscillation. When the Atlantic is in the warm positive AMO mode as is currently the case, the NAO and AO tend to be more negative.
Enlarged here.
When the AMO is positive with warm water in the North Atlantic and in the Tropical Atlantic, the NAO was mainly negative (1960s). When the North and Tropical Atlantic turned cold in the 1980s, the NAO was mainly positive (data in chart above through 1999). Note the AMO flipped positive (warm) in 1995 with a big dip in the NAO. See the inverse relationship with the AO in the graph below. Data for both is averaged for the December through March periods and standardized.
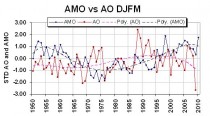
Enlarged here.
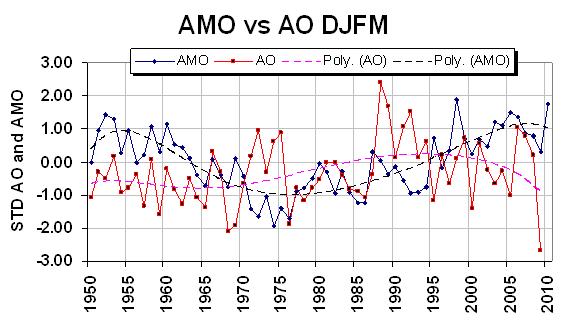
So far this late fall, the AO has been mainly negative and forecast by the model ensembles overnight to reach 5 standard deviations negative the next few days.
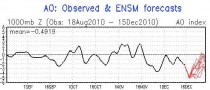
Enlarged here.
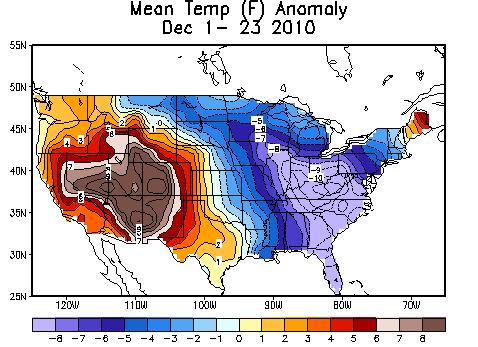
This explains not only the brutal cold in Europe and Asia but also the amazing 11F negative anomalies in the southeastern United States where they have had frosts and freezes for the fourth straight winter - including three La Ninas and one El Nino.

Enlarged here.
PDF here.
Merry Christmas!!! And during this joyous holiday, remember the true meaning and give thanks and praise.

Also appropriate see the RealCatholicTV.com’s “Global Warming Unmasked, the Real Agenda”. Are the environmental movements and groups simply devoted to laudable, correct stewardship of God’s creation, or do they have a more sinister, hidden agenda? Is “global warming” being used as an excuse for something far darker? Is the final goal of the liberal elites behind the push of junk science population control, eugenics and Gaia worship? See this hour long, well researched video here. You may have to purchase the DVD or sign up online to see the full presentation. Whatever your religion or whether or not you are religious, you can appreciate the effort done here, that very few in the mainstream media dare to undertake. Too often they simply are enablers for the enviros, corporate and government opportunists with a very sinister agenda or agendas.
-------------
HockeySchtick
A peer-reviewed paper published today in the Journal of Geophysical Research finds that reconstructions of total solar irradiance (TSI) show a significant increase since the Maunder minimum in the 1600’s during the Little Ice Age and shows further increases over the 19th and 20th centuries. The TSI is estimated to have increased 1.25 W/m2 since the Maunder minimum as shown in the first graph below. Use of the Stefan-Boltzmann equation indicates that a 1.25 W/m2 increase in solar activity could account for an approximate .44C global temperature increase [the HADCRU global warming from 1850 to 2000 is .55C].
A significant new finding is that portions of the more energetic ultraviolet region of the solar spectrum increased by almost 50% over the 400 years since the Maunder minimum (second graph below). This is highly significant because the UV portion of the solar spectrum is the most important for heating of the oceans due to the greatest penetration beyond the surface and highest energy levels. Solar UV is capable of penetrating the ocean to depths of several meters to cause ocean heating. whereas long wave infrared emission from “greenhouse gases” or the sun is only capable of penetrating the ocean surface a few microns with all energy lost to the phase change of evaporation with no net heating of the ocean. Solar UV irradiance also “exerts control over chemical and physical processes in the Earth’s upper atmosphere” such as ozone levels.
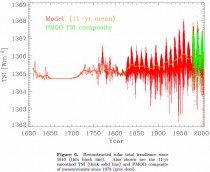
Total Solar Irradiance (TSI) reconstruction, enlarged here
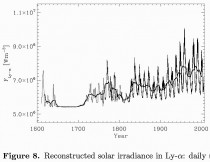
Reconstructed solar irradiance in the ultraviolet Ly-a band at 121.6 nm shows almost 50% increase (enlarged here).
JOURNAL OF GEOPHYSICAL RESEARCH, VOL. 115, A12112, 11 PP., 2010 doi:10.1029/2010JA015431
Reconstruction of solar spectral irradiance since the Maunder minimum
By N. A. Krivova, L. E. A. Vieira, S. K. Solanki
Solar irradiance is the main external driver of the Earth’s climate. Whereas the total solar irradiance is the main source of energy input into the climate system, solar UV irradiance exerts control over chemical and physical processes in the Earth’s upper atmosphere. The time series of accurate irradiance measurements are, however, relatively short and limit the assessment of the solar contribution to the climate change. Here we reconstruct solar total and spectral irradiance in the range 115–160,000 nm since 1610.
The evolution of the solar photospheric magnetic flux, which is a central input to the model, is appraised from the historical record of the sunspot number using a simple but consistent physical model. The model predicts an increase of 1.25 W/m2, or about 0.09%, in the 11-year averaged solar total irradiance since the Maunder minimum. Also, irradiance in individual spectral intervals has generally increased during the past four centuries, the magnitude of the trend being higher toward shorter wavelengths. In particular, the 11-year averaged Ly-α irradiance has increased by almost 50%. An exception is the spectral interval between about 1500 and 2500 nm, where irradiance has slightly decreased (by about 0.02%). See post here.
full paper
By Jeff Poor, The Daily Caller
Much of the United States and Europe is suffering through extreme wintery weather conditions. But what is causing it?
Some have blamed global warming, specifically the “Arctic paradox.” However, AccuWeather’s chief hurricane and long-range forecaster Joe Bastardi told the Fox Business Network on Tuesday you can chalk it up to three things - oceans, sunspots and volcanoes.
“A few years ago, about why we have to start looking for more and more of this [cold weather],” Bastardi said. “It’s called the triple crown of cooling - the natural reversal of the oceans cycles. Three years ago the Pacific went into the cold state. Solar activity, very low sunspot activity and volcanic activity, not the kind you see in the tropics but the kind we had in the Arctic regions a couple of winters ago - and this is something that could be causing a return to for instance, the times of the Victorian era when they used to have ice fairs in the early-1800s around Christmastime on the Thames and you’re seeing that type of thing go on.”
As for those who are blaming global warming, Bastardi said that theory was childish and presented instead the possibility of long-term global cooling.
“Well, I’ve been saying what I believe is going on is this is the big debate between the natural cycles and the forces of AGW [anthropogenic global warming] - by the way, these folks claiming that global warming is causing severe cold is like the kid on the playground who doesn’t get his way and takes his ball home. The fact of the matter is the forecast that was made by this forecaster three years ago that we we’re going to start seeing these things because of this and it opens up the big debate - are the natural cycles taking over and are we going to see cooling over the next 20 to 30 years? You see, we started measuring temperatures with satellite at the end of the last cold cycle in the Pacific. We had nothing but warm in the Pacific and warm in the Atlantic. What’s going to happen to the temperatures if the oceans are warm? Now that they’re cooling let’s see what’s going to happens in the next 20 to 30 years.”
He said that the unseasonably cold winter is something that could be predicted and told viewers not to just blame global warming.
“This is predictable if you study cycles, if you study climatology,” Bastardi said. “And don’t just say everything is global warming.”
But, Bastardi also warned of a drought that will in cause higher commodity prices.
“I think the southern plains of the United States are starting evolve a drought now,” Bastardi said. “This dryness that you’re seeing in Texas I think will evolve into spring and summer time and Texas, Oklahoma, Arkansas into the lower Mississippi valley looked to me to be very dry this upcoming summer” See post here.
Icecap Note: We agree with Joe. The ‘arctic paradox’ is a new term (sounds technical excuse) for a phenomenon that real forecasters have known and used for years. The Arctic Oscillation (AO) and North Atlantic Oscillation are behind the cold winters. They are tied to the Atlantic and to a lesser degree Pacific temperatures, both of which undergo multidecadal cycles (60-70 years). The favored states of the AO and NAO are tied to the phases of these long term oscillations. The long term ocean cycles are natural changes and linked to variations in the meandering thermohaline circulation likely tied to solar influences. They behave predictably and indeed were used by Dr. Bill Gray to predict the increase in hurricane activity starting in 1995. Greenhouse gases have zero to do with these cycles. Sorry Gavin, try again.
Syun-Ichi Akasofu
ABSTRACT
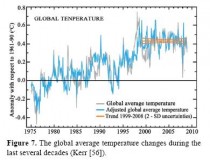
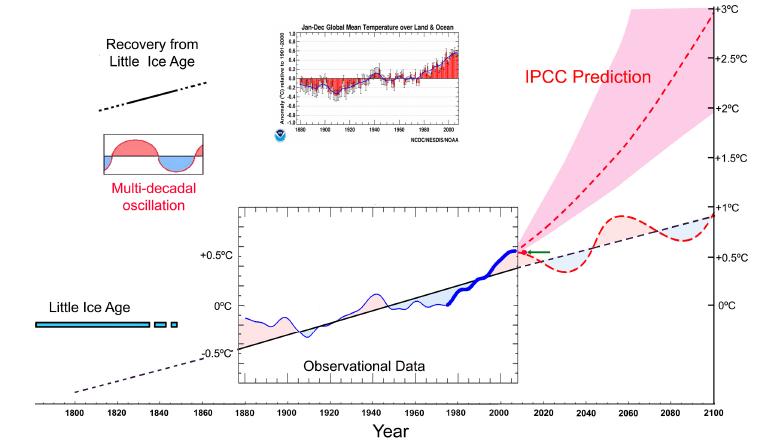
A number of published papers and openly avail-able data on sea level changes, glacier retreat, freezing/break-up dates of rivers, sea ice retreat, tree-ring observations, ice cores and changes of the cosmic-ray intensity, from the year 1000 to the present, are studied to examine how the Earth has recovered from the Little Ice Age (LIA). We learn that the recovery from the LIA has proceeded continuously, roughly in a linear manner, from 1800-1850 to the present.
The rate of the recovery in terms of temperature is about 0.5C/100 years and thus it has important im-plications for understanding the present global warming. It is suggested, on the basis of a much longer period data, that the Earth is still in the process of recovery from the LIA; there is no sign to indicate the end of the recovery before 1900. Cosmic-ray intensity data show that solar activity was related to both the LIA and its recovery.
The multi-decadal oscillation of a period of 50 to 60 years was superposed on the linear change; it peaked in 1940 and 2000, causing the halting of warming temporarily after 2000. These changes are natural changes, and in order to determine the contribution of the manmade greenhouse effect, there is an urgent need to identify them correctly and accurately and remove them from the present global warm-ing/cooling trend.
Enlarged here.
In Section 3, we suggested that the prominent ‘fluctuations’ superposed on the linear recovery are the multi-decadal oscillation. Figure 4(d) shows its rate of changes. From Figures 4(c) and 4(d), the multi-decadal oscillation peaked in 1940, and the temperature actually decreased from the level of the linear increase from 1940 to 1975 and then increased after 1975 to 2000.
Thus, it may be speculated that the situation in 2000 is similar to that in 1940, so that it is predicted that the temperature change will be flat or in a slightly declining trend during the next 30 years or so (see Section 6 and Figure 9). That is to say, the halting does not mean the end of the recov-ery from the LIA. The halting after 2000 can be ob-served in sea level change (Nerem et al), a decrease of the heat content of the oceans (Pielke, Sr.) and other factors.
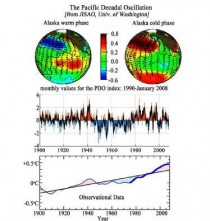
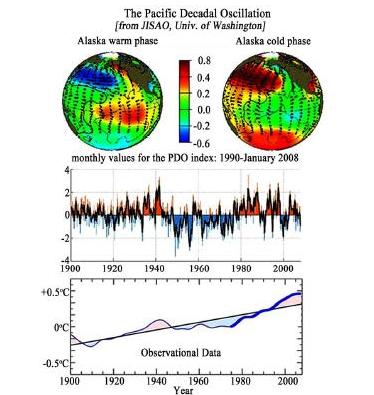
The multi-decadal oscillation can be seen in other phenomena. Figure 8 shows the pattern of the Pacific Decadal Oscillation (PDO), which is a natural phe-nomenon (University of Washington. Top part shows the observed wind pattern over the Pacific Ocean. The middle part shows the PDO index. It is interesting to note a striking resemblance of changes between PDO and the multi-decadal oscillation (at the bottom, Figure 4(c) is reproduced for comparison.). Although there is some phase difference between them, this similarity supports the inference that the fluctuations superposed on the linear change (the recovery from the LIA) are in part the multi-decadal oscillation. The Pacific Ocean is large enough to contribute to the global average tem-perature. Polyakov et al. showed that the Arctic Ocean shows a similar trend.
Enlarged here.
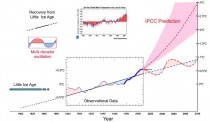
Figure 9. Enlarged here. The figure shows that the linear trend between 1880 and 2000 is a continuation of recovery from the LIA, together with the superposed multi-decadal oscillation. It shows also the predicted temperature rise by the IPCC after 2000. It is as-sumed that the recovery from the LIA would continue to 2100, together with the superposed multi-decadal oscillation. This view could explain the halting of the warming after 2000. The observed temperature in 2008 is shown by a red dot with a green arrow. It has been suggested by the IPCC that the thick blue line portion was caused mostly by the greenhouse effect, so their future prediction is a sort of extension of the blue line.
CONCLUSIONS
In this paper we learned:
1) The Earth experienced the Little Ice Age (LIA) between 1200-1400 and 1800-1850. The temperature during the LIA is expected to be 1C lower than the pre-sent temperature. The solar irradiance was relatively low during the LIA.
2) The gradual recovery from 1800-1850 was ap-proximately linear, the recovery (warming) rate was about 0.5C/100 years. The same linear change continued from 1800-1850 to 2000. In this period, the solar irradiance began to recover from its low value during the LIA.
3) The recovery from the LIA is still continuing today.
4) The multi-decadal oscillation is superposed on the linear change. The multi-decadal oscillation peaked in about 1940 and also in 2000, causing the temporal halt-ing of the recovery from the LIA.
5) The negative trend after the peak in 1940 and 2000 overwhelmed the linear trend of the recovery, causing the cooling or halting of warming.
6) The view presented in this paper predicts the temperature increase in 2100 to be 0.5C plus/minus 0.2C, rather than 4C plus/minus 2.0C predicted by the IPCC.
PDF open accessible here.
By P Gosselin on 14. December 2010
We know that more and more temperature stations have been sited in urban areas over the last few decades, and surely this has had an impact on the measurement of the globe’s temperature. But not to worry, say scientists, the raw data have been homogenized in order to compensate for this.

Elevated temperatures in urban environments. (Photo: NASA)
Have they compensated enough? Just how much uncertainty is in the land-based temperature record for the last 50 years? A new report from NASA shows some results that I think are surprising.
Summer land surface temperature of cities in the Northeast were an average of 7C to 9C (13F to 16F) warmer than surrounding rural areas over a three year period, the new research shows. The complex phenomenon that drives up temperatures is called the urban heat island effect.
Dr. Marc Imhoff, leader of the study, says that urban areas located in forested regions have a much more pronounced urban heating effect than in desert areas. Adjustment is neither an easy nor accurate task (emphasis added):
However, accurate comparisons have long eluded scientists because ground-based air temperature sensors tend to be unevenly distributed and prone to local bias. The lack of quantifiable definitions for urban versus non-urban areas has also hindered comparisons
But thanks to satellites, progress is being made in understanding the urban heat island effect. Satellite data have been used to compare various urban settings. Ping Zhang, a scientist at Goddard and a lead author of the research:
“This, at least to our knowledge, is the first time that anybody has systematically compared the heat islands of a large number of cities at continental and global scales,”
Research by NASA scientists shows that compact urban areas have a higher urbean heat island effect that sprawling cities, and depend greatly on the surrounding environment, as mentioned above.
Taking the UHI effect has been the subject of much controversy over the years. This new study shows that it may have been signficnatly understated, at least in some areas.
Providence, R.I.; Washington, D.C.; Philadelphia, Pa.; Baltimore, Md.; Boston, Ma.; and Pittsburgh, Pa.; had some of the strongest heat islands of the 42 northeastern cities analyzed.
These 3 examples have all trended upwards over the last 30 or 40 years. The actual siting and history of each station would have to be examined individually. So one can imagine what a mess this is and how arbitrary all this could be. Here we can be thankful for satellites.
The warming indeed is man-made, but in a different sense. The urban warming is what has impacted people in the summertime, especially at night.
The U.S. Environmental Protection Agency estimates that, between 1979 and 2003, heat exposure has caused more than the number of mortalities resulting from hurricanes, lightning, tornadoes, floods, and earthquakes combined.
“It is the lack of cooling at nighttime, rather than high daytime temperatures, that poses a health risk,” said Benedicte Dousset, a scientist from the University of Hawaii who also presented data about heat islands at the AGU meeting.
Urban planners will have to take this into account when designing cities in the future. Trees, trees and more trees can help a lot. Meanwhile, all this leaves James Hansen with a pile of almost useless data. See full post and images here. H/T Marc Morano
Icecap Note: See this Icecap post under About Climate Change on Urban Heat Island Contamination. It is also discussed in detail in the body of this SPPI special report with Joseph D’Aleo and Anthony Watts with help of many other scientists and in some of the case studies. Also SPPI has posted this report by former NASA scientist Dr. Ed Long comparing raw and modified urban and rural stations.
The study also calls into serious question, the decisions by NOAA and CRU to exclude an urban adjustment (assume it can be accounted for with only an additional 0.05C/century uncertainty).
The U.S. Should Halt All Funding For U.N.’s ‘Global Warming’ ScamBy Phyllis Schlafly, Investor’s Business Daily
The global warming prophets and propagandists, who enjoy living in style on other people’s money, gathered last month in the plush resort of Cancun, Mexico, where January temperatures usually hover around 80 degrees. God must have a sense of humor because Cancun was hit by its coldest temperature in a hundred years.
The first day of the conference featured an address from Mexico’s President Felipe Calderon, who spoke with much concern about global warming and the damage that humans are perpetrating on the planet.
He cited the deaths of 60 people in Mexico because of weather extremes, but didn’t mention Mexico’s 22,000 deaths caused by the illegal drug trade.
U.N. Secretary General Ban Ki-moon announced that “we need to fundamentally transform the global economy, based on low-carbon, clean-energy resources.” Barack Obama’s announced goal of fundamentally transforming the United States has morphed into transforming the world.
This 16th annual conference of the United Nations Framework Convention on Climate Change (UNFCCC), called COP 16 (Conference of the Parties 16), attracted some 20,000 delegates from 194 countries.
It had little to do with any science about climate change and everything to do with trying to get the United States and other industrialized nations to redistribute their wealth to the poorer nations under the supervision of eager United Nations bureaucrats.
Like previous climate change conferences, COP 16 deliberately pitted the poor countries against the rich countries, encouraging the poor countries to demand what the rich countries have without earning or paying for it.
This is the internationalist version of the basic Marxist tactic called the class war.
COP 16 propagandists blame every human tragedy on the high standard of living enjoyed (and earned) by the rich countries.
Our over-consumption is alleged to cause global warming. We are guilty because we are prosperous, so we supposedly owe reparations to the poor nations.
At COP 15 in Copenhagen a year ago, the poor countries ganged up on us and agreed that the United States should create a $30 billion “Fast Start” global climate fund by 2012 and reduce U.S. greenhouse gases by 17% below the 2005 levels.
This Fast Start climate fund would be committed to grow to $100 billion by 2020.
Fortunately, the Copenhagen proposals were never formally adopted. President Obama came and left empty-handed, Communist China refused to limit its emissions, and the Third World dictators didn’t get the $100 billion handouts they expected.
The poor countries now say they want cash handouts, not loans, because they don’t want to take on any debt. They also floated a scheme to force 37 industrialized nations to transfer their technologies along with huge financial bonuses to the poorer 155 nations.
Donations to the Fast Start Fund are not coming in as rapidly as the avaricious countries want, so COP 16 participants decided it’s time to call for a global tax.
They want it to be unlimited in scope and unlinked to national treasuries so that tax receipts can flow without the nuisance of having to be approved by the rich countries’ legislatures.
The U.N. Secretary General’s High Level Advisory Group confirmed that the goal is to impose taxes on international shipping, aviation and financial transactions involving stocks, bonds and foreign exchanges, as well as a carbon tax.
Those taxes could raise at least $100 billion annually, and the International Maritime Organization is ready to be the assessor-collector.
COP 16 agitators consider all these payments compensatory for damages caused by the rich nations. The World Wildlife Foundation estimates that the amounts needed to protect against climate change will run to $160 billion to $200 billion yearly by 2020.
COP 16’s bag of tricks also includes plans for global governance.
The new UNFCCC executive secretary, Christiana Figueres, said that COP 16 “is a litmus test for global governance capacity” and that “Cancun will be successful if governments compromise” by launching “a new era.” The poor nations at COP 16 presented a document called “Declaration From the South-South Summit on Climate Justice and Finance.”
It claimed that climate change is “an economic and social crisis, a political crisis, a food and energy crisis, and an ecological crisis.” This diatribe called for “climate justice, ecological justice, economic justice, gender justice and historical justice.” Its presenters concluded by chanting, “Let’s globalize the struggle!”
The main cause of poverty in other countries is the lack of enough energy. We should be increasing the use of energy rather than expanding government powers to restrict energy.
Tell your newly elected members of Congress that we reject all COP 16 demands as well as the insulting proposition that our successful economic system caused the world’s poverty. If poor countries want to be rich, the way to go is to follow our American model for success, freedom and prosperity. See more and comments here.