


World Climate Report
Over the past decade, considerable debate existed regarding the temperature history of the Earth on the time scale of millennia. If you followed our (WCR) discussion on the subject, you know that one camp would like you believe that the highly-publicized warming of the planet over the past century is absolutely unprecedented over the past few thousand years. This group seems to fixate on the “hockey stick” representation of the temperature history of the past 1,000 years, and they hold on to the stick in spite of evidence to the contrary. Many others have argued based on proxy evidence throughout the world that the past few thousand years include a very warm period 1,000 years ago and a cold period 500 years ago; in their eyes, the warming of the past century is not at all unusual. These folks even go on to suggest that the Earth today may not be yet as warm as conditions 1,000 years ago, despite the 100 ppm increase in atmospheric carbon dioxide over the past century.
Several articles have appeared in Energy and Environment recently with results of considerable interest to us at World Climate Report. The first piece is by Dr. Craig Loehle who received his Ph.D. in mathematical ecology in 1982 from Colorado State University. Loehle gathered as many non-tree ring reconstructions as possible for places throughout the world. There are dozens of very interesting ways to peer into the climatic past of a location, and Loehle included borehore temperature measurements, pollen remains, Mg/Ca ratios, oxygen isotope data from deep cores or from stalagmites, diatoms deposited on lake bottoms, reconstructed sea surface temperatures, and so on. Basically, he grabbed everything available, so long as it did not rely on trees (about which Loehle and World Climate Report show “are not simple thermometers”!)
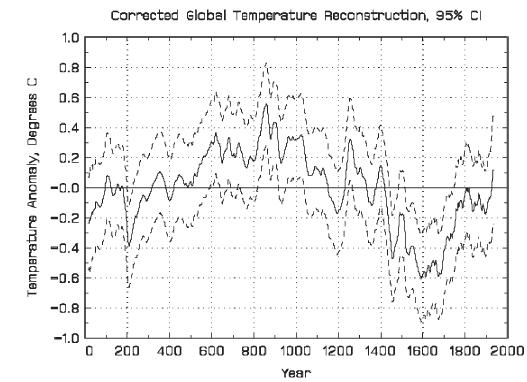
Following publication of the first article, several errors came to light regarding how temperatures were reported from the various locations. In the second paper, Loehle and co-author J. Huston McCulloch decided to re-do all the calculations, including improvements in terms of confidence intervals. The improved plot below shows little change from the graph above, although for data reasons, the last point now represents the 29-year average temperature centered on 1935. The two statistical wizards note “The corrected data continue to show the Medieval Warm Period (MWP) and Little Ice Age (LIA) quite clearly.” The confidence intervals “indicate that the MWP was significantly warmer than the bimillennial average during most of approximately 820-1040 AD, at the 5% level (2-tailed). Likewise, the LIA was significantly cooler than the bimillennial average during most of approximately 1440-1740 AD.”

See full size image here
We suspect you have been living your life unaware of the articles by Loehle and McCulloch. The reason is obvious - they found evidence that temperature variations over the past 2,000 years indicate that the earth’s average temperature bounces around naturally to a larger degree than other paleo-reconstructions indicate, and further, that temperatures about 1,000 years ago were not that dissimilar to today’s temperatures. This suggests that the earth’s ecosystems are more resilient (and adaptive) than some pessimists give them credit for - not a favorite topic in the mainstream press.
Madison Passes Record SnowfallBy Cara Harshman, Badger Herald
Last night’s snowfall sent Madison’s winter total plowing into the record books, breaking the all-time snowfall record of 76.1 inches in 1978-79. “Anytime you set records, it is sort of a momentous occasion, but it doesn’t mean anything more than we’ll be out just like any other storm,” said Madison streets superintendent Al Schumacher. Jon Martin, University of Wisconsin chair of the atmospheric and ocean sciences department said there is a lot of variability from one winter to another, and it is difficult to put a finger on why this winter has been so snowy. “This is a very abnormal winter,” Martin said. “We break the all-time snowiest winter record, and we still have 5 or 6 weeks left for possible snow.”
Since Dec. 1, it has snowed 41 times in Madison, taking a toll on everyone in the city, especially streets employees working 16-hour days plowing streets and fixing potholes, Schumacher said. This is one of those winters we are not going to see again, Martin said, with continuously cold temperatures and very few rainy days. Cold temperatures carried by northwesterly winds have not ceased all winter. Madison has not seen westerly or southwesterly winds that would bring warmer temperatures. “We may crush this thing,” Martin said, referring to the snowfall record. “That’s what I’m hoping for, because all of us who live through this will have seen the greatest snowfall in our lifetimes, especially if we get to 100 inches.” See full story here. See also the official NWS report here.
Icecap Note: Record or near record snows will be reported in many spots in the midwest before it is over. See this story about Rockford, Illinois which has the most snowfall to date and after today’s storm will rank only behind 1978/79. Also see Tom Skilling’s blog on how snow days and zero degree days are running twice the long-term average. See also how this cold spell set a record in the “Nation’s Icebox”, International Falls, MN here. See snow depths across Iowa, also hard hit this winter here.
A light to moderate snow event early in the week is likely to propel Madison to a new seasonal snowfall record. As of February 8, 2008, the total of 75.6” was just 0.6 inches shy of the record set in the harsh winter of 1978/79 and 0.4 from the old-time winter of 1885/86 (you all remember that one).
Below is a list of the top 10 winter season snowfall amounts for Madison, Wisconsin
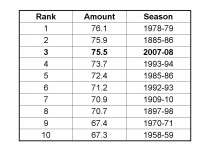
See official NWS statement here.
By Anthony Watts, Watts Up With That
There have been a number of indications that January 2008 has been an exceptional month for winter weather in not only North America, but the entire Northern Hemisphere.
We’ve had anecdotal evidence of odd weather in the form of wire reports from Saudi Arabia, Iraq, and China where record setting cold and snow has been felt with intensity not seen for 30-100 years, depending on the region. From our remote sensing groups, we have reports of significant negative anomalies in both the RSS and UAH global satellite data for the lower troposphere. Then there’s NOAA’s announcement that January 2008, was below 20th century averages, plus news that Arctic sea ice has quickly recovered from the record low extent of Summer 2007.
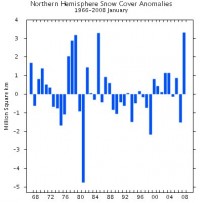
Now to add to this, we have images and reports from NOAA and Rutgers University of large anomalies of snow cover extent for the northern hemisphere in January 2008. Rutgers Global Snow Lab has an anomaly graph and it shows January 2008 had the largest areal Northern Hemisphere snow cover for the period of 1966-2008, just slightly larger than the previous largest anomaly of January, 1984. Finally, there’s the massive La Nina said to be the driver of all this but may be a harbinger of a more permanent phase shift according to veteran forecaster Joe Bastardi. Icecap Note: and discusssed in detail in the blog post below.
Yes, we live in interesting times. Read more here.
By Joseph D’Aleo, CCM
Early in January 2007, the Phil Jones of the UK Hadley center predicted that 2007 would be the warmest on record due to the El Nino, which some scientists including Hansen predicted could be the strongest in history. Well of course the El Nino quickly faded and La Nina slowly came on during 2007. Temperatures globally cooled, starting in the Southern Hemisphere winter and then transitioning into the Northern Hemisphere winter. At the end of the year, the Hadley center announced it was the 7th warmest, blaming the oncoming La Nina for the cooling and busted forecast. This January, MSU satellite data indicated the globe was cooler than the 1979-98 average for the first time in years.
With the recent global cooling that is the result of the moderate to strong La Nina, I thought I would again look at the last decade and see how well the global temperatures reacted to the transition from a super El Nino in 1997/98 to La Ninas from 1998 to 2000/2001, an El Nino in 2002/03 and borderline El Ninos in 2003/04 and 2004/05 and again 2006/07 followed by the return of La Nina in 2007/08/. I used the MSU lower tropospheric temperatures and the Multivariate ENSO Index of Wolter.
Temperatures track well with the ENSO state as indicated by the MEI. There is an apparent lag of 2 or more months of temperature to the MEI. With a 2 year lag applied, the Pearson correlation of the raw (unsmoothed data sets) is 0.67 (r-squared of 0.45). For the same time period, the CO2 correlation is only 0.07 (r-squared of 0.005).
See how the ENSO (El Nino and La Nina) frequency relates to the Pacific Decadal Oscillation which has turned negative here. As to whether this strong La Nina and strongly negative PDO this winter marks the start of the new cold period or just another false alarm like 1998-2001, the next year or so will tell. The last three PDO phases each lasted 25-30 years and we are 30 years since the last change called the Great Pacific Climate Shift so it appears this time, the change may be for real. If indeed the sun which many solar scientists believe is about to go into a quiet mode seen only seen every 200 to 400 years, is much weaker this upcoming cycle, this may be very interesting indeed.
By N.F. Glasser and T.A. Scambos
Global warming may not be entirely to blame for the collapse of an Antarctic ice shelf in 2002, according to research published today. The 10,000-year-old Larsen B ice shelf was initially believed to be a victim of climate change. But a paper published in the Journal of Glaciology claims the shelf had been teetering on collapse for decades. Professor Neil Glasser, of Aberystwyth University, the paper’s lead author, said cracks and fault lines in the ice had significantly weakened the structure. “A number of other atmospheric, oceanic and glaciological factors are involved. For example, the location and spacing of fractures on the ice shelf such as crevasses and rifts are very important too because they determine how strong or weak the ice shelf is.”
From their abstract: We define domains on the ice shelf related to glacier source areas and demonstrate that, prior to collapse, the central Larsen B ice shelf consisted of four sutured flow units fed by Crane, Jorum, Punchbowl and Hektoria/Green/Evans glaciers. Between these flow units were ‘suture zones’ of thinner ice where the feeder glaciers merged. Prior to collapse, large open-rift systems were present offshore of Foyn Point and Cape Disappointment. These rifts became more pronounced in the years preceding break-up, and ice blocks in the rifts rotated because of the strong lateral shear in this zone. We suggest that the ice shelf was preconditioned to collapse by partial rupturing of the sutures between flow units. See full paper here.
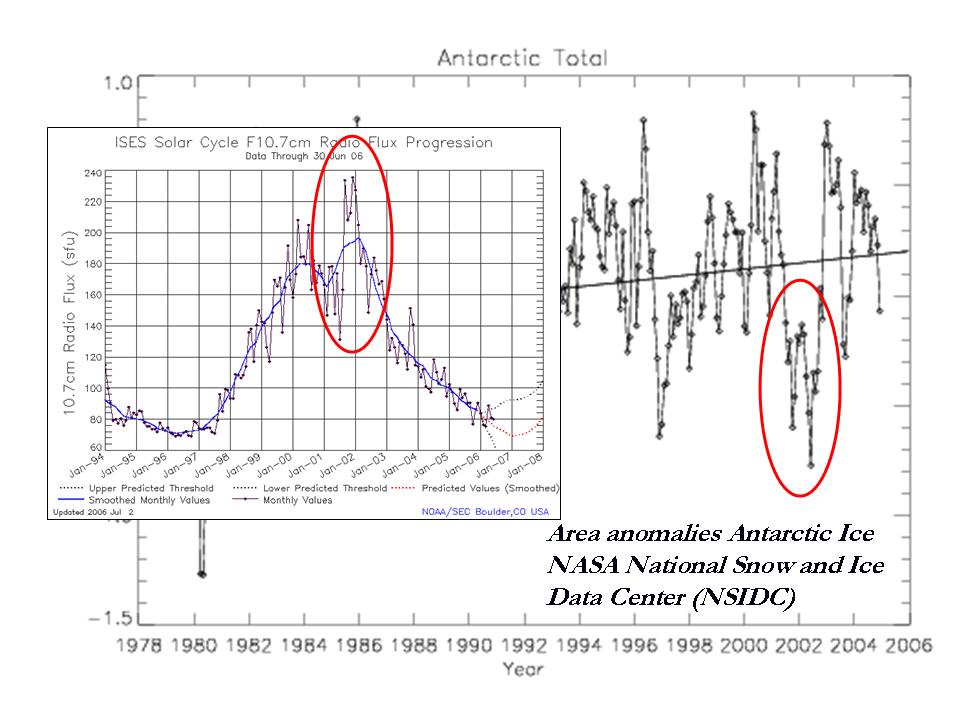
Icecap Note: The breakdown in 2002 as the authors showed may have had its seeds in antecedent conditions which affected the ice-shelf’s structure and stability. A factor that may be pertinent to the timing of that break-up was the high solar flux, second solar cycle max that occurred from September 2001 to April 2002. Notice in the image below the coincident timing of the high flux and ice decline.
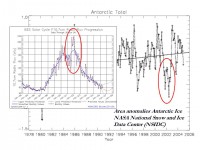
See full size image here.
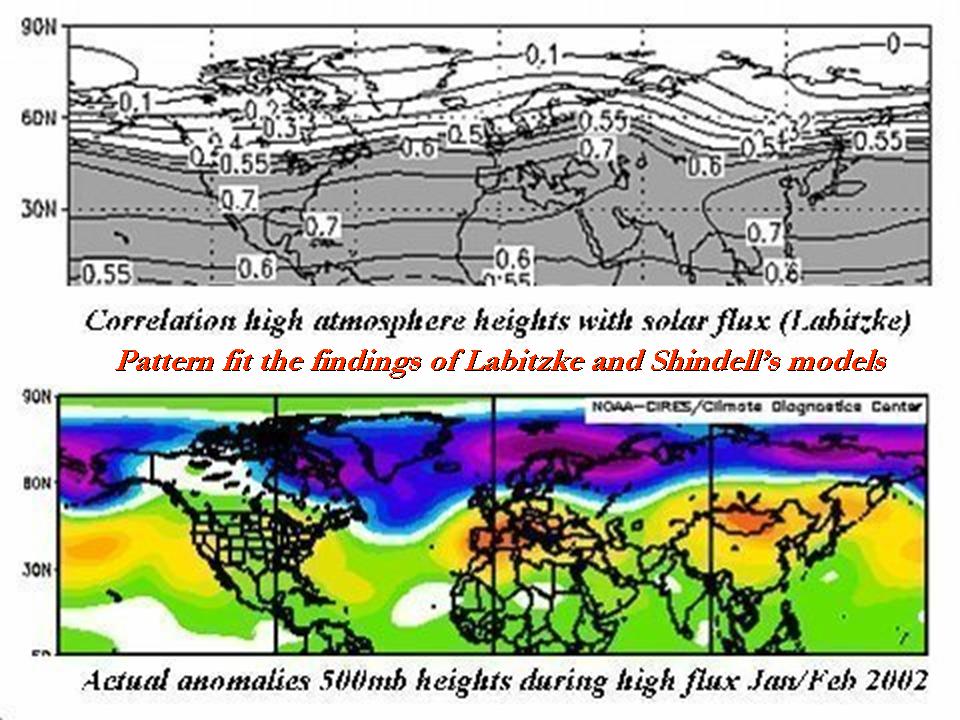
In work done by Shindell et al. at NASA GISS, they showed how high solar flux which usually means high ultraviolet leads to heating due to ozone chemistry in the high atmosphere in low and middle latitudes. That heat makes its way down with time into the troposphere in the models. This supported the work of Labitzke who found diffferences from solar minimum to solar maximum that she related to the 6-8% changes in ultraviolet radiation during the cycle. She also found empirical evidence the warming extends from the stratosphere down into the troposphere.
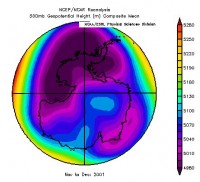
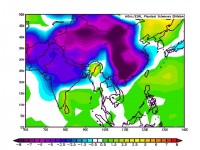
In 2001/02, this warming was observed in low and middle latitudes causing heights to rise and the polar vortexes in both hemisphere to shrink. It was a warm ‘zonal’ winter in the Northern Hemishere. In the southern hemisphere, the vortex split into two in November/December, it was reported for the first time in recorded history. The changing winds and currents MAY have helped trigger the break-up. You can see the average 500 mb heights during November and December showing a split in the southern vortex which may have started the changes in low levels that broke up the “teetering” ice shelf. The ice quickly reformed by the following winter.
By Joseph D’Aleo, CCM
It has been at times a harsh and overall very snowy winter over areas north and west, typical of La Nina.
This is already the snowiest winter in Chicago in almost three decades. The heaviest snow in the latest fell northern suburbs of Chicago north and west. 21 inches fell in Ordvillee, north of Beloit. See Tom Skilling’s blog on the snowfall. Madison, Wisconsin with a foot of snow actually is closer to 74 inches now for the season with the additional snow last evening, roughly running 225% of normal. Just over 20 inches of snow fell in Saukville and 19 inches at Jackson, both north of Milwaukee. Occasional brief periods of blizzard-like conditions developed along the Lake Michigan shoreline from Milwaukee to Kenosha as the snowfall picked up Wednesday, said meteorologist Rusty Kapela of the National Weather Service’s Sullivan office. (see the Wisconsin storm story). In Wisconsin it was the worst storm since January1999, another La Nina winter.
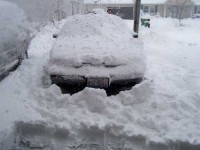
Photo in Antioch, Illinois by Carl Frystak on Tom Skilling blog
Schools and universities canceled classes in parts of Kansas, Iowa, Illinois, Wisconsin and Michigan, where up to 14 inches of snow fell north of Detroit. The Detroit area got a mix of rain, snow and sleet. See the Lower Michigan totals here.
Southeast Iowa was hard hit. Brad Small, a forecaster with the National Weather Service, called this winter Iowa’s “coldest and snowiest” since 2000-01, also a La Nina winter. The harshness has led to shortages of road salt in many cities, including Tipton, in eastern Iowa. Getting more will be difficult because a frozen Mississippi River has blocked barge traffic.
The snow extended into northern New York State and New England with as much as 15 inches in Burlington, Vermont. Expect more of thr same in the weeks ahead but with areas to the east getting more of their share.
ICECAP UPDATE: NOAA agrees with the satellite assessment. The average United States temperature in January 2008 was 30.5 F. This was -0.3 F cooler than the 1901-2000 (20th century) average, the 49th coolest January in 114 years. This despite a very warm week 2 that brought hundreds of records to the central and east.
By Anthony Watts, Watts Up With That
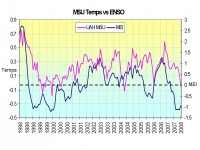
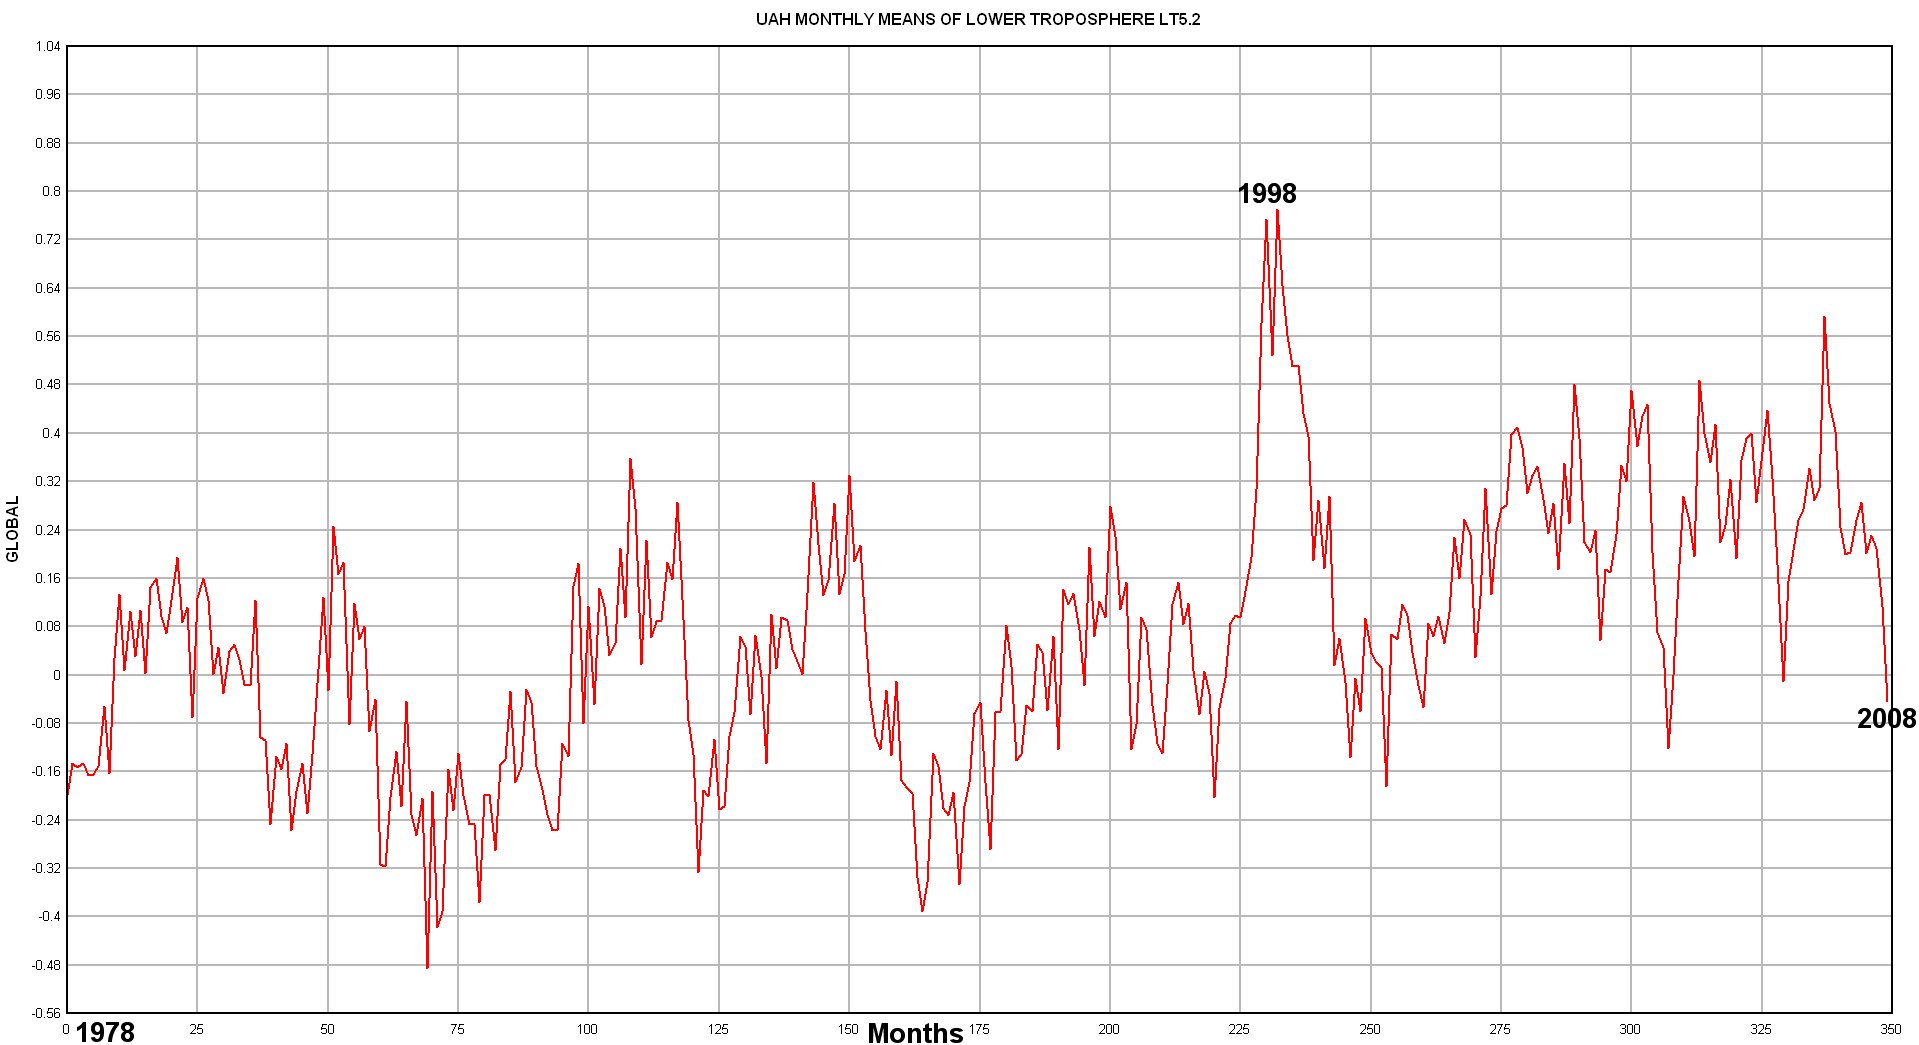
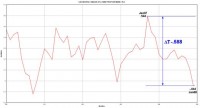
University of Alabama, Huntsville (John Christy) just published their UAH lower troposphere data for January 2008. Like the RSS data set, it shows a negative anomaly, and a steep decline in the past 12 months though the magnitude of the anomaly is slightly lower at ∆T -.588 than the RSS ∆T -.629 degrees Centigrade.
I’ve plotted the UAH data below, as I did for the RSS data in the previous post:
See full size image here
And a zoomed version with the Delta T highlighted:
See full size image here
Read more of Anthony’s blog here. And the prior RSS blog here.
Tornadoes Rip Through South in Typical La Nina FashionBy Joseph D’Aleo, CCM
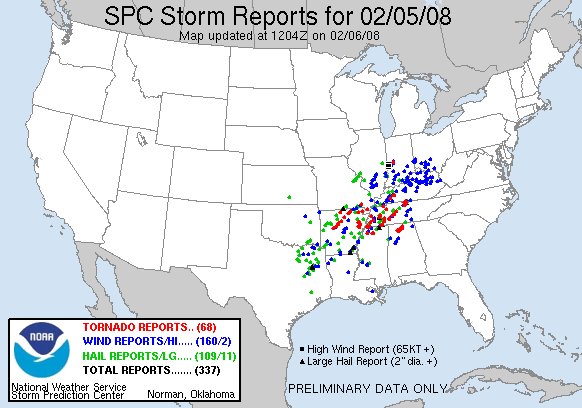
Yesterday was a busy day at the Storm Prediction Center and local forecast offices in the south. 68 tornaodes were reported with Tennessee and Arkansas hardest hit. CNN put the death toll at 52.
See full size image here.
About a month ago on Jan. 8, tornadoes were reported in Arkansas, Illinois, Missouri, Oklahoma and Wisconsin. Two died in the Missouri storms. Tornado outbreaks are more likely in La Nina years. A few years ago, I did a study of the years with the maximum number of tornadoes for every month and found that from the fall to the spring they were all La Nina years. The Superoutbreak of April 1974 came after one of the strongest La Ninas on record. And Eugenio Hackbart at the METSUL reminded me also in a similar La Nina in a cold Pacific era, in February 1971, more than 100 people died during an outbreak in the Mississippi Delta. This paper by Bove in 1999 supported this La Nina to severe weather outbreak connection. An unpublished manuscript by Knowles and Pielke (1993) observed that tornadoes during ENSO cold phase (La Nina) are stronger and remain on the ground longer than their warm phase (El Nino) counterparts. They further showed that there is an increased chance of large tornado outbreaks (40 or more tornadoes associated with a single synoptic system) during ENSO cold phase (La Ninas). Given the strength of this La Nina, what it has been able to do in January and February and that history, we might expect a very stormy spring from the south to the Ohio Valley. Predictably, someone (this case Senator Kerry) was bound to pronounce the tornadoes were the result of global warming. Fortunately the story had a Storm Prediction Center meteorologist Roger Edwards inject doubts about any global warming and tornado relationship.
In La Ninas, the cold tends to want to stay across the north and strong warmth builds at times across the south. Storms along the boundary feed on the contrast and severe weather often results. To the north of the storm track, it is ice or heavy snow that is the problem and that will be the story over the next few days. As we had indicated a few weeks ago, places like Des Moines, Chicago, Detroit would be first in line and then part of the northeast. With this series of the storms this week, Des Moines will end up with a foot of snow. Chicago’s forecast for today is for 12-14 inches over far northern suburbs rangind down to 8-10 in far southern suburbs (see Tom Skilling blog). For Detroit 6-10 inches is forecast with more to the north. In the northeast it is now snowing hard across the north with cold rain in the central areas in sharp contrast to unseasonable warmth to the south (it is actually above 70F in parts of Virginia and coastal Maryland into New Jersey). The rain across central New York State and New England will gradually transition to sleet and snow today and tonight. Thunderstorms will likely be in the cards further south until the cold air begins to filter back in and be reinforced this weekend with an arctic blast. Wild swings as we said a few months back are also typical of La Nina.
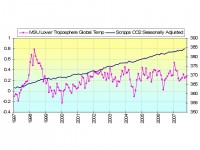
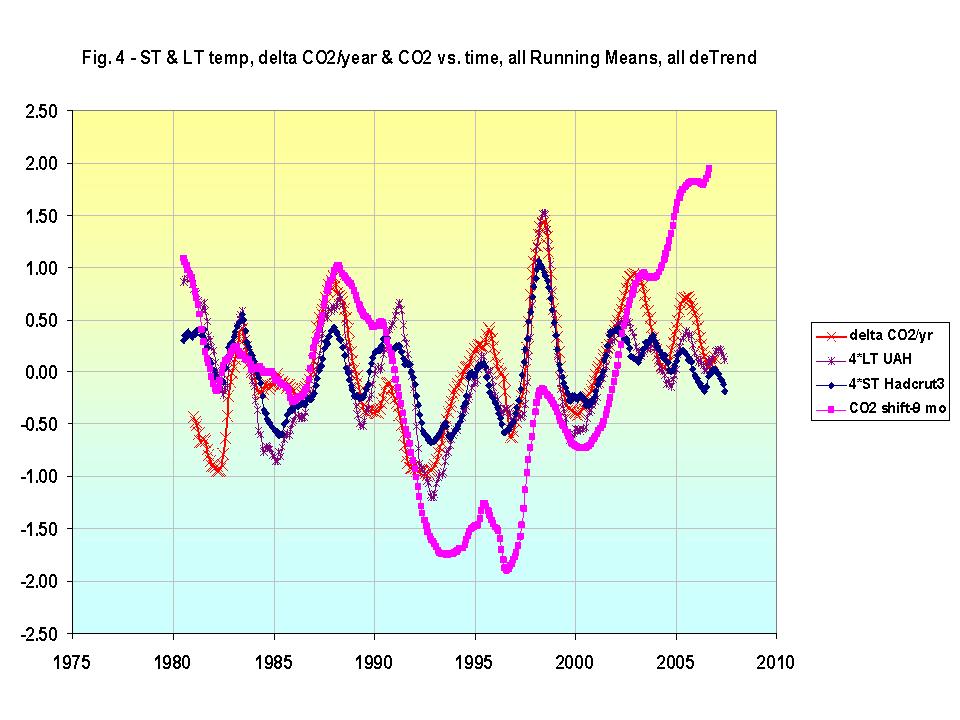
Carbon Dioxide in Not the Primary Cause of Global Warming: The Future Can Not Cause the PastBy Allan M.R. MacRae, B.A.Sc., M.Eng., P.Eng.
Despite continuing increases in atmospheric CO2, no significant global warming occurred in the last decade, as confirmed by both Surface Temperature and satellite measurements in the Lower Troposphere. Contrary to IPCC fears of catastrophic anthropogenic global warming, Earth may now be entering another natural cooling trend. Earth Surface Temperature warmed approximately 0.7 degrees Celsius from ~1910 to ~1945, cooled ~0.4 C from ~1945 to ~1975, warmed ~0.6 C from ~1975 to 1997, and has not warmed significantly from 1997 to 2007.
CO2 emissions due to human activity rose gradually from the onset of the Industrial Revolution, reaching ~1 billion tonnes per year (expressed as carbon) by 1945, and then accelerated to ~9 billion tonnes per year by 2007. Since ~1945 when CO2 emissions accelerated, Earth experienced ~22 years of warming, and ~40 years of either cooling or absence of warming.
The IPCC’s position that increased CO2 is the primary cause of global warming is not supported by the temperature data. In fact, strong evidence exists that disproves the IPCC’s scientific position. This UPDATED paper and Excel spreadsheet show that variations in atmospheric CO2 concentration lag (occur after) variations in Earth’s Surface Temperature by ~9 months. The IPCC states that increasing atmospheric CO2 is the primary cause of global warming - in effect, the IPCC states that the future is causing the past. The IPCC’s core scientific conclusion is illogical and false.
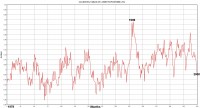
There is strong correlation among three parameters: Surface Temperature ("ST"), Lower Troposphere Temperature ("LT") and the rate of change with time of atmospheric CO2 ("dCO2/dt"). For the time period of this analysis, variations in ST lead (occur before) variations in both LT and dCO2/dt, by ~1 month. The integral of dCO2/dt is the atmospheric concentration of CO2 ("CO2").
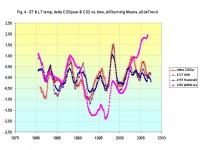
ST and LT anomalies have been multiplied by 4 for visual clarity. See full size image here.
See UPDATED paper here
Allan M.R. MacRae, B.A.Sc., M.Eng., is a Professional Engineer.
By Joseph D’Aleo, CCM
Roger Pielke Sr. aptly notes Climate Science has made as one of its main conclusions that the needed focus for the study of climate change and variability is on the regional and local scales. Global and zonally-averaged climate metrics would only be important to the extent that they provide useful information on these space scales. The recent prolonged rare cold and snow in China provides an excellent example to support this conclusion. As reported on China View under the title Experts blame snow disaster on La Nina, atmospheric circulation.
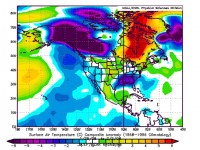
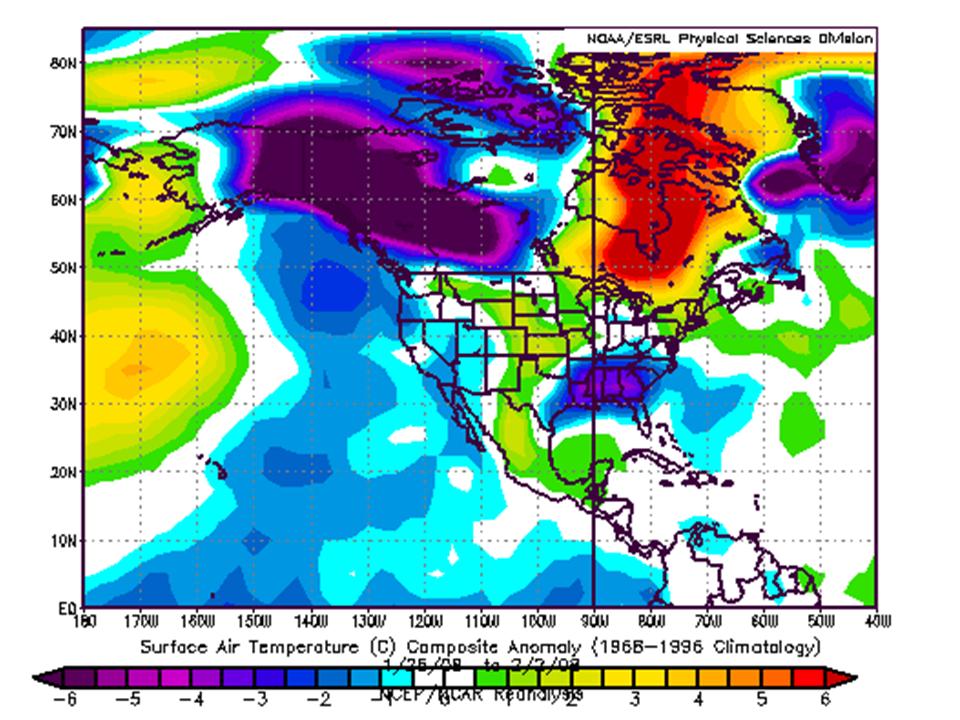
See the extent of the cold across much of China and India the 8 days ending February 2, 2008. Note amounts exceed 8 degrees Celsius (nearly 15 degrees F) in many locations. See a new story today on Planet Ark
China Battles “Coldest Winter in 100 Years”. Over 38% of the world’s population (2.4 billion) live in China and India.
See full size image here
Cold is again building in western Canada and will come east and south the next few weeks. Look for more snow and cold in the news in the weeks ahead across many areas of the northern United States. This too is classic La Nina, cold Pacific Decadal Oscillation weather. Snow fell heavily in the Pacific Northwest as we often find in La Ninas. In fact in some places in Oregon, heavy enough (eighteen inches on top of 6 feet of snow already there) to cause roofs to collapse. See Idahna, Oregon Buried in Snow; Mayor Asks for Emergency Help. This story has some amazing video.
As some of the cold air first makes an appearance across the northern tier the next few days, rain will change to snow with heavy amounts once again from Chicago across the Great lakes into New York State and New England. See Tom Skilling’s blog for stories on how Chicago already ranking as the 6th snowiest in 124 years of record is facing another heavy snow this week and is headed for a 60 inch plus snow season. Scroll down to see some interesting graphs and charts.
See full size image here
See this story in the New York Times. Millions of Chinese faced a humanitarian crisis on Friday as gasoline and food reserves dwindled and yet more bad weather was forecast for a country paralyzed by record-breaking cold and snow. More than 160 counties and cities in central China suffered blackouts and water shortages, the Xinhua news agency said, including Chenzhou, in Hunan Province, a city of four million that has been without power and water for more than a week. Stricken areas of south and central China are suffering the worst winter weather in half a century, with at least 60 people dead in weather-related accidents.
Hunan, Guizhou and Jiangxi were all facing fresh storms, and Mr. Zhu said the extreme weather could last another 10 days. Nearly six million passengers have been stranded on trains or in railroad stations in the past week. For millions of migrant workers, Lunar New Year is their only chance to see families all year.
Icecap Note: Our friends at the Metsul in Brazil remarked that this event is the “Chinese Katrina” in the sense of a social convulsion after a dramatic weather event. They also noted the Chinese news agency even published a webpage dedicated specially to this event.
We keep reading in these stories, that the cold or snow is the worst in 30 to 50 years. This may friends be because 30 to 50 years ago we were in the cold phase of the PDO and much of the time the warm phase of the AMO, which is currently the case. Recall I recently did a correlation of these factors at least with the US data (I had little faith in any of the global data bases except the satellite and it only goes back to 1979) and found a good correlation of US temperatures with the multidecadal cycles.
By CO2 Science
CO2 Science reviewed the paper “A 2000-year global temperature reconstruction based on non-treering proxies” by Loehle in 2007 Energy and Environment Volume 18, pages 1049-1058.
Using data from eighteen 2000-year-long proxy temperature series from all around the world that were not developed from tree-ring data (which provide significant interpretive challenges), the author (1) smoothed the data in each series with a 30-year running mean, (2) converted the results thereby obtained to anomalies by subtracting the mean of each series from each member of that series, and then (3) derived the final mean temperature anomaly history defined by the eighteen data sets by a simple averaging of the individual anomaly series, a procedure that he rightfully emphasizes is “transparent and simple.” The results obtained by this procedure are depicted in the figure below, where it can be seen, in the words of its creator, that “the mean series shows the Medieval Warm Period (MWP) and Little Ice Age (LIA) quite clearly, with the MWP being approximately 0.3C warmer than 20th century values.”
See larger image here
Loehle notes that “the 1995-year reconstruction shown here does not match the famous hockey stick shape,” which clearly suggests that one of them is a poorer, and the other a better, representation of the truth. Because of its simplicity and transparency, as well as a host of other reasons described in detail by Loehle—plus what we have learned since initiating our Medieval Warm Period Record-of-the Week feature—it is our belief that Loehle’s curve is by far the superior of the two in terms of the degree to which it likely approximates the truth. Get printable version of this review here.
Snow, cold, in Saudi Arabia: “Worst in 30 Years”. Snow in Maui Too!By Anthony Watts on Watts Up With That
According to wire reports, temperatures reached their lowest point in 30 years, reaching to -2C in the capital, Riyadh, and to -6C in mountainous regions blanketed by snow. At least 10 people have died in the country as a weather system driven South from Siberia sent temperatures plummeting. Apparently its gotten so bad (or they just aren’t prepared to deal with it) that King Saud ordered that government assistance should be given in the affected areas, which witnessed sub-zero temperatures this week.
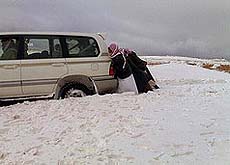
I had to laugh at the photo above and the caption: Saudi Arabians are used to getting stuck in the sand, but snow is a new challenge for many. It almosts seems Pythonesque.
While I’m enjoying pointing out these uncommon phenomena, I’d also point out that even though both the northern and southern hemispheres have both seen some record cold events in the past 6 months, that doesn’t necessarily equate to “climate change”. Still, something seems afoot as we are seeing more and more events like this. Maybe the massive La Nina now stretching across the Pacific ocean has something to do with this.
Oh but wait, there’s more! Snow was seen yesterday atop Maui’s Mount Haleakala in Hawaii.
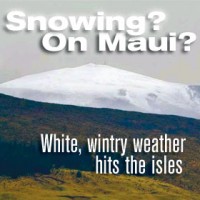
Yeah, somethings up. See the full story and many more photos from the middle east and Hawaii on Anthony’s site here.
By Joseph D’Aleo, CCM
Late Thursday Update: See this story on the new snowstorm for the Midwest. The cold will abate early in February as we have been saying but expect a new arctic blast and snow even maybe further east early in week 2.
Late Wednesday Update: It dropped to 0F in Kirksville, MO this morning down from 55 yesterday. In St. Louis, the drop was from a high of 73F to 11F this morning. Wind chills were as low as -57F in Grand Marais, MN. The front created chaos as it came east last night and today before losing its punch in the northeast. The next storm will lift northeast with heavy snows perhaps as far west as Chicago and St Louis and east as the eastern Great Lakes.
Tuesday’s Post: An arctic front is whipping through the central states this morning with drops of 40 and 50 degress in the matter of hours. In Kirksville, MO at 7am when folks headed off to work and school, it was a balmy 55F. By 1 pm as they were at lunch, it was a frigid 14F with 24 mph winds bringing a wind chill of -4F with light snow and blowing snow. At 2 pm it was down to 12F. The change is even more dramatic considering yesterday it reached 65F there. The low tonight is forecast to be 5F. Big drops like this were common throughout the plains and midwest and will be the case through tonight as the arctic front sweeps east.
See full size image here.
That cold front will put an end to the brief warm up as it sweeps east but the cold will moderate in transit. the readings well below zero in the upper midwest tonight will be much less severe as they come further east. Last week we talked about how the oscillating wave in the tropical high atmosphere called the MJO often affects the location of warming and cooling as it traverses the globe in an a somewhat erratic and irregular fashion. It is current roughly entering the same location where it was when the warmth was felt in the east and central earlier in January though this time the MJO is weaker so the warmth may not be as anomalous. This will likely mean above normal temperatures will dominate the next week to 10 days especially in the east with storms tending to curl west and bring rain and the warmest days. That track will mean the heaviest snows in places like Chicago and Detroit. After that, the cold should shift more to the east along with the threat again of snow for the east.