


By S. Fred Singer, Ph.D., President, Science and Environmental Policy Project
So here we have them: Obama’s three - Chu, John Holdren, and Jane Lubchenco. All with sterling credentials - a Nobel laureate in physics, a recent president of the AAAS, a recent head of the International Council of Scientific Unions - but with minimal knowledge of climate science, except what they may have gleaned from reading the IPCC summary. Yet all three seem supremely confident that they will drastically change US climate policy. Well, let me be the first with the bad (for them) news: Within a year or so, they are going to be an awfully frustrated bunch.
My fearless forecast for 2009: Big amount of activity by Congress, with lots of ‘Cap&Trade’ bills to limit CO2 emissions. Waxman, Markey, and Pelosi in the House; Boxer, Lieberman, Bingeman, and maybe even McCain in the Senate. It will take off, but it won’t fly: There is the prohibitive cost of any real C&T, raising energy prices and killing jobs—while the economy is in the dumps. There is the horrible example of the European emission-trading brouhaha, falling apart even as we go to press. And after ten years, the climate is still refusing to warm. I am not even considering the threat of a filibuster in the Senate-with Democrats from ‘fly-over’ states joining Republican opponents of Cap&Trade.
I think that Obama is much too smart to devote political capital to doomed climate legislation. He has more important priorities, and must also be thinking of 2010 and, of course, the 2012 elections. Being a ‘one-term’ president just doesn’t look good. He will certainly go through the motions and come up with great rhetoric. He’ll trot out his science team - but to no avail. Climate science isn’t going to figure prominently in the Congressional debates - alas; it’s all about economics and politics.
Now for the real action: Once legislation stalls, Carol Browner, the supreme ideologue and strategist, will go the regulatory route. EPA will try to treat CO2 as a ‘criteria pollutant’ under the terms of the Clean Air Act. But there will be litigation. EPA must demonstrate ‘endangerment’ and make a persuasive case that CO2 is a threat to ‘public health and welfare.’ Perhaps even show that there is a critical level of CO2 and demonstrate convincingly - in a court-of-law—that its regulatory program will succeed in keeping CO2 from reaching that level. EPA will be required to respond to all the scientific evidence now in its docket that says CO2 is not a threat - including the NIPCC report. Here is where climate science will finally become all-important - but Obama’s science team will be of no help once cross-examination starts.
How much better if the three team members lay off climate and devote their efforts and expertise to genuine problems: Holdren can handle nuclear proliferation and the rising threat of nuclear terrorism; Lubchenco can try to stem the over-exploitation of ocean resources, and look after fisheries and whales; Chu should be thinking about the inevitable transition from fossil fuels to various forms of nuclear energy and foster research that assures adequate and low-cost supplies of fissionable fuel for the more efficient and safer reactors of the future.
While this may be best use of their considerable collective talents, they will probably be pressed into service to back up Browner on her dubious climate science —where they have negligible expertise. See Fred’s editorial at SEPP here.
See Fred’s editorials from 2008 here. Included is a multi-part defense of the NIPCC which is looking better with every month and new published honest research. It’s success unlike the IPCC AR4, has made it a target of many alarmists including Michael Mann and Gavin Schmidt. As Joe Bast and James Taylor noted so well here, Mann is the author of the “hockey stick” temperature graph that did so much to fuel global warming hysteria when it was featured in an IPCC report, but which a Congressionally appointed panel of experts found was not supported by scientific data. Gavin Schmidt is a climate modeler at the Goddard Institute for Space Studies and in recent weeks has been frantically trying to explain why his organization falsely reported that October 2008 was the warmest October in recorded history. Many climate researchers believe Mann and Schmidt are deliberately falsifying temperature data to keep their global warming scare going a few more years. With no apparent sense of irony or shame, these two discredited authors call one of the world’s leading scientists “dishonest.”
The prolific and brilliant Christopher Monckton has two new scarewatches at one of our favorite sites, the Science and Public Policy Institute (SPPI) definitely worth reading. Coming soon to SPPI a major work by Craig Idso of CO2Science, another highly recommended site.
Yet Another “Moment of Fateful Decision”
By Christopher Monckton
The scare: At the December 2008 UN climate conference at Poznan, held during the coldest commencement of the European winter in 30 years, former vice-president Al Gore said that the human species had arrived at yet another “moment of fateful decision”, because “our home, Earth, is in danger”. He said he would state “a few facts, if only to underscore the urgency of our task”, and “we cannot negotiate with the facts”, the first of which was the “unrestrained dumping of 70 million tons of ‘global warming’ pollution into the thin shelf of atmosphere surrounding our planet every 24 hours”. Scientists had “for several years now warned us that we are moving dangerously close to several so-called tipping points that could within less than 10 years make it impossible to avoid irretrievable damage to the planet’s habitability”. Read how Christopher debunks the AlGorisms here.
“Global Cooling is really Global Warming”
By Christopher Monckton
The scare: On 2 January 2009, the Wall Street Journal wrote one of a series of articles apparently co-ordinated throughout the generally alarmist news media throughout the holiday season, trying to overcome the problem posed for “global warming” alarmists by the fact that global mean surface temperatures have been on a downtrend for eight straight years.
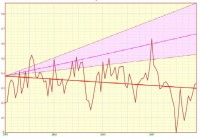
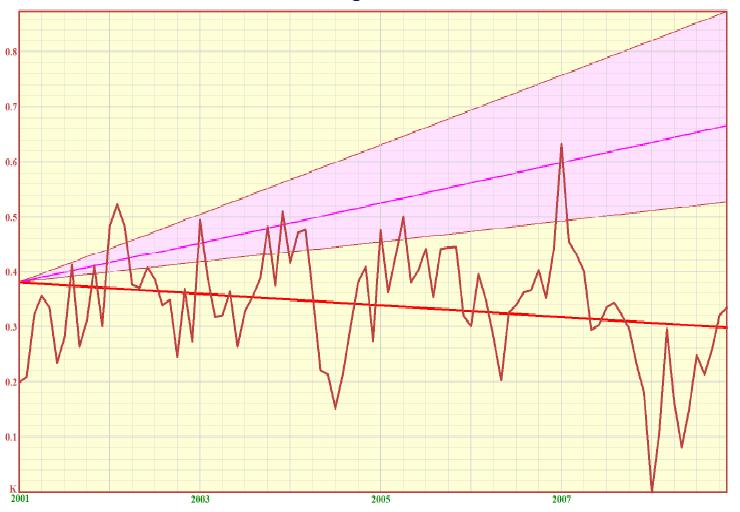
Eight straight years’ global temperature downtrend: The authoritative SPPI composite index of global mean surface temperature anomalies, taking the mean of two surface and two satellite datasets and updated through November 2008, shows a pronounced downtrend for eight full years. Not one of the climate models relied upon by the IPCC had predicted this downturn. The pink region shows the IPCC’s projected rates of temperature increase: the thick red straight line - entirely outside and below the pink region shows the real trend, calculated as the least-squares linear regression on the composite temperature anomalies. See larger image here.
Read more here.
Surprising Return of North Atlantic Circulation PumpMedia Newswire
One of the “pumps” contributing to the ocean’s global circulation suddenly switched on again last winter for the first time this decade, scientists reported Tuesday ( Dec. 23 ) in Nature Geoscience. The finding surprised scientists, who had been wondering if global warming was inhibiting the pump-which, in turn, would cause other far-reaching climate changes. The “pump” in question is the sinking of cold, dense water in the North Atlantic Ocean in the winter. It drives water down into the lower limb of what is often described as the Great Ocean Conveyor. To replace that down-flowing water, warm surface waters from the tropics are pulled northward along the Conveyor’s upper limb.
The phenomenon helps draw down the man-made buildup of carbon dioxide from air to surface waters and eventually into the depths, where the greenhouse gas can be stored for centuries and offset global warming. It also transports warm tropical waters northward, where the ocean transfers heat to the air and keeps winter climate in the North Atlantic region much warmer than it would be otherwise.A research team led by Kjetil Vage and Robert Pickart of Woods Hole Oceanographic Institution examined new data collected by robotic floats that have been drifting for several years in the Labrador and Irminger Seas around southern Greenland. These Argo floats - part of a fleet of 3,000 dispatched since 2000 through the world’s oceans - descend to depths of 1.25 miles ( 2,000 meters ), collect temperature and salinity data as they periodically rise toward the surface, and then transmit the data via satellite before descending again.
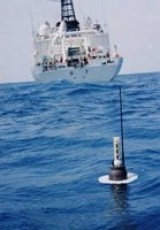
Unlike ships that usually (and wisely) avoid rough North Atlantic seas in winter, the Argo floats provide a way to measure the sinking of cold waters in the season that it occurs. The pump is driven by the contrast between frigid, dry winter air and warm water, which draws heat from the ocean into the atmosphere. That leaves the water denser, and it consequently sinks. As air temperatures have generally warmed over the last two decades, the sinking of cold water in these northern seas has been either shallow or absent. But the new Argo float data showed that in the winter of 2007-2008, cold water sank significantly beyond .62 miles ( 1,000 meters ) deep in northern seas for the first time in eight years and for only the second time since the mid-1990s. Beyond that depth, waters can be swept into lower limb of the Conveyor and carried around the world. “The obvious question is, why?” wrote Vage, Pickart, and colleagues.
Investigating that question, the researchers turned up a myriad of interrelated factors that may have caused Labrador and Irminger Seas water to resume sinking. Sinking was undoubtedly enhanced last winter by air temperatures over the North Atlantic that were 9 to 11F ( 5 to 6C ) colder than in the previous seven years. That often occurs when a seesawing pattern of high- and low- pressure air masses, called the North Atlantic Oscillation, is in its “positive” position, bringing frigid westerly winds from Canada streaking across the North Atlantic. But, curiously, that was also the case in 2006-2007, in which sinking did not occur.
The lack of substantial sinking throughout the decade meant that there was no “reconditioning” that is, colder waters could not build up from previous winters to a point where they are easily pushed over a density threshold and sink the following year, the research team said. That made the sudden reappearance of sinking in 2007-2008 all the more surprising. Digging deeper, the researchers found that local wind patterns, which occurred in 2007-2008 (but not the preceding winter), may have played a role. In particular, storms tended to track farther to the south, pulling cold air off the ice edge of eastern Canada into the Labrador Sea. The same storms also passed Cape Farewell at the southern tip of Greenland, creating a phenomenon known as Greenland tip jets: High winds from the west deflect around the glacial slopes of Greenland, accelerating as they draw cold, ocean-chilling air into a relatively small area over the southern Irminger Sea.
A final clue emerged. Analyzing satellite and in-situ ocean data, the researchers said a large amount pack ice and fresh water was exported into the northwest Labrador Sea in the summer of 2007. This froze the following winter, significantly extending the ice edge farther offshore. As a consequence, cold air from the North American continent traveled farther over ice, instead of warmer ocean waters, remaining cold until it hit warmer open water in the middle of Labrador Sea. The resulting temperature contrast helped trigger the sinking process.The scientists noted “that the increased liquid and frozen freshwater flux into the Labrador Sea was probably tied to the large export of sea ice from the Arctic Ocean that contributed to the record minimum in sea-ice extent observed in the summer of 2007. Read more here.
By AP, AFP News
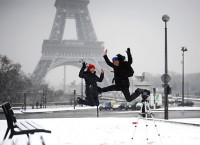
A winter storm brought blankets of snow across Europe on Monday, forcing the closure of an icy Eiffel Tower in Paris and causing flight cancellations. Up to 10 centimetres of snow was recorded in parts of France, the national weather service said. Most areas, including Paris, got about half that amount. French authorities issued traffic alerts in around 30 regions because of icy roads. The Eiffel Tower, one of Paris’ main tourist attractions, was closed because of slippery conditions.
“We can’t put down salt because it’s metallic,” Eiffel Tower press officer Isabelle Esnous said. “We can’t use sand either because it risks getting into the elevator (cogs).” The cold, she said, was no problem, but snow could be dangerous.
Hundreds of passenger were stranded Monday at the main Paris airport of Roissy-Charles-de-Gaulle by snow after scores of flights were cancelled. Northern, central and western France were hit by snow and freezing rain during Monday, causing accidents, one fatal. Weather services warned that the thermometer would fall further during the week as icy air arrived from Siberia and Scandinavia. Temperatures could fall to between minus five and minus 10 centigrade (23 and 14 Fahrenheit) in the north and northeast, forecasters said. The cold snap could last until the middle of the month in much of the country. National elecricity consumption hit a record peak early Monday evening. In the Paris area transport authorities had to suspend some bus services as snow and freezing rain made roads impassable. At one point, heavy goods traffic moving towards Paris was limited.
In Germany, heavy snowfall snarled road traffic and flight delays and cancellations at the country’s international airports. Duesseldorf International Airport said no flights were allowed in or out between 6am and 9am local time on Monday because clearing crews were unable to keep up with the snow. More than 30 flights were cancelled because of the bad weather, airport spokesman Christian Witt said. Up to 10 centimetres of snow was reported in Duesseldorf and about 15 centimetres in Potsdam, just outside Berlin. Flights from Frankfurt International Airport were delayed as much as an hour but none had to be cancelled. Traffic stopped for hours on many of Germany’s autobahns as snowploughs struggled to clear the roads amid heavy post-holiday traffic. Germany’s National Weather Service is forecasting subzero temperatures for the coming days. Snow also fell across Britain. Children built snowmen in parts of England, including Cambridge. Read more here. See this story on the Deadly Chills in Europe here. See also this story about the coldest night in 22 years in Germany here.
Dr. Roy Spencer has updated his paper and started a blog on his new web site. Be sure to see this blog post (get out your reading glasses first). The paper “Satellite and Climate Model Evidence Against Substantial Manmade Climate Change (supercedes “Has the Climate Sensitivity Holy Grail Been Found?") can be found here. Excerpts follow Roy’s photo.

Three IPCC climate models, recent NASA Aqua satellite data, and a simple 3-layer climate model are used together to demonstrate that the IPCC climate models are far too sensitive, resulting in their prediction of too much global warming in response to anthropogenic greenhouse gas emissions. The models’ high sensitivity is probably the result of a confusion between forcing and feedback (cause and effect) when researchers have interpreted cloud and temperature variations in the real climate system. (What follows is a brief summary of research we will be submitting to Journal of Climate in January 2009 for publication. I challenge any climate researcher to come up with an alternative explanation for the evidence presented below. I would love to hear. My e-mail address is at the bottom of the page.)
Since computerized climate models are the main source of concern over manmade global warming, it is imperative that they be tested against real measurements of the climate system. The amount of warming these models predict for the future in response to rising concentrations of carbon dioxide in the atmosphere is anywhere from moderate to catastrophic. Why is this?
It is well known that most of that warming is NOT due to the direct warming effect of the CO2 by itself, which is relatively weak. It is instead due to indirect effects (positive feedbacks) that amplify the small amount of direct warming from the CO2. The most important warmth-amplifying feedbacks in climate models are clouds and water vapor.
Cloud feedbacks are generally considered to be the most uncertain of feedbacks, although all twenty climate models tracked by the Intergovernmental Panel on Climate Change (IPCC) now suggest cloud feedbacks are positive (warmth-amplifying) rather than negative (warmth-reducing). The only question in the minds of most modelers is just how strong those positive feedbacks really are in nature. This article deals with how feedbacks are estimated from satellite observations of natural climate variability…and describes a critical error in interpretation which has been made in the process.
Instead of the currently popular practice of building immensely complex and expensive climate models and then making only simple comparisons to satellite data, I have done just the opposite: Examine the satellite data in great detail, and then build the simplest model that can explain the observed behavior of the climate system.
The resulting picture that emerges is of an IN-sensitive climate system, dominated by negative feedback. And it appears that the reason why most climate models are instead VERY sensitive is due to the illusion of a sensitive climate system that can arise when one is not careful about the physical interpretation of how clouds operate in terms of cause and effect (forcing and feedback).
There is nothing inherently wrong with a model-centric approach to climate researc as long as the modeler continues to use the observations to guide the model development over time. Unfortunately, as Richard Lindzen at MIT has pointed out, the fact that modelers use the term “model validation” rather than “model testing” belies their inherent preference of theory over observations. The allure of models is strong: they are clean, with well-defined equations and mathematical precision. Observations of the real climate system are dirty, incomplete, and prone to measurement error.
The comparisons modelers make between their models and satellite data are typically rather crude and cursory. They are not sufficiently detailed to really say anything of substance about feedbacks - in either the models or the satellite data - and yet it is the feedbacks that will determine how serious the manmade global warming problem will be.
And as I have tried to demonstrate here, the main reason for the current inadequacy of such methods of comparison between models and observations is the contaminating effect of clouds causing temperatures to change (forcing) when trying to estimate how temperatures cause clouds to change (feedback). This not a new issue, as it has been addressed by Forster and Gregory (2006, applied to satellite measurements) and Forster and Taylor (2006, applied to climate model output). I have merely demonstrated that the same contamination occurs from internal fluctuations in clouds in the climate system. Read full paper here.
Soot Reduction ‘Could Help to Stop Global Warming’By Geoffrey Lean, Environment Editor
Governments could slow global warming dramatically, and buy time to avert disastrous climate change, by slashing emissions of one of humanity’s most familiar pollutants - soot - according to Nasa scientists. A study by the space agency shows that cutting down on the pollutant, which has so far been largely ignored by climate scientists, can have an immediate cooling effect - and prevent hundreds of thousands of deaths from air pollution at the same time.
At the beginning of the make-or-break year in international attempts to negotiate a treaty to replace the Kyoto Protocol, the soot removal proposal - which is being taken seriously by experts close to the Obama administration - offers hope of a rapid new way of tackling global warming. Governments have long experience in acting against soot.
Cutting its emissions has a virtually instantaneous effect, because it rapidly falls out of the atmosphere, unlike carbon dioxide which remains there for over a hundred years. And because soot is one of the worst killers among all pollutants, radical reductions save lives and so should command popular and political support.
The study - from NASA’s Goddard Institute for Space Studies, and published in the Journal Atmospheric Chemistry and Physics - concludes that tackling the pollution provides “substantial benefits for air quality while simultaneously contributing to climate change mitigation” and “may present a unique opportunity to engage parties and nations not yet fully committed to climate change mitigation for its own sake.”
Black carbon, the component of soot that gives it its colour, is thought to be the second largest cause of global warming after carbon dioxide. Formed through incomplete combustion of fossil fuels, wood and vegetation, it delivers a double whammy.
While in the air, it is spread around the globe by the wind, and helps to heat the atmosphere by absorbing and releasing solar radiation. And when it falls out it darkens snow and ice, at the poles or high in mountains, reducing its ability to reflect sunlight. As a result it melts more quickly, and exposes more dark land or water which absorbs even more energy, and so increases warming.
The bad news - as the Washington-based Institute for Governance and Sustainable Development points out - is that soot is causing global warming to happen much faster than expected. Its president, Durwood Zaelke, says “black carbon is exacerbating the climate situation”: “Taking quick action is quite simply our only near-term option.”
Rich countries have already reduced their emissions of black carbon from burning fossil fuels dramatically since the 1950s. The health benefits of a worldwide cut could be massive. Soot contains up to 40 different cancer-causing chemicals and can also cause respiratory and heart diseases. It is estimated to cause two million deaths in the developing world each year - mainly among children - when emitted from wood-burning stoves in poorly ventilated houses. In Britain, research has shown that people are twice as likely to die from respiratory disease when heavily exposed to soot emitted from vehicle exhausts.
Tackling these two health crises, the NASA study concludes, would also be the most effective short-term way of slowing climate change. Read more here.
Are we seeing a shift way from CO2 to other forms of pollution because the CO2 based models are failing? Or does it reflect confusion among the ranks. Note just a short while ago, a New Scientist report, cleaner skies were said to explain surprise rate of warming while in this story soot was blamed for melting the Himalayan glacier.
By Christopher Booker, UK Telegraph
Last week, as Britain shivered in sub-zero temperatures, the Met Office predicted that 2009 would be one of “the five warmest years on record”.

The UKMO temperate predictions have been comically inept. This statement entertained various US climate experts, such as Dr Roger Pielke Sr of Colorado University, who recalled how last September the Met Office forecast that this winter in the UK would be “milder than average”, just before we enjoyed the coldest autumn and winter for decades. Dr Pielke also recalled the Met Office’s prediction two years ago that 2007 would be globally “the warmest year on record”, beating the “peak” year of 1998 (see the Watts Up With That website). Even as they made that prediction, temperatures began their steepest plunge since they toppled off that 1998 highpoint, dropping by nearly 0.7C - equivalent to the entire net warming of the 20th century.
The reason why US scientists take a particular interest in the forecasting skills of the UK Met Office is that, through its Hadley Centre, its temperature data are one of the four official sources on which the UN’s Intergovernmental Panel on Climate Change bases all those projections of global warming which have the Western world’s politicians under such a spell. The Met Office, which played a key part in setting up the IPCC, has long since abandoned any pretence that it is an impartial scientific body when it comes to promoting its favourite cause of man-made climate change.
As the Met Office’s website boasts, its ‘’world-leading expertise’’ enables it to provide ‘’an understanding of the future through risk analysis and long-range forecasting’’. It stages seminars to equip ‘’professionals in Government and the public sector’’ to ‘’dispel scepticism about climate change in your organisation’’. It is just a pity that our Met Office’s comically consistent inability to predict weather even a few weeks ahead (let alone a century hence) is beginning to make it an international laughing stock. Read more here.
Roger Pielke Sr. addresses the UK Met Office issue advocacy instead of practicing true honest science in this excellent post on Climate Science.
An Eighteen-Hundred-Year Climate Record from ChinaBy Sherwood, Keith and Craig Idso, CO2 Science
Working with a stalagmite found in China’s Wanxiang Cave (33 19N, 105 00E)—which Zhang et al. (2008) say is located on the fringes of the area currently affected by the Asian Monsoon and is thus sensitive to (and integrates broad changes in) that annually-recurring phenomenon—the seventeen researchers developed a δ18O record with an average resolution of 2.5 years that “largely anti-correlates with precipitation” and runs continuously from AD 190 to 2003. Even more important than its close ties with precipitation, in our opinion, Zhang et al. demonstrate that the record “exhibits a series of centennial to multi-centennial fluctuations broadly similar to those documented in Northern Hemisphere temperature reconstructions, including the Current Warm Period, Little Ice Age, Medieval Warm Period and Dark Age Cold Period.”
And when one compares the peak warmth thus implied by their data for the Current and Medieval Warm Periods, it is readily seen that the Medieval Warm Period comes out on top as having been the warmer of the two. In another important set of comparisons, Zhang et al. superimpose their δ18O record upon individual plots of Northern Hemispheric temperature as derived by Esper et al. (2002), Moberg et al. (2003) and Mann and Jones (2003). In the first of these comparisons, the two records closely mimic each other, with both of them indicating greater peak warmth during the Medieval Warm Period than during the Current Warm Period. The same is likewise true of the second comparison; and in the third comparison the records also closely mimic each other over the vast majority of their expanse.
Over the last decades of the 20th century, however, the temperatures of the Mann and Jones record rise far above the temperatures implied by the Zhang et al. record (and, therefore, those of the Esper et al. and Moberg et al. records as well), which suggests to us that this anomalous behavior of the Mann and Jones record is indicative of its possessing a major defect that is not found in the other three datasets. And that defect, in our estimation, is Mann and Jones’ use of directly-measured as opposed to reconstructed temperatures over their record’s last few decades, which leads to their anomalous end-point “oranges” not telling the same story as that told by everyone else’s “apples.”
Another point of great interest about the Zhang et al. record is that it “correlates with solar variability, Northern Hemisphere and Chinese temperature, Alpine glacial retreat, and Chinese cultural changes.” And since none of the last four phenomena can influence the first one, it stands to reason that solar variability is what has driven the variations in every other factor mentioned. In fact, in a commentary that accompanies Zhang et al.’s article, Kerr (2008) states that the Zhang et al. record is described by other researchers as “amazing,” “fabulous,” and “phenomenal,” and that it “provides the strongest evidence yet for a link among sun, climate, and culture.” In addition, we note that it provides equally strong evidence for at least the Northern-Hemispheric-extent of the Medieval Warm Period and its greater and more persistent warmth than that of the Current Warm Period. Sherwood, Keith and Craig Idso (Zhang, P., Cheng, H., Edwards, R.L., Chen, F., Wang, Y., Yang, X., Liu, J., Tan, M., Wang, X., Liu, J., An, C., Dai, Z., Zhou, J., Zhang, D., Jia, J., Jin, L. and Johnson, K.R. 2008. A test of climate, sun, and culture relationships from an 1810-year Chinese cave record. Science 322: 940-942). See more here.
Note also CO2 Science also reports in this study by Lorrey et al., New Zealand data shows the dominance of the Medieval Warm Period.
By Joseph D’Aleo CCM, AMS Fellow
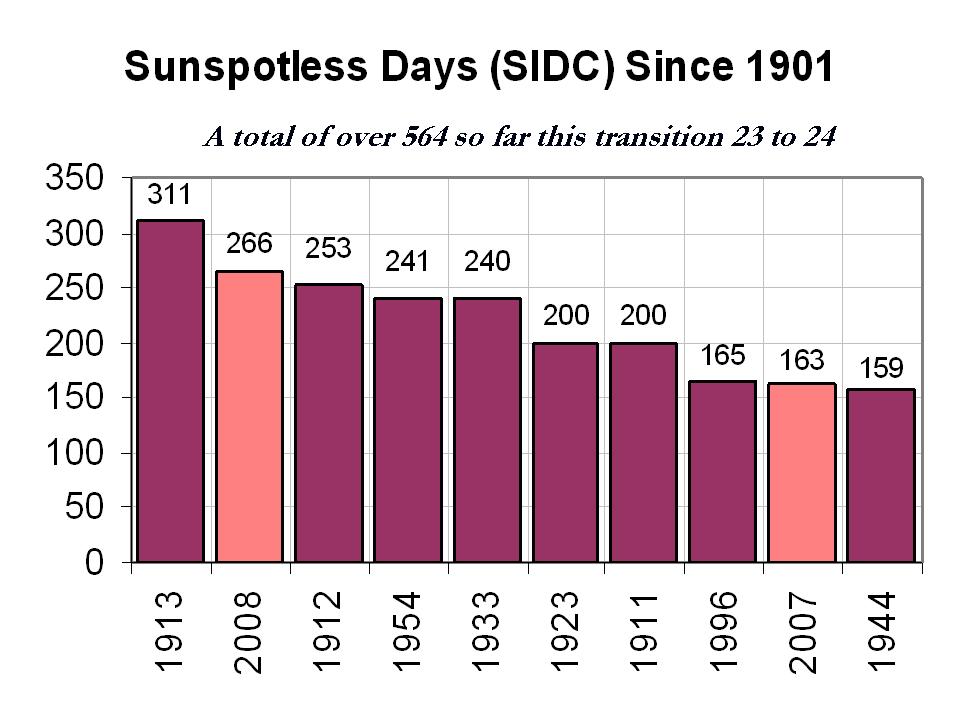
2008 will be coming to a close with yet another spotless days according to the latest solar image.
This will bring the total number of sunspotless days this month to 28 and for the year to 266, clearly enough to make 2008, the second least active solar year since 1901.

See larger image here.
The total number of spotless days this solar minimum is now at around 510 days since the last maximum. The earliest the minimum of the sunspot cycles can be is July 2008, which would make the cycle length 12 years 3 months, longest since cycle 9 in 1848. If the sun stays quiet for a few more months we will rival the early 1800s, the Dalton Minimum which fits with the 213 year cycle which begin with the solar minimum in the late 1790s.
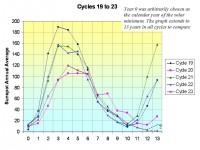
See larger image here.
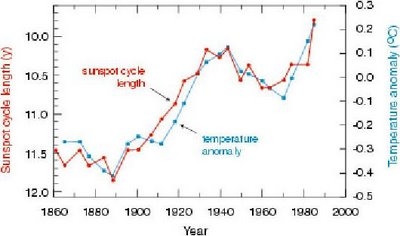
Long cycles are cold and short ones like the ones in the 1980s and 1990s are warm as this analysis by Friis-Christensen in 1991 showed clearly.
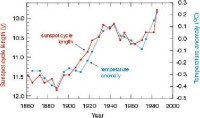
See larger image here.
In reply to the arguments made that the temperatures after 1990 increasingly diverged with solar length, I point out that it was around 1990 when a major global station dropout (many rural) began which led to an exaggeration of the warming in the global temperature data bases.
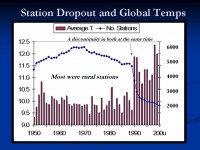
The temperature bars do not represent global temperatures directly as the distribution of the stations that vanished is not geographically even. They do indicate a change to a more urban mix. The satellites and radiosonde balloon provide more accurate temperature change assessments but the do not cover more than several decades. They show changes at about half the inflated global station based data.
See larger image here.
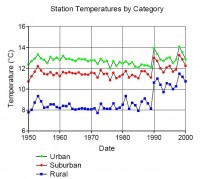
This graph of annual temperatures by Jonathan Drake breaks up the data into urban, suburban and rural. Note the biggest discontinuity was with the rural, indicating the changing distribution of rural stations was the greatest with a change towards a more lower latitude set (greatest losses were in Siberia).
This suggest the lower warming rates found by satellite and balloons is correct during the 1979-1998 period. Supporting this warming was the drop of the length from max to max of 21 to 22 to 9.7 years and cycle 22 length min to min 9.8 years, both very short suggesting warm temperatures in the 1990s. The interval of cycle 22 max to cycle 23 max centered in the mid 1990s began to increase at 10.7 years and the min to min length of cycle 23 is now at least 12.3 years.
With the Wigley suggested lag of sun to temperatures of 5 years and Landscheidt suggested 8 years, a leveling off should have been favored around 2000-2003 and cooling should be showing up now. Looking ahead, put that together with the flip of the PDO in the Pacific to cold and you have alarming signals that this cooling of the last 7 years will continue and accelerate.
See David Hathaway’s PPT presented at a conference in NAPA, CA early in December on forecasting cycle 24 here (courtesy Solarcycle24.com).
Here They Go Again - UKMO Says 2009 Will be Top Five WarmestBy Christina Fincher, Reuters
Next year is set to be one of the top-five warmest on record, British climate scientists said on Tuesday. The average global temperature for 2009 is expected to be more than 0.4 degrees celsius above the long-term average, despite the continued cooling of huge areas of the Pacific Ocean, a phenomenon known as La Nina.
That would make it the warmest year since 2005, according to researchers at the Met Office, who say there is also a growing probability of record temperatures after next year. Currently the warmest year on record is 1998, which saw average temperatures of 14.52 degrees celsius - well above the 1961-1990 long-term average of 14 degrees celsius. Warm weather that year was strongly influenced by El Nino, an abnormal warming of surface ocean waters in the eastern tropical Pacific. Theories abound as to what triggers the mechanisms that cause an El Nino or La Nina event but scientists agree that they are playing an increasingly important role in global weather patterns. The strength of the prevailing trade winds that blow from east to west across the equatorial Pacific is thought to be an important factor. “Further warming to record levels is likely once a moderate El Nino develops,” said Professor Chris Folland at the Met Office Hadley Center. “Phenomena such as El Nino and La Nina have a significant influence on global surface temperature.” Professor Phil Jones, director of the climate research unit at the University of East Anglia, said global warming had not gone away despite the fact that 2009, like the year just gone, would not break records.
“What matters is the underlying rate of warming,” he said. He noted the average temperature over 2001-2007 was 14.44 degrees celsius, 0.21 degrees celsius warmer than corresponding values for 1991-2000. See more here.
Icecap Note: Recall it was Jones early in January 2007 who warned 2007 would be the warmest year on record. When it fell well short thanks to La Nina, they promised 2008 would surely end up warmer. The recent cooling have forced them to admit the importance of ENSO (they conveniently ignore PDO which argues for much more frequent cold La Ninas than warm El Ninos in the next few decades). Also how about looking at the known warm biases like a 66% station dropout, tenfold increase in missing data, little or no urbanization or land use change adjustment based on flawed science, no adjustments for changing from whitewash to latex paints for shelters or to new hygrometers with a known warm bias and bad siting. Even here in the US, recall Anthony Watts’ band of volunteers have found only 4% of the nearly 600 stations surveyed thus far met the government’s standards for ideal siting and 69% were poorly or very poorly sited. Why isn’t the any attention paid to finding and correcting those errors.
The answer to that rhetorical question is that like at least half a dozen peer reviewed papers have shown, that would show that the warming is up to 50% exaggerated and that this might only be a top 30 warmest year. NOAA and NASA GISS are no better. Only the satellite data can be trusted but unfortunately it only goes back to 1979. NOAA (Karl and Petersen), NASA (Hansen and Schmidt), Hadley (Jones) have thrived on budgets fattened by the global warming issue. They have won the lottery and will do whatever it takes to keep the annuity checks coming.
Hadley’s Phil Jones will not share his data and adjustments made with scientists like Steve McIntyre, saying “If I do, you will only find something wrong”. Yes, Phil that is the purpose of data validation. The only reliable data set is the satellite, unfortunately it only extends back to 1979.
For a UK private forecaster’s take on the climate issue and the Hadley/UKMO see this.
By James Shott
Contrary to the preponderance of media coverage, manmade global warming is anything but a scientific certainty. Making policy on scientific uncertainty is a foolish and unsupportable exercise fraught with danger for our way of life. Many of us accept as gospel media reports of scientists who warn that man’s activities are wrecking Earth’s atmosphere. Some of us go so far as to accept predictions of cataclysmic consequences if something isn’t done right this minute, and accept as part of the solution radical prescriptions to correct the problem, such as the dangerous provisions of the Kyoto Protocols.
Spiked-online columnist Brendan O’Neill wrote the following: “Whoever thought that serious commentators would want it made illegal to have a row about the weather? One Australian columnist has proposed outlawing ‘climate change denial.’” This columnist wrote: “David Irving is under arrest in Austria for Holocaust denial. Perhaps there is a case for making climate change denial an offence. It is a crime against humanity, after all.’” Let’s drink a toast to objective scientific inquiry. Some in the US global warming lobby complain that the issue is simply too important to be left to the uncertainties of a democratic society, where people are free to not agree with them.

These open-minded people argue that such odd notions must be dispensed with where global warming is concerned. But there are others who brave social, monetary and professional punishment to question these dire predictions and seek out the truth, which is far less easy to find than the abundant predictions of catastrophe. In 1975 Newsweek magazine ran this: “There are ominous signs that the Earth’s weather patterns have begun to change dramatically and that these changes may portend a drastic decline in food production - with serious political implications for just about every nation on Earth. The drop in food output could begin quite soon, perhaps only 10 years from now. Scary stuff, huh? But this article of thirty years ago warned not of global warming, but of global cooling!
In February of this year California meteorologist Anthony Watts reported that all four major global temperature tracking outlets had recorded data showing that temperatures have dropped significantly over the last year, “and that the amount of cooling ranges from 65-hundredths of a degree Centigrade to 75-hundreds of a degree, a value large enough to erase nearly all the global warming recorded over the past 100 years. It is reportedly the single fastest temperature change ever recorded - up or down,” according to a Fox News story. The story went on to say that “some scientists contend the cooling is the result of reduced solar activity - which they say is a larger driver of climate change than man-made greenhouse gases.” How many of you have ever heard of Mr. Watts revelation? Not many, I’ll bet. The argument is less about whether the planet is warming than about the cause of it; warming and cooling periods are natural phenomena.
But inconvenient truths and facts continue to pile up against the manmade global warming theory. Princeton University physicist Dr. Will Happer, who served as the director of Energy Research at the Department of Energy from 1990 to 1993, was fired by Vice President Al Gore in 1993. I was told that science was not going to intrude on policy,” he said. Dr. Happer is one of a substantial and growing number of scientists who disagree with the manmade global warming faction of the scientific community. “I am convinced that the current alarm over carbon dioxide is mistaken,” he said recently, and has asked to join the more than 650 international scientists who have spoken out against manmade global warming fears in this year’s Senate Minority Report. “The earth’s climate is changing now, as it always has. There is no evidence that the changes differ in any qualitative way from those of the past …” Many of those who believe man is causing global warming think the situation is so dire that we don’t have time to debate the issue further, or to wait for sufficient evidence to produce a true consensus among climate scientists. But the liveliness of the debate tells us that we have a long way to go before a true consensus will be formed, and we should always be suspicious of causes too important to be held up to scrutiny. Read more here.
By Ken Gregory
The IPCC used the CO2 forcing of 3.71 W/m2. They multiply this by a feedback factor of 3.08, which boosts the total forcing due to CO2 to 11.4 W/m2. Monckton’s summary shows that 76% of this feedback factor is due to clouds and water vapour (with lapse rate change). But both of these feedbacks are the wrong sign! Roy Spencer shows that clouds cause a negative feedback, not positive, based on satellite data. He shows that modeler have interpreted cloud changes as a feedback, instead of a cause of temperature change. This reversal of cause and effect makes cloud seem like a positive feedback, when they actually cause a negative feedback. But more importantly, the IPCC assumes that water vapour causes the largest positive feedback, but the Hartcode simulation runs using the NOAA water humidity data shows that water vapour causes a large negative feedback. You have seen my graph of relative humidity before which is linked here.
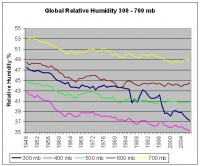
All climate models assume that relative humidity remains approximately constant with global warming. So if CO2 initially causes a small warming, this causes an increase in water content in the models, resulting is a large positive feedback But the data shows a 21% drop of relative humidity at about 9 km altitude, just where the predicted hot spot is missing, directly contradicting the models.
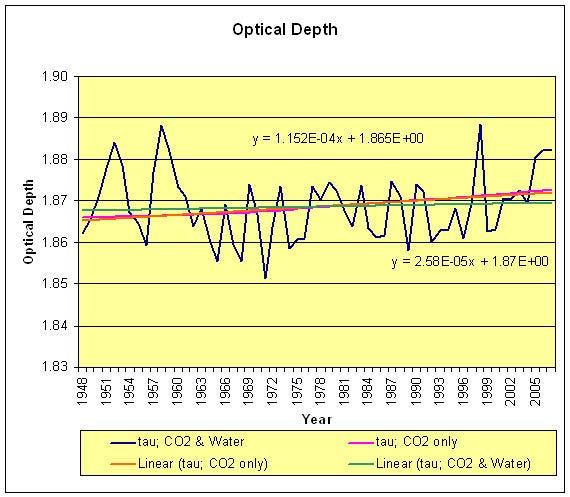
The Hartcode simulation makes no assumptions of how the greenhouse effect works, or how much temperatures changes with optical depth changes. (Optical depth is related the surface radiation flux Su by Su = OLR(1+tau +exp(-tau))/2, where tau = optical depth). Here is a graph showing the optical depth changes over the last 60 years (water vapour and CO2), and the change due to CO2 only.
Look at the pink curve, CO2 only. This is with water vapour held constant and CO2 only changing. The trend (orange line) shows an increase of 1.152 10-4 X 60 years = +0.0069, or about +0.37% in 60 years, confirming our belief the CO2 has a tiny direct effect on temperature.
The blue curve shows the optical depth including CO2 and water vapour. Note that water vapour varies much more that CO2. But instead of causing a huge positive feedback, water caused a strong negative feedback, and reduced the optical depth trend (green line) to 2.58 10-5 X 60 years = + 0.0015, or about 0.083% in 60 years. This means that water vapour has offset 78% of the greenhouse effect of CO2 change over the last 60 years. This is very significant! Note also that there has been a dramatic drop in water vapour at all altitudes in 2008, which is not included in the above calculations. I do recognize that the early NOAA data might be less accurate than more recent data, but this is what the data shows.
This data supports Miskowski’s theory of the greenhouse effect. Miskolcki shows the standard theory uses inappropriate boundary conditions. When real boundary conditions are used, he shows that the atmosphere maintains a saturated greenhouse effect, controlled by water vapor content. I encourage you to review this article, based on a draft by Dr. Noor van Andel. In summary, I think there are two main reasons climate models fail: 1. water vapour causes a negative feedback, not a large positive feedback, 2. clouds cause a negative feedback, not a positive feedback. See PDF here.
By John Myers, Forum Communications Co.
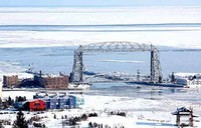
If the big lake seems to have an unusually placid appearance off Duluth’s shores these days, it’s because you’re looking at ice. Ice has formed on Lake Superior off the Twin Ports and near Bayfield, among other places. It is the first time in years that ice has formed on the lake this early in the winter season. The western tip of Lake Superior has frozen over in December for the first time in recent memory, and that could mean a long season of ice angling that hasn’t been seen in years.
“We were just talking that it’s been something like 17 years since we had a good, long ice fishing season at this corner of Lake Superior,” said Russ Francisco, owner of Marine General sporting go ods store in Duluth. “This is the most ice I’ve seen in December in years. I wouldn’t go out yet, but if it stays cold and we don’t get a big wind, people will be out there fishing soon.”
While ice remains unsafe - with an emphasis on unsafe - as it continues to move around off Duluth, seeing any ice this early has been rare in recent years. Francisco said the earliest safe ice will come in the small bays near the mouths of local rivers like the Lester and the French. Francisco said in the rare years recently when Lake Superior has partially frozen, it’s usually in February or early March, after months of cold weather. Anglers and ice skaters had a few weeks of good ice in February 2007, for example, before temperatures rose and the ice blew out.
There’s also thickening ice in the channel between Bayfield and Madeline Island, and the Madeline Island Ferry Line is about to close for the season - the first time it’s closed in December since 1985. Locals and visitors hope the ice quickly becomes thick enough to drive on between the island and mainland. “We island dwellers like it because we get to drive on the ice road, and that’s a lot more convenient. And we haven’t been able to do that much inrecent years,” said Michael Dalzell, a captain for the ferry line. “We’re telling people to get their cars off the island by Friday or Saturday because we probably won’t be running any more by New Year’s.”
Not only is December ice rare on Superior, but thick ice has become the exception during any winter month. In several recent winters, the ferry line never did shut down, forced to operate all winter because ice never formed or was too thin for people to drive across.
December’s average temperature at the Duluth office of the National Weather Service has been an unusually cold 9.3 degrees F below normal, with a dozen nights below zero and one as cold as 22 below. Tom Lonka, meteorologist intern for the Weather Service in Duluth, said satellite photographs show just the western tip of Lake Superior ice-covered this week. While there’s not enough ice to make a difference yet, an ice-covered Lake Superior can even affect Northland weather, reducing open water access and diminishing lake effect snowfall. And increased ice can help keep water from evaporating, leading to more water in the lake next spring. It’s believed the lack of ice cover in recent years has been a big factor in declining lake levels. Read more here.
Icecap Note: Cold air masses will continue to dominate the North Central and after another warm day this weekend in the east return to the northeast next week. The pattern so far has been very like the pattern in our analog years (1961/62, 1964/65):
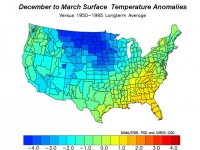
Forecast made in October for December through March
So far so good. Here is the actual through December 25, 2008. Unless La Nina comes on strong in the next month or so, this should be the pattern for the winter with the coldest weather over the region NOAA had the greatest warmth probabilities.
By the way much of the upper plains from Iowa to Wisconisn, Minnesota, the Dakotas and Montana have been averaging 7-11 degrees below normal for December. This song by Minnesotans for Global Warming is so appropriate. They followed it up with this holiday tribute to Al Gore.
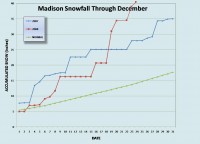
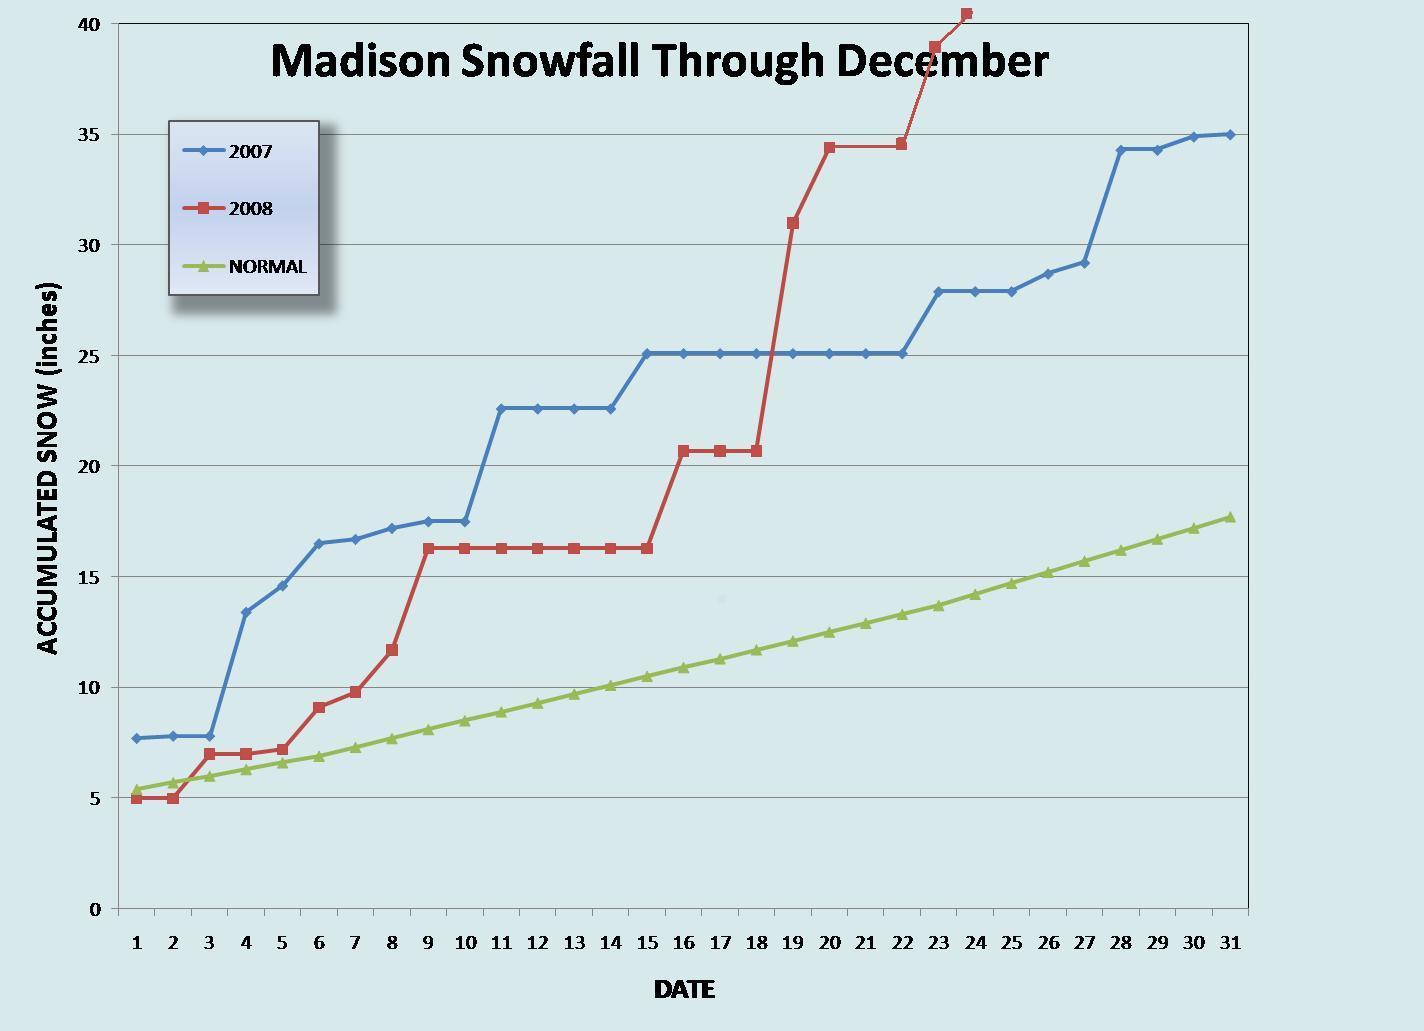
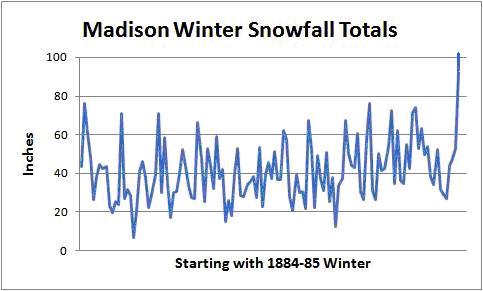
UPDATE: As of December 29, 2008, Madison reported 38.6 inches of snow for the month of December. This breaks the old record of 35.0 inches measured during the month of December 2000 AND the all time monthly record of 37.0 inches measured in February 1994 thus December 2008 is Madison’s snowiest month ever on record! Madison is 26 inches above the average for December up to the 28th, and is 7 inches higher than last year at this time (with 42.9 inches to date). With 42.9 inches already in November and December, the 1-3 inches expected on Tuesday could push the snowfall total up to the average 45 inches that normally falls in any given winter in these parts, with the brunt of winter still to come.
See more here
This is great news for skiers and snowshoe enthusiasts, kids with sleds, people who like to shovel and anyone else who subscribes to the notion that as long as it’s going to be cold outside, there might as well be plenty of snow to enjoy. Not so great for iceboaters and ice-skating enthusiasts. But if everyone was happy all at once, life might be so enjoyable we wouldn’t be able to bear all that good fortune. Read more here.
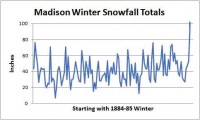
Note last year went on to shatter the all-time snowfall record for Madison by 25 inches and normal by 50 inches ending up with an incredible 101.4 inches. Could there be a repeat performance this year?
See larger image here
Madison is not alone as this post by Patrick Powell of FOX11 WLUK in Green Bay reports. Some amazing numbers there for a city known for its cold and snow.
And further north and west, Meteorologist Janine Vining, at the weather service office in Bismarck said the city has a record snowfall in December with more than 28 inches, breaking the mark set in 1916 with more to come tomorrow. She says with the next storm, the Bismarck area could get about 6 inches.
And further west the following all-time record: December 2008 snowiest month on record for Spokane, WA.
As of December 29th at 4 pm PST… The monthly snow total for the Spokane international airport was 59.7 inches. This snow total ranks first on the list of snow totals for any month and breaks the previous record of 56.9 inches set in January of 1950. Snowfall records have been kept in Spokane since 1893.
The top five monthly snow totals for Spokane are (note with two days left in the month of December...this total may climb even higher).
1. Dec 2008 59.7 inches
2. Jan 1950 56.9 inches
3. Jan 1969 48.7 inches
4. Jan 1954 46.5 inches
5. Dec 1996 42.7 inches
See larger image here
By Chris Horner, in Human Events
The most expensive secret you’re not supposed to know is that George W. Bush leaves office with the planet cooler than when he entered. This dangerous trend threatens the multi-billion dollar “global warming” industry, adding new urgency to the ritual shriek of “we must act now!” in the scramble to impose a costly regime of mandates and energy taxes.
The global warming industry’s tactics already range from comical to reprehensible. As a result of a cooling atmosphere—which thanks to the “global cooling” panic we began measuring in 1979—you are distracted with irrelevant surface temperatures. This is possibly because more than 90% of our surface thermometer network is in violation of rules for locating the instruments. For example, why are so many now on asphalt parking lots, black tar roofs, airport tarmacs, and even hanging directly above barbeque grills?
The mostly taxpayer-funded science community is repeatedly caught fudging their numbers to exaggerate and even manufacture warming. Peer-review journals place hurdles in the “skeptic” path to publication while publishing demonstrable falsehoods without bothering to check the claims’ viability.
Gang Green smears any who dare speak out as unqualified or shills corrupted by “Big Oil” money. Media and lawmakers repeat the claims, yet show no curiosity about the staggering $300 million given to Al Gore. Who is it so covetous of frightening you into accepting costly policies in the name of a “climate crisis” as to underwrite this aggressive lobbying and re-branding blitz? Gore won’t tell us, but you can bet they stand to profit at your expense.
The establishment furiously engages to shout down, censor and shut down dissent. They now have the active participation of the National Academy of Sciences thanks to a back door created to elect “environmentalists” who otherwise would not attain this status and who then exercise a veto over others who do not share their worldview. Forget the policy implications, and consider how this threatens the various institutions of science once the entire enterprise is inevitably exposed.
It is now mainstream in the campaign to suppress speech to call for criminalization of skepticism (that is, of science) and imprisonment of its practitioners. British Foreign Secretary Margaret Beckett publicly demands that media outlets refuse to grant “skeptics” space, on the grounds that they are just like Islamic terrorists. Who, then, is surprised that scientists receive professional and even death threats for their heresy, and one in Norway had the wheels fall off of his car—twice—after speaking out, once when his young daughter was a passenger? His mechanic said the lugs had been loosened. Apparently dissent is not patriotic to the global warming industry.
This is madness. It has to stop. The first step in our recovery is to have a public discussion about why proponents of the global warming agenda must stoop to these tactics. See post here.
Mr. Horner is author of ”Red Hot Lies: How Global Warming Alarmists Use Threats, Fraud, and Deception to Keep You Misinformed.”