


CTV.ca News Staff
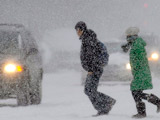
The first day of winter brought wind-chill warnings, snow and a bevy of storms to cities across Canada on Sunday, potentially laying the groundwork for the first cross-country white Christmas in nearly four decades. Environment Canada senior climatologist David Phillips told CTV Newsnet that “it looks like a very good chance” it will be a white Christmas for all parts of Canada for the first time since 1971.
“It’s just sort of the beginning of winter, and it’s a little much to expect when we have so many different climatic types in this country for it to be frozen and snow-covered from right across the huge country,” he told CTV Newsnet on Sunday. But with so much snow already on the ground, the veteran weather prognosticator said he thinks that any upcoming balmy Christmas Day temperatures will not be able to melt away the growing snowfall base. It may be in 40 years, the first one,” he said.
As for Sunday’s weather conditions, Phillips didn’t mince words. “In 10 provinces, every one of them has got some weather misery out there, and an advisory,” he said. “About the only areas not showing any advisory or warning situations are the Yukon, Northwest Territories and Nunavut.” Environment Canada snowfall warnings for Vancouver predict that up to 20 centimetres of snow will fall by Sunday evening, accompanied by bone-chilling wind-chill effects throughout the evening and into Monday. Environment Canada meteorologist Geoff Coulson told The Canadian Press that the Prairies would see very low temperatures, falling into the -30s by Sunday evening.
The storm system that began in southwestern Ontario Sunday morning has left as much as 20 cm of additional snow in some areas, and is now making its way eastward. However, much of the region is still under blowing snow warnings thanks to high winds that could gust up to 90 kilometres per hour. According to the Ontario Provincial Police, the morning snowfall caused more than 100 minor collisions north of the Toronto area between 6 a.m. and 9 a.m. Sunday. And at Pearson International Airport, dozens of flights were delayed on Sunday morning—though the runways had mostly been cleared by the afternoon.
With the storm system moving eastward through Sunday afternoon, parts of eastern Ontario, Quebec and much of the Maritimes remain under winter storm or snowfall warnings. Environment Canada predicts as much as 20 cm of snow to fall in Montreal and 30 cm of snow in other parts of Quebec by the end of the day. Some 40 flights were cancelled at Montreal’s Trudeau Airport on Sunday, and train passengers were experiencing half-hour and hour-long delays.
The weather was bad enough on Highway 40, near L’Assomption, Que., that at least 30 cars became embroiled in chain-reaction accident. Both New Brunswick and Newfoundland were expected to see snowfalls of between 10 and 25 cm, with high-speed winds accompanying some storms. Phillips said some parts of the country are seeing snowfall amounts that have outpaced last year’s record and near-record totals at this point in the season. But he also said it’s unlikely that trend will continue. “Already in many places in eastern Canada, we’re ahead of the record from last year,” he said. “But, you know, we have a long, long way to go. I’m thinking that, hey, there’s not enough left in nature to give us another one of those years.” Read more here.
See also this paper thanks to Willie Soon on the heavy snow in Victoria in British Columbia.
Meanwhile Snow paralyzes eastern and central Turkey.

By Deroy Murdock
Winter officially arrives with Sunday’s solstice. But for many Americans, autumn 2008’s final days already feel like deepest, coldest January. New Englanders still lack electricity after a Dec. 11 ice storm snapped power lines. Up to 8 inches of snow struck New Orleans and southern Louisiana that day and didn’t melt for 48 hours in some neighborhoods.
In Southern California this week, a half-inch of snow brightened Malibu’s hills while a half-foot barricaded highways and marooned commuters in desert towns east of Los Angeles. Three inches of the white stuff shuttered Las Vegas’ McCarren Airport that day and dusted the Strip’s hotels and casinos.
What are the odds of that? Actually, the odds are rising that snow, ice and cold will grow increasingly common. As serious scientists repeatedly explain, global cooling is here. It is chilling temperatures and so-called “global-warming.”
According to the National Climatic Data Center, 2008 will be America’s coldest year since 1997, thanks to La Niña and precipitation in the central and eastern states. Solar quietude also may underlie global cooling. This year’s sunspots and solar radiation approach the minimum in the sun’s cycle, corresponding with lower Earth temperatures. This echoes Harvard-Smithsonian astrophysicist Dr. Sallie Baliunas’ belief that solar variability, much more than CO2, sways global temperatures.
Meanwhile, the National Weather Service reports that last summer was Anchorage’s third-coldest on record. “Not since 1980 has there been a summer less reflective of global warming,” Craig Medred wrote in the Anchorage Daily News. Consequently, Alaska’s glaciers are thickening in the middle. “It’s been a long time on most glaciers where they’ve actually had positive mass balance,” U.S. Geological Survey glaciologist Bruce Molnia told Medred October 13.
Similarly, the National Snow and Ice Data Center found that Arctic sea ice expanded 13.2 percent this year, or a Texas-sized 270,000 square miles. Across the equator, Brazil endured an especially cold September. Snow graced its southern provinces that month. “Global Warming is over, and Global Warming Theory has failed. There is no evidence that CO2 drives world temperatures or any consequent climate change,” Imperial College London astrophysicist and long-range forecaster Piers Corbyn wrote British Members of Parliament on Oct. 28. “According to official data in every year since 1998, world temperatures have been colder than that year, yet CO2 has been rising rapidly.”
That evening, as the House of Commons debated legislation on so-called “global-warming,” October snow fell in London for the first time since 1922. These observations parallel those of five German researchers led by Professor Noel Keenlyside of the Leibniz Institute of Marine Sciences. “Our results suggest that global surface temperature may not increase over the next decade,” they concluded in last May’s “Nature,” “as natural climate variations in the North Atlantic and tropical Pacific temporarily offset the projected anthropogenic (man-made) warming.”
This “lull” should doom the 0.54 degree Fahrenheit average global temperature rise predicted by the UN’s Intergovernmental Panel on Climate Change, the Vatican of so-called “global warming.” Incidentally, the IPCC’s computer models factor in neither El Niño nor the Gulf Stream. Excluding such major climate variables would be like ESPN ignoring baseball and basketball.
So, is this all just propaganda concocted by Chevron-funded, right-wing, flat-Earthers? Ask Dr. Martin Hertzberg, a physical chemist and retired Navy meteorologist. “As a scientist and lifelong liberal Democrat, I find the constant regurgitation of the anecdotal, fear-mongering clap-trap about human-caused global warming to be a disservice to science,” Hertzberg wrote in Sept. 26’s USA Today. “From the El Niño year of 1998 until January 2007, the average temperature of the Earth’s atmosphere near its surface decreased some 0.25 C (0.45 F). From January 2007 until the spring of 2008, it dropped a whopping 0.75 C (1.35 F).” As global cooling becomes more widely recognized, Americans from Maine to Malibu should feel comfortable dreaming of a white Christmas. Read full story here. See also this story on the coast to coast first day of winter blast here.
By Bob Carter in the Australian
The Intergovernmental Panel on Climate Change model of dangerous, human-caused climate change has failed. Independent science relevant to supposed human-caused global warming is clear, and can be summarised in four briefpoints. First, global temperature warmed slightly in the late 20th century and has been cooling since 2002. Neither the warming nor the cooling were of unusual rate or magnitude.
Second, humans have an effect on local climate but, despite the expenditure of more than $US50 billion ($70 billion) looking for it since 1990, no globally summed human effect has ever been measured. Therefore, any human signal must lie buried in the variability of the natural climate system. Third, we live on a dynamic planet; change occurs in Earth’s geosphere, biosphere, atmosphere and oceans all the time and all over the world. No substantive evidence exists that modern rates of global environmental change (ice volume; sea level) lie outside historic natural bounds.
Last, cutting carbon dioxide emissions, be it in Australia or worldwide, will likely result in no measurable change in future climate, because extra increments of atmospheric CO2 cause diminishing warming for each unit of increase; at most, a few tenths of a degree of extra warming would result from a completion of doubling of CO2 since pre-industrial times. These facts notwithstanding, the Rudd Government is poised to introduce a CO2 taxation bill on doubly spurious grounds. It presumes, first, that dangerous warming caused by human emissions is occurring, or will shortly occur. And, second, that cuts to emissions will prevent significant amounts of future warming.
There is, therefore, now a dramatic disjunction between scientific reality and the stranglehold that global warming alarmism has on planned Australian climate policy. Today’s public views about climate change are based upon 20 years of promulgation of dangerous global warming by what has become a hugely powerful coalition of self-interested groups and agencies.
Beneficiaries of warming alarmism include individual scientists, managers of research centres, morally pretentious environmental non-government organisations, prestigious science academies and societies, bureaucrats from government greenhouse and climate agencies, big businesses poised for carbon trading (think Enron and Lehman Brothers), alternative energy providers, those in the media who remorselessly promulgate environmental alarm stories, and, last but not least, those uninformed politicians who seek political advantage from cynical exploitation of the public’s fear of global warming. Read more here.
Bob Carter is an adjunct research fellow at James Cook University, Townsville, and studies ancient climate change
By Joseph D’Aleo, CCM, AMS Fellow
In this story, NASA scientists suggested between 1.5 trillion and 2 trillion tons of ice in Greenland, Antarctica and Alaska have melted at an accelerating rate since 2003, in the latest signs of what they say is global warming. Using new satellite technology that measures changes in mass in mountain glaciers and ice sheets, NASA geophysicist Scott Luthcke concluded that the losses amounted to enough water to fill the Chesapeake Bay 21 times in a paper presented at the AGU conference.
The data reflects findings from NASA colleague Jay Zwally, who uses different satellite technology to observe changing ice volume in Greenland, the Arctic and Antarctica. In the past five years, Greenland has lost between 150 gigatons and 160 gigatons each year, (one gigaton equals one billion tons) or enough to raise global sea levels about .5 mm per year, said Zwally, who will also present his findings at the conference this week. GRACE measured that mountain glaciers in the Gulf of Alaska lost about 84 gigatons each year, about five times the average annual flow of the Colorado River through the Grand Canyon, according to Zwally.
The claims conflict with the reality that just recently glaciologist Bruce Molnia reported a bitterly cold Alaskan summer following a winter with extreme cold and record snows resulted in Alaska glaciers to expand, rather than shrink for the first time in at least 250 years.
Also in 2007, NASA scientists reported that after years of research, their team had assembled data showing that normal, decade-long changes in Arctic Ocean currents driven by a circulation known as the Arctic Oscillation was largely responsible for the major Arctic climate shifts observed over the past several years. These periodic reversals in the ocean currents move warmer and cooler water around to new places, greatly affecting the climate.
NSIDC also presented a paper at the AGU this week on the disappearing ice. In this BBC story, scientists say they now have unambiguous evidence that the warming in the Arctic is accelerating. Computer models have long predicted that decreasing sea ice should amplify temperature changes in the northern polar region. Julienne Stroeve, from the US National Snow and Ice Data Center (NSIDC), told a meeting of the American Geophysical Union that this process was under way.
Ironically just last year a NSIDC story correctly summarized the findings of many researchers and peer review papers that natural warming and cooling cycles in the Atlantic and Pacific were the real drivers for the cyclical changes in arctic ice over the centuries (as we have shown most recently here).
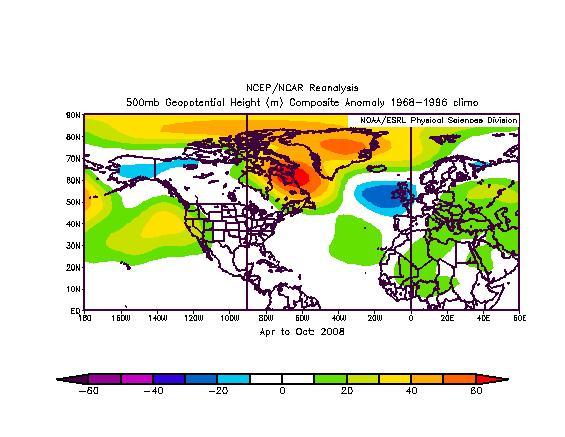
As for the Greenland melt. Though Greenland was very cold and icy last winter, high latitude blocking this spring and summer into the fall likely led to more melt. These blocks are favored by solar minimum westerly QBO conditions in summer. The block has been displaced south and east the last month allowing frigid conditions and snowfall to return.

See larger image of April to October 500m heights here. Orange and red are warm ridges. Note the warmth over Greenland, northeast Canada with cold trough Alaska (and UK)
Read much more on the Arctic and Greenland here.
By Joseph D’Aleo, CCM, AMS Fellow
Though it doesn’t rank with the Bernie Madhoff’s Ponzi scheme, it is nonetheless criminal at a time when important decisions are about to be made that will affect our way of living and economic well-being.
According to a NOAA Press Release yesterday, NCDC’s ranking of 2008 as ninth warmest if expected trends continue compares to a similar ranking of ninth warmest based on an analysis by NASA’s Goddard Institute for Space Studies. The NASA analysis indicates that the January-November global temperature was 0.76 degree F (0.42 degree C) above the 20th century mean. The NOAA and NASA analyses differ slightly in methodology, but both use data from NOAA’s National Climatic Data Center - the federal government’s official source for climate data.
Don’t believe a word of it. UAH MSU satellite data suggest 2008 will end up about the 15th warmest (16th coldest) in their 30 years of lower tropospheric data. The NASA, NOAA and Hadley data bases are seriously contaminated and the agencies are intentionally ignoring the issues as they are agenda driven with inflated budgets because of the alleged global warming.
NOAA has actually gone as far as to pull out the urbanization (urban heat island or UHI) adjustment from the US data and there is very little to no urban adjustment made to the global data based on the flawed papers by Peterson and Parker which suggest UHI has little effect on global trends. Ignored are the many other papers from some of the worlds best climatologists worldwide that suggest it produces significant contamination.
Add to that the fact that more than 2/3rds of the world’s stations (most rural) have dropped out and or are often missing monthly data, 69% of the first nearly 600 US stations evaluated by Anthony Watts surface stations.org are poor or very poorly sited with only 4% meeting official standards and no changes were made for the known biases of new instrumentation.
Not less than half a dozen peer reviewed papers have suggested the warming is exaggerated by up to 50%. This would put 2008 somewhere nearer the middle of the pack of the 114+ years in the global data bases not near the top. It also belies the claim that the 10 warmest years have occurred in the last dozen years. Read more here on the important data integrity issue.
See larger image here.
By Benny Peiser, CCNET in the Wall Street Journal
Participants at last week’s United Nations climate conference in Poznan, Poland, were taken aback by a world seemingly turned upside-down. The traditional villains and heroes of the international climate narrative, the wicked U.S. and the noble European Union, had unexpectedly swapped roles. For once, it was the EU that was criticized for backpedalling on its CO2 targets while Europe’s climate nemesis, the U.S., found itself commended for electing an environmental champion as president.
The wrangle over the EU’s controversial climate package at a separate summit in Brussels wrong-footed the world’s green bureaucracy. The EU climate deal was diluted beyond recognition. Instead of standing by plans to cut CO2 emissions by 20% below 1990 levels by 2020, the actual reductions might be as trivial as 4% if all exemptions are factored in. The Brussels summit symbolizes a turning point. The watered-down climate deal epitomizes the onset of a cooling period in Europe’s hitherto overheated climate debate. It may lead eventually to the complete abandonment of the unilateral climate agenda that has shaped Europe’s green philosophy for nearly 20 years.
The reasons for the changing political atmosphere in Europe are manifold. First, the global economic crisis has demoted green policies nearer to the bottom of the political agenda. Saving the economy and creating jobs take priority now. Second, disillusionment with the failed Kyoto Protocol has turned utopian thinking into sobriety. After all, most of the Kyoto signatories failed to reduce their CO2 emissions during the last 10 years. There are also growing doubts about the long-term viability of the EU’s Emissions Trading Scheme. The price of carbon credits has collapsed as a result of the financial crisis. The drop in demand and the recession are likely to depress carbon prices for years to come. As a result, the effectiveness of the extremely volatile scheme is increasingly questioned.
Third, a number of countries have experienced a political backlash over their renewable energy schemes. Tens of billions of euros of taxpayers’ money have been pumped into projects that depend on endless government handouts. Each of the 35,000 solar jobs in Germany, for instance, is subsidized to the tune of €130,000. According to estimates by the Rhine-Westphalia Institute for Economic Research, green subsidies will cost German electricity consumers nearly €27 billion in the next two years.
Perhaps even more important is the growing realization that the warming trend of the late 20th century has, for the last 10 years or so, essentially come to a temporary halt. The data collected by international meteorological offices confirm this. This most peculiar fact is rarely mentioned in policy debates, but it certainly provides decision makers with a vital respite to reconsider their climate policy options. Above all, Europe’s politicians have recognized that green taxes have turned into liabilities that may undermine economic stability and their chances of re-election. As German radio Deutsche Welle put it last week: “With the recession tightening its grip on the German economy, [Chancellor Angela] Merkel is betting that job reassurance is more important to the average worker than being a pioneer in tackling climate change.”
In part as a result of German—as well as Italian and Polish—objections, Europe’s climate package did not survive in its original form. The inclusion of a revision clause, pushed by Italy, is particularly significant as it makes the EU’s climate targets conditional on the outcome of international climate talks. If the U.N.’s Copenhagen conference in 2009 fails to seal a post-Kyoto deal, it is as good as certain that some of the EU’s targets will be further cut. By linking its decisions to those of the rest of the world, Europe has begun to act as a more rational player on the stage of international climate diplomacy.
Instead of yielding to the siren calls of climate alarmists, European governments would be well advised to focus their attention on developing pragmatic policies capable of safeguarding their industries, labor forces and environment at the same time. Read more here.
Hot air from ObamaBy Bjorn Lomborg, in the Australian
In one of his first public policy statements as America’s president-elect, Barack Obama focused on climate change, and clearly stated both his priorities and the facts on which these priorities rest. Unfortunately, both are weak, or even wrong.
Obama went on to say why he wants to prioritise global warming policies: “The science is beyond dispute and the facts are clear. Sea levels are rising. Coastlines are shrinking. We’ve seen record drought, spreading famine, and storms that are growing stronger with each passing hurricane season.” Yes, global warming is happening, and mankind is partly responsible, but these statements are - however eloquent - seriously wrong or misleading.
Sea levels are rising, but they have been rising at least since the early 1800s. In the era of satellite measurements, the rise has not accelerated (actually we’ve seen a sea-level fall during the past two years). The UN expects about a 30cm sea-level rise during this century, about what we saw during the past 150 years. In that period, many coastlines increased, most obviously The Netherlands, because rich countries can easily protect and even expand their territory. But even for oft-cited Bangladesh, scientists just this year showed that the country grows by 20sq km each year, because river sedimentation wins out over rising sea levels.
Obama’s claim about record droughts similarly fails even on a cursory level: the US has in all academic estimates been getting wetter through the past the century (with the 1930s dust bowl setting the drought high point). This is even true globally during the past half-century, as one of the most recent scientific studies of actual soil moisture shows: “There is an overall small wetting trend in global soil moisture.” Furthermore, famine has declined rapidly in the past half century. The main deviation has been the past two years of record-high food prices, caused not by climate change but by the policies designed to combat it: the dash for ethanol, which put food into cars and thus upward pressure on food prices. The World Bank estimates that this policy has driven at least 30 million more people into hunger. To cite policy-driven famine as an argument for more of the same policy seems unreasonable, to say the least.
Finally, it is simply wrong to say that storms are growing stronger every hurricane season. Even for the Atlantic hurricane basin, which we tend to hear about most, the total hurricane energy (ACE) as measured by the US National Oceanic and Atmospheric Administration has declined by two-thirds since the record was set in 2005. For the world, this trend has been more decisive: maximum ACE was reached in 1994 and has plummeted for the past three years, while hurricanes across the world for the past year have been about as inactive as at any time since records began to be kept.
Global warming should be tackled, but smartly through research and development of low-carbon alternatives. If we are to get our policies right, it is crucial that we get our facts right. Read more here.
Bjorn Lomborg is the author of The Sceptical Environmentalist and Cool It, head of the Copenhagen Consensus Centre, and adjunct professor at Copenhagen Business School.
By Marc Morano, POZNAN, Poland
The UN global warming conference currently underway in Poland is about to face a serious challenge from over 650 dissenting scientists from around the globe who are criticizing the climate claims made by the UN IPCC and former Vice President Al Gore. Set for release this week, a newly updated U.S. Senate Minority Report features the dissenting voices of over 650 international scientists, many current and former UN IPCC scientists, who have now turned against the UN. The report has added about 250 scientists (and growing) in 2008 to the over 400 scientists who spoke out in 2007. The over 650 dissenting scientists are more than 12 times the number of UN scientists (52) who authored the media hyped IPCC 2007 Summary for Policymakers. The U.S. Senate report is the latest evidence of the growing groundswell of scientific opposition rising to challenge the UN and Gore. The report contains:
“I am a skeptic. Global warming has become a new religion.” - Nobel Prize Winner for Physics, Ivar Giaever.
“Since I am no longer affiliated with any organization nor receiving any funding, I can speak quite franklY. As a scientist I remain skeptical."- Atmospheric Scientist Dr. Joanne Simpson, the first woman in the world to receive a PhD in meteorology and formerly of NASA who has authored more than 190 studies and has been called “among the most preeminent scientists of the last 100 years.”
Warming fears are the “worst scientific scandal in the history…When people come to know what the truth is, they will feel deceived by science and scientists.” - UN IPCC Japanese Scientist Dr. Kiminori Itoh, an award-winning PhD environmental physical chemist.
“The IPCC has actually become a closed circuit; it doesn’t listen to others. It doesn’t have open minds. I am really amazed that the Nobel Peace Prize has been given on scientifically incorrect conclusions by people who are not geologists,” - Indian geologist Dr. Arun D. Ahluwalia at Punjab University and a board member of the UN-supported International Year of the Planet.
“The models and forecasts of the UN IPCC “are incorrect because they only are based on mathematical models and presented results at scenarios that do not include, for example, solar activity.” - Victor Manuel Velasco Herrera, a researcher at the Institute of Geophysics of the National Autonomous University of Mexico
“It is a blatant lie put forth in the media that makes it seem there is only a fringe of scientists who don’t buy into anthropogenic global warming.” - U.S Government Atmospheric Scientist Stanley B. Goldenberg of the Hurricane Research Division of NOAA.
“Even doubling or tripling the amount of carbon dioxide will virtually have little impact, as water vapour and water condensed on particles as clouds dominate the worldwide scene and always will.” Geoffrey G. Duffy, a professor in the Department of Chemical and Materials Engineering of the University of Auckland, NZ.
“After reading [UN IPCC chairman] Pachauri’s asinine comment [comparing skeptics to] Flat Earthers, it’s hard to remain quiet.” - Climate statistician Dr. William M. Briggs, who specializes in the statistics of forecast evaluation, serves on the American Meteorological Society’s Probability and Statistics Committee and is an Associate Editor of Monthly Weather Review.
“For how many years must the planet cool before we begin to understand that the planet is not warming? For how many years must cooling go on?” - Geologist Dr. David Gee the chairman of the science committee of the 2008 International Geological Congress who has authored 130 plus peer reviewed papers, and is currently at Uppsala University in Sweden.
“Gore prompted me to start delving into the science again and I quickly found myself solidly in the skeptic camp…Climate models can at best be useful for explaining climate changes after the fact.” - Meteorologist Hajo Smit of Holland, who reversed his belief in man-made warming to become a skeptic, is a former member of the Dutch UN IPCC committee.
“Many [scientists] are now searching for a way to back out quietly (from promoting warming fears), without having their professional careers ruined.” - Atmospheric physicist James A. Peden, formerly of the Space Research and Coordination Center in Pittsburgh.
In addition, the report features new peer-reviewed scientific studies and analyses refuting man-made warming fears and a heavy dose of inconvenient climate developments. See the full report now available here . See media response here.
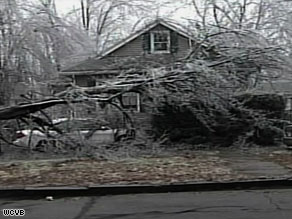
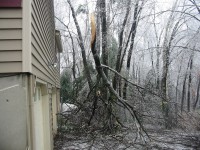
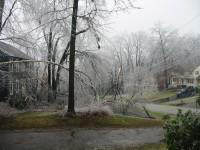
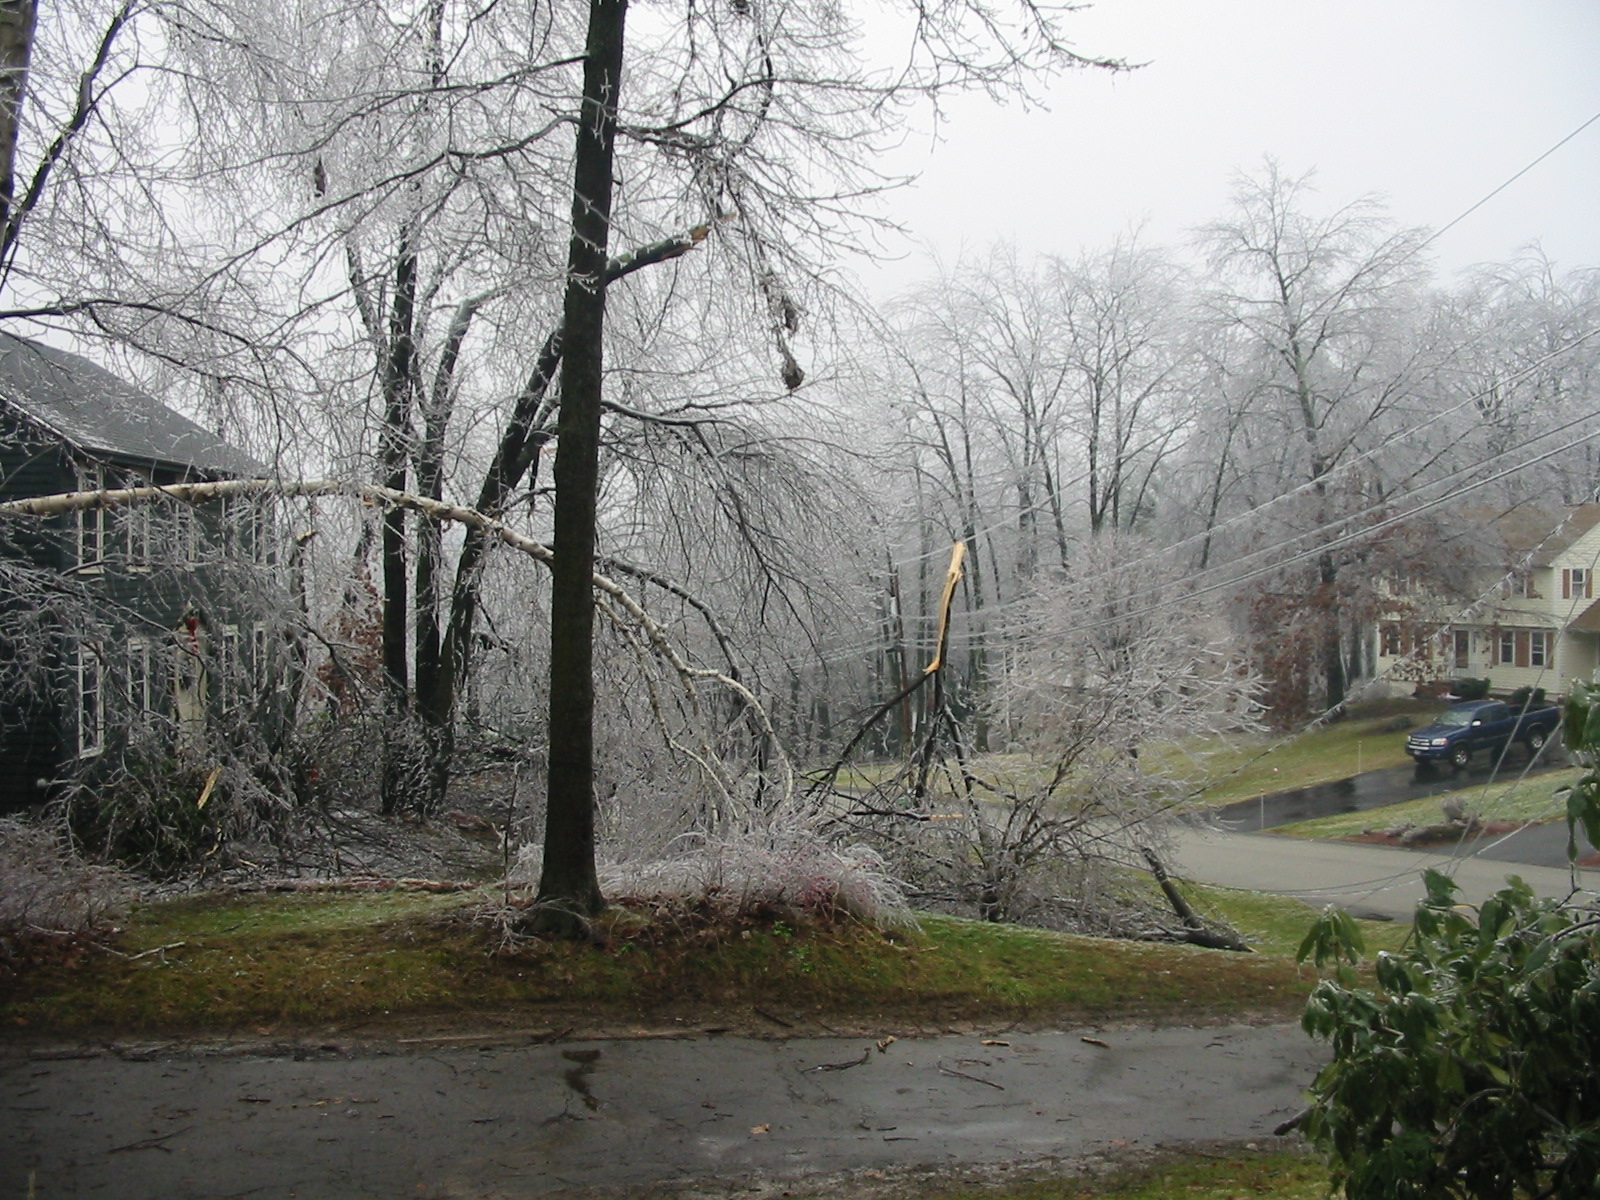
CNN
At least 800,000 customers in New England are still without electricity on Sunday after an ice storm ravaged the region, officials say. President Bush has authorized federal aid by declaring a state of emergency in New Hampshire and Massachusetts. Joseph Shoplack stayed at a Red Cross shelter Saturday night in Southwick. He lasted only one day in his home without power or heat. “They came [Saturday] and asked me how am I and I said, ‘It’s awful, it’s very, very cold and I’m not well,’” he told WWLP Channel 22.

See larger image here.
In New Hampshire, more than 300,000 residents had no electricity, CNN affiliate WMUR in Manchester said, citing reports from four of the state’s utility companies. The station reported that fire departments across the state were scrambling to respond to reports of transformer explosions, downed power lines and utility poles, as well as burning and felled trees.
State officials have asked FEMA for cots for 70 shelters, where 1,800 people slept in shelters Saturday night, said Massachusetts Emergency Management Agency spokesman Peter Judge. It may take two days to restore power to all the affected homes. “The problem is there is so much debris on the roads from the storm [that] our crews cannot get to some places,” Judge said. It may also take two days to return power to homes in Maine, officials said.
He said 750 National Guard troops have been sent to help. Although much of the ice melted Saturday, it froze again Saturday night. Read more here and here.
See larger image here.
See larger image here.
By Anthony Watts, Watts Up With That
Every once in awhile (like once a week) I happen upon a NOAA USHCN weather station that leaves me wondering - what were they thinking? The latest example is Santa Rosa, CA. Here is what the data looks like before and after NASA GISS adjusts it. These are the USHCN “raw” and “homogenized” data plots from the GISTEMP website. The before and after is quite something to behold.
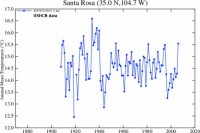
See larger image here.
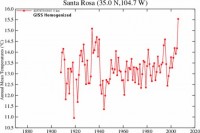
And here is the data after it has been “homogenized” using the GISTEMP algorithm, I changed the color hues to help differentiate them visually:
See larger image here.
Note that other than my applying labels and doing a hue shift, these are the exact graphs presented on the NASA GISTEMP website.
They also present the data used to plot these graphs on each of the above linked pages. You can download it yourself by clicking on the “Download monthly data as text” links at the bottom of the pages linked by the graphs above. I can’t provide direct links here due to the links being dynamically generated and as temporary files at GISTEMP. I downloaded and plotted both of these datasets myself, plus did polynomial fit trend lines. Note that missing data from 1920 has not been plotted on this graph, but simply skipped. The visual result of the before and after adjustments by NASA GISS speaks for itself:
See larger image here.
What was down, is now up. Note the hinge point in the near present. The GISTEMP data stops at 2006, it will be interesting to see what this new location does for the data in 2007 and 2008. Read full post and comments here.
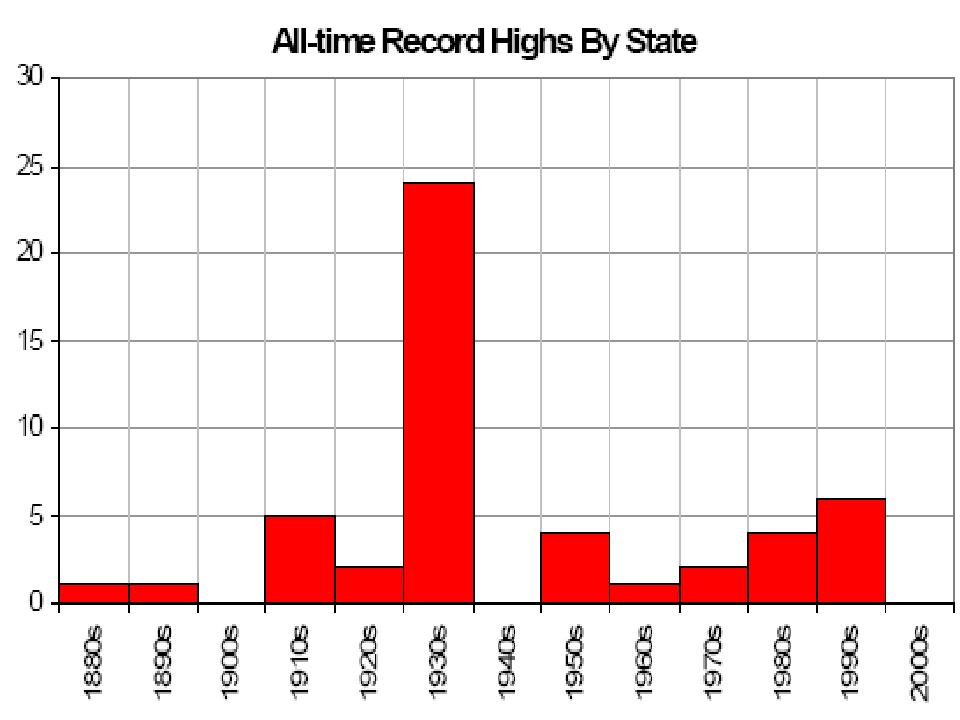
By Joseph D’Aleo, AMS Fellow, CCM
In another fable on Climate Progress, chief alarmist blogger Joseph Romm claims “The climate story of the decade is that the 2000s are on track to be nearly 0.2C warmer than the 1990s. And that temperature jump is especially worrisome since the 1990s were only 0.14C warmer than the 1980s (see datasets here). Global warming is accelerating, as predicted.”
Nothing could be farther from the truth. Of course he chooses to use the bogus GHCN/ GISS global data which is contaminated from many factors (see this EPA comment on the data issues with this data set). The issues include global station dropout (6000 to under 2000 with just over 1000 used last month). Most of the dropout occurred after 1990 and most stations that dropped out were rural. There was a tenfold increase in missing monthly data after 1990, requriing infilling of missing month using surrounding months or nearest urban stations. Both these lead to warm biases. There was a change of instrumentation that Karl of NCDC showed led to a warm bias.
After Roger Pielke Sr and others did a survey of stations in eastern Colorado and found the vast majority did not meet government standards including the climate stations, Anthony Watts started a volunteer effort to survey US climate stations in the 1221 USHCN network using the governments own criteria on surfacestations.org. About halfway through that assessment, he has found only 4% have met standards and 69% were poor or very poorly sited. All of these factors introduce a warm bias.
The most important factor though is urbanization. In order to show the warming that verifies their own models, NASA, NOAA and Hadley has using bogus research by Petersen and Parker to downplay or even remove the urban adjustment (USHCN V2 removed the USHCN V1 Karl urban adjustment based on his 1988 paper when he was an unbiased climatologist). The EPA paper lists numerous peer review papers from some of the pioneers in the field (Landsberg, Oke) that show that even small towns produce a localized warming (3F for a town of 1000 in winter) - papers Karl used in 1988. And then there are the oceans which cover 70% of the globe. The measurements over the oceans are subject to their own set of data accuracy issues.
At least a half dozen peer reviewed papers in recent years have shown these issues could exaggerate the warming by 50% the last century. That being the case, not only is the 2000s not the warmest decade the last century or millenium as some radicals claim, it not likely the warmest decade the last 70 years (the 1930s would take that prize as the state records imply). On top of all these issues, the data centers, make frequent arbitrary adjustments to the raw data, (a story for another day, addressed to some degree in the EPA comment above). There adjustments always show a cooling of the older decades especially the 1930s and 1940s and a warming of the 2000s. Like flipping a coin a dozen times and getting heads every time. Not statistically impossible, but highly improbable.
To show the difference from the raw to the various data sets, I go back to my home town and Central Park. Below in a plot of three NOAA versions of Central Park July average monthly data (1909-2007) temperatures - observed raw which can be downloaded from the local NWS site, the USHCN V1 data with Karl’s urban adjustment applied and the GHCN global data for Central Parl which inexplicably warms the raw data. The difference between the USHCNv1 and GHCN is an incredible 11F for much of the record until the 2000s when the urban adjustment was reduced from 6F to less than 2F (even as the population grew).
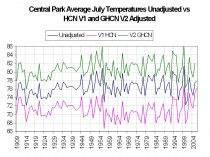
Larger image here
If our own government can’t decide what the right temperature for the nation’s premier city with a stable well documented observing site to within 11F, how can we trust the government to be able to tell us whether we are warming a few tenths of a degree F and make trillion dollar decisions based on this assessment.
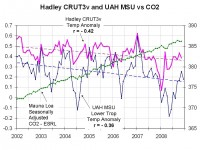
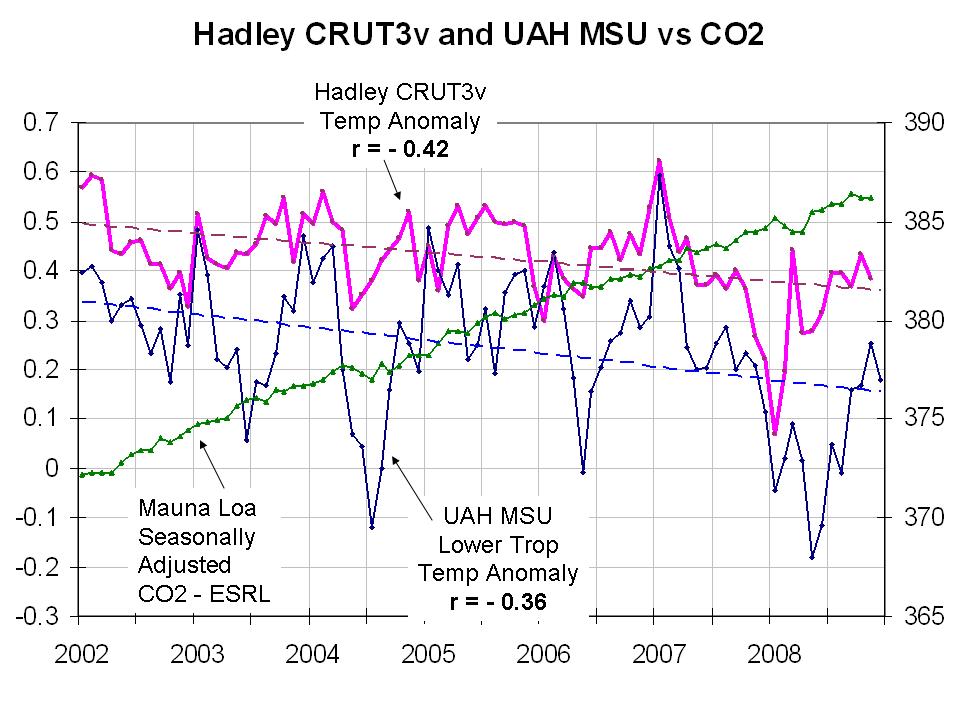
Though they are worthless for long term trends, the station based data bases can be used over short time frames. The satellites are the most accurate and objective source. They provide more complete coverage and are not subject to the same issues. They integrate any urban warmth in with rural. Unfortunately they only go back to 1979. Temperatures peaked in the El Nino year of 1998 and have not exceeded that level since. Since 2002, a very clear downtrend is seen in this plot of the Hadley CRUT3v global station and ocean data and the UAH MSU data (about 0.3F).
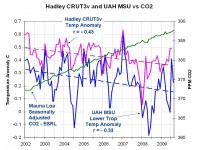
Larger image here
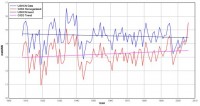
His claim warming is accelerating AS FORECAST is also belied by the plot of the IPCC forecast from just two years ago (source John Christy) which shows the various global growth and emission scenarios (yellow being no change in CO2) and actual temperatures (green and blue). I see a forecast that is busting badly. If the warming continues at this accelerated rate as Romm claims, by 2030 we will all be frozen to death.

Larger image here.
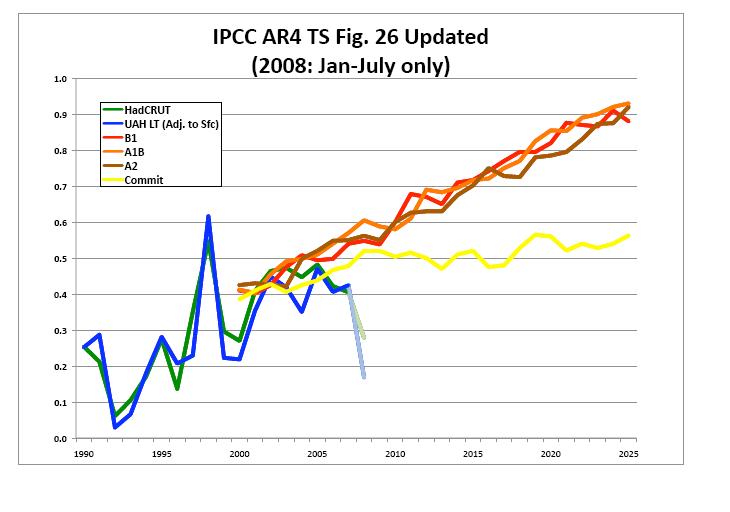
Help us fight this nonsense. Please see this letter
By James Randerson, Guardian
This year is set to be the coolest since 2000, according to a preliminary estimate of global average temperature that is due to be released next week by the Met Office. The global average for 2008 should come in close to 14.3C, which is 0.14C below the average temperature for 2001-07.
The relatively chilly temperatures compared with recent years are not evidence that global warming is slowing however, say climate scientists at the Met Office. “Absolutely not,” said Dr Peter Stott, the manager of understanding and attributing climate change at the Met Office’s Hadley Centre. “If we are going to understand climate change we need to look at long-term trends.”
Prof Myles Allen at Oxford University who runs the climateprediction.net website, said he feared climate sceptics would overinterpret the figure. “You can bet your life there will be a lot of fuss about what a cold year it is. Actually no, its not been that cold a year, but the human memory is not very long, we are used to warm years,” he said, “Even in the 80s [this year] would have felt like a warm year.”
And 2008 would have been a scorcher in Charles Dickens’s time - without human-induced warming there would have been a one in a hundred chance of getting a year this hot. “For Dickens this would have been an extremely warm year,” he said. On the flip side, in the current climate there is a roughly one in 10 chance of having a year this cool.
The Met Office predicted at the beginning of the year that 2008 would be cooler than recent years because of a La Niña event - characterised by unusually cold ocean temperatures in the equatorial Pacific Ocean. It is the mirror image of the El Niño climate cycle. The Met Office had forecast an annual global average of 14.37C.
Allen was presenting the data on this year’s global average temperature at the Appleton Space Conference at Rutherford Appleton Laboratory, near Didcot yesterday. The 14.3C figure is based on data from January to October. When the Met Office makes its formal announcement next week they will incorporate data from November. “[The figure] will differ from it, but it won’t differ massively,” said Stott, “We would expect the number to go up rather than down because the early parts of the year were still under the La Niña conditions.”
Assuming the final figure is close to 14.3C then 2008 will be the tenth hottest year on record. The hottest was 1998 - which included a very strong El Niño event - followed by 2005, 2003 and 2002. The data are a combination of measurements from satellites, ground weather stations and buoys which are compiled jointly by the Hadley Centre and the Climate Research Unit at the University of East Anglia.
In March, a team of climate scientists at Kiel University predicted that natural variation would mask the 0.3C warming predicted by the Intergovernment Panel on Climate Change over the next decade. They said that global temperatures would remain constant until 2015 but would then begin to accelerate. See story here.
See this spot-on review of this issue Cold is the new Warm by Climate Resistance. The long term ranking is not to be believed. The data is contaminated by many issues which exaggerates the apparent warming. This year was warmer than years near 1980 but probably cooler than many years in the last warm cycle in the 1930s. See this analysis here.
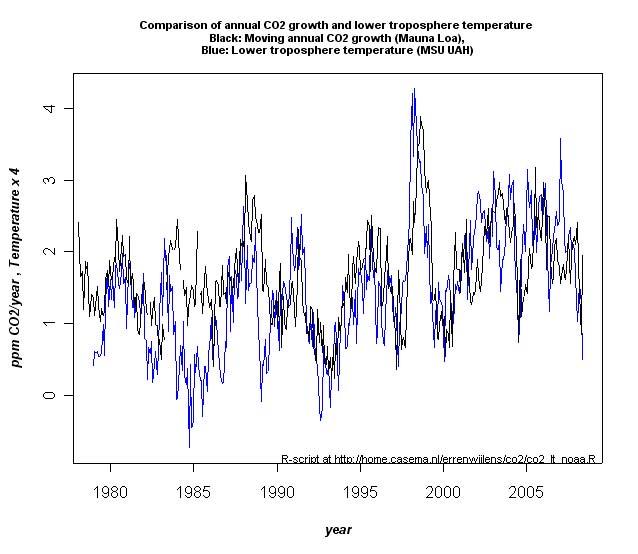
CO2 and Temperature Relationship Reaffirmed - Questions Flat Ice Core CO2-Graph During 1000 Years?By Frank Lansner
I came across Hans Errens illustration showing the yearly growth in CO2 concentration as a function of UAH global temperatures:
See larger image here.
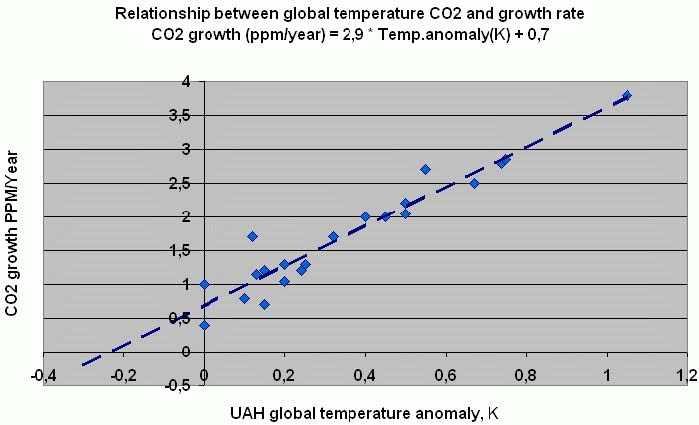
It appears from this graph that CO2 concentrations follows temperature with a lag of approximately 6-9 months. The interesting part is of course that the CO2 trends so markedly responds to temperature changes. I wanted to get a clearer picture of this relationship, and thus took approximately 20 datasets from this graph And plotted them in a scatter graph to see the trend, and got the following result:
See larger image here.
The equation is built on data in the big range from CO2 growth 0.5 to 3.5 ppm/year, and all fits fine the very same trend. So in real world today we have a CO2-growth as a function of temperature approximately: CO2 growth (ppm/year) = 2.9 temp.anomaly(K) + 0.7 . And we see that if UAH temperature anomaly should reach - 0.3 K, CO2 growth should stop.
What are the consequences?
1) The quick response up and down for CO2 trend shortly after temperature changes suggests that we see a “dance” around equilibrium conditions in nature.
2) The equation confirms that despite human or other contributions to CO2, the CO2 trend is very sensitive to temperature. This is a fact. For example if temperature rises 0.5 degrees and this trend holds for around 30 years, we should see a trend of approx 1.5 ppm CO2/year, over 30 years adding up to a net CO2 build up of 45 ppm.
Is it realistic then, that CO2 concentration should have been constant within a 15 ppm band for almost 1000 years? This would require extremely constant temperatures. Even temperatures from IPCC AR4 could not fulfil such invariability it would take to keep CO2 almost unchanged. Read more here
See the detailed Dr. Jeffrey Glassman paper The Acquittal of Carbon Dioxide that found the same thing in the ice core data here.
By Joseph D’Aleo, CCM, AMS Fellow
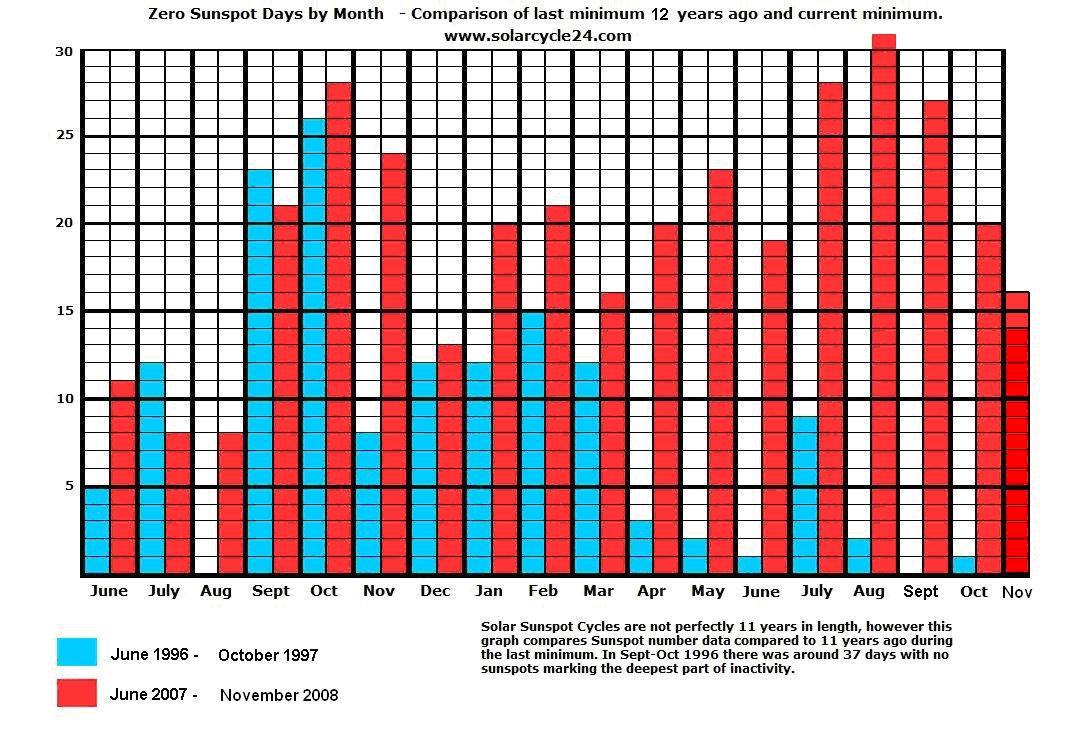
One of our loyal Canadian Icecap readers asked us to comment on the fact we are now at the end of November, in the top five years with the most sunspotless days the last century (ranking #3) perhaps even heading topwards a #2 finish depending on how many spotless days we have in December. Here is a comparison of monthly spotless days in this cycle 23 minimum (red) versus the last cycle 22 minimum in the mid 1990s (blue).
See larger image here
Notice how quiet and prolonged this minimum has been compared to the last minimum. As of today, December 8, we have had 246 spotless days in 2008, enough to put us in 3rd place ahead of 1954. Today will extend the latest string of sunspotless days to 21, 8 this month. If we match November’s 16 spotless days in December, we will be in a virtual tie for second place with 1912 (with 253 spotless days) behind just 1913 which had 311 spotless days (data source SIDC).
See larger image here
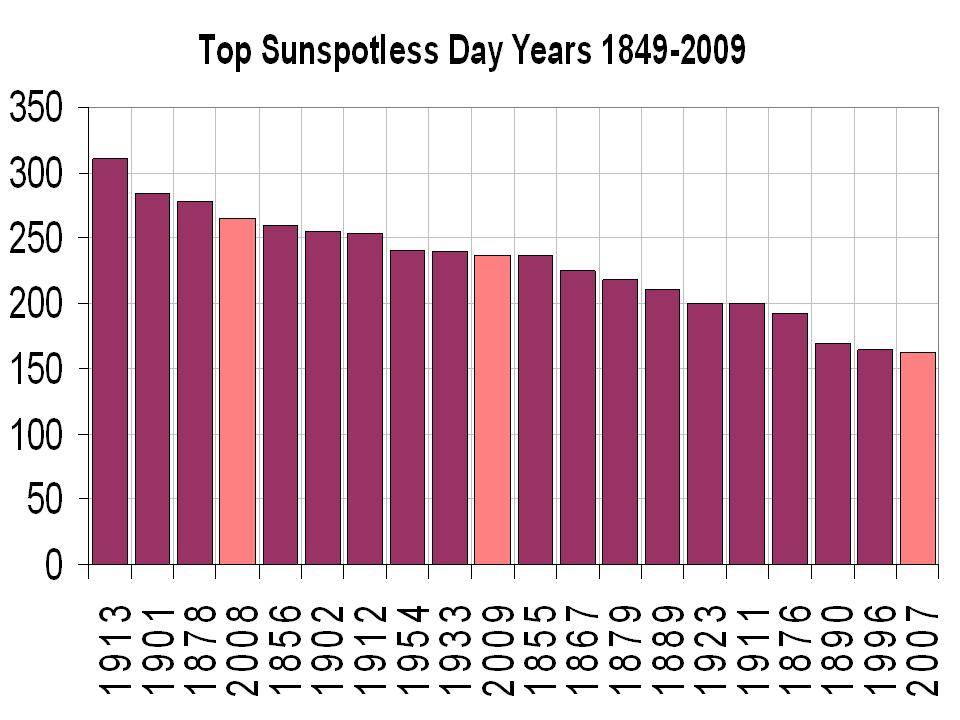
Notice how 2007 and 2008 are both in the top 10.
So far in the solar minimum after cycle 23, we have had 489 spotless days, the most since cycles 14-16, in the early 1900s. Note in cycle 14, three years came in the top 10 for spotless days, 1911, 1912, 1913. This is the second year in this cycle in the top 10. 1912 was the second high spotless year after cycle 14.
QUIET SOLAR PERIODS ARE COLD PERIODS
Case in point the Maunder Minimum during the little ice age, virtually spotless for decades/centuries from the late 1400s to early 1700s. The early 1800 quiet sun period known as the Dalton Minimum was a mini ice age. Cold returned in the late 1800s and early 1900s with again a declining sun.
See this story in the Toronto Star by Adam Mayers from February 2007. It talks about 1911/12 winter, the worst winter of the century for that city.
“It may seem cold this week, but it is nothing, nothing, compared with the winter of 1912, a year that remains in the record books as the worst winter of the past 100 years. By mid-January, it was so cold Toronto harbour was frozen solid. By early February, the near-shore lake ice was a metre thick, and you could skate from Toronto to Hamilton if you had the time. By the middle of the month, everyone was taking bets on whether the lake was frozen over. By month-end, it was. It was the rumour that the lake ice was finally solid from Toronto to Rochester that brought a huge crowd to Sunnyside Park on the afternoon of Feb. 11, 1912. They wanted to witness what the Star called a once-in-a-lifetime experience, “a spectacle they had never seen before and may never witness again.”
Read more here (UPDATED). See David Archibald’s post on Warwick Hughes site on the evidence for and implications of another Dalton Minimum.
Shaping Economic Analysis to Suit Climate PoliticsBy Roger Pielke Jr., Prometheus
Today’s ClimateWire reports that California’s proposed climate policy - known by its bill number as AB32 - has been soundly criticized by a distinguished panel of six internationally recognized economists with expertise in carbon policies: California intentionally skewed its analysis of the economic effects of its climate change plan, according to a review by state-commissioned economists.
All six economists found the analysis deeply flawed, and several even said the state hand-picked data to improve the economic case for reducing greenhouse gas emissions. Wow. When policy makers and experts shape an analysis to suit a political agenda some people have been known to throw around terms like a “war on science”. Somehow I doubt that we’ll hear any concerns about a “war on economics” being waged by the state of California. More seriously, what is going on here is that advocates for certain policies face temptations to present those policies in the best possible light in order to increase the chances that the proposed actions will be adopted. As we’ve argued here for a long time, such biased analyses can be found across issues and the political spectrum, even in the case of California’s carbon policy.
The fact that California’s AB32 has failed peer review does not mean that it is necessarily a bad idea, it just means that policy makers and Californians really have no idea what the effects of the proposed policy will actually be when implemented. The consensus of the peer reviewers is that the costs of the proposed policy are likely to be much higher than the state’s economic analysis suggests, and there are far more uncertainties than the analysis considers.
Disappointingly, but not surprisingly, the state of California largely brushes off the peer review comments with the following rather amazing dismissal: Economic modeling is not an exact science, and there will always be different opinions about assumptions and how to apply the available tools. This is to be expected. So if economic modeling is really about opinions, of which there are many, then why in the world submit any such analysis for peer review?
Attached are a few excerpts from the peer review submissions, which include some very strong criticisms. The peer review report can be found here in this PDF. Read Roger’s full post and comments here.