


World Climate Report
No self-respecting global warming presenter would ever miss the chance to warn the audience that higher temperatures could melt ice in places like Greenland, the melting water could lubricate the interface between ice and rock, and watch-out, the ice could increase its velocity, fall or move quickly into the sea, and cause a rapid rise in sea level. If you happen to be Al Gore, you might show us melting ice, water pouring into some moulin (Figure 1), and then cap it off with an image of water drowning out the World Trade Center Memorial. This story in its near infinite varieties appears on literally thousands of websites dealing with the global warming issue.
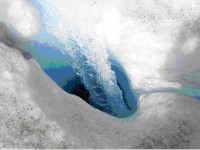
Figure 1. A moulin is typically a narrow tubular chute through which water enters a glacier from the surface. Moulins can go all the way to the bottom of the glacier, and the water from moulins may help lubricate the base of the glacier, and according to Gore and others, this could accelerate the movement of the ice.
A recent article in the prestigious Science magazine has an alarming title that should thrill the greenhouse crusade: “Large and Rapid Melt-Induced Velocity Changes in the Ablation Zone of the Greenland Ice Sheet.” Holy cow - it’s just like Gore warned us. However, once we dove into this article, we found an amazing twist given the threatening title, and we could not wait to feature the piece on World Climate Report.
Probably the largest surprise in the article can be seen in the Figure 3 in which we can see the velocity changes at many sites over the 17-year period. The authors note that “The overall picture obtained by averaging all stake measurements at all sites for individual years indicates a small but significant (r=0.79, P < 0.05) decrease of 10% in the annual average velocity over 17 years". Despite all the talk about moulins, melting, rapid acceleration of ice, van der Wal et al. reveal that the ice movement in western Greenland over the past 17 years has slowed significantly!
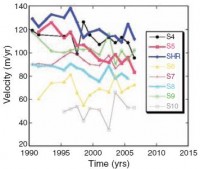
Figure 3. Variations in annual velocity along the K-transect over 17 years; sites with a significant decrease over time are depicted as thick lines (from van de Wal et al., 2008).
See full size images and read much more here.
By Michael Asher, Daily Tech
GISS’s October Data. The large reddish-brown area in Russia is actually September readings. Amateur team finds NASA error similar to one they discovered a year ago.NASA’S Goddard Institute for Space Studies (GISS) is one of the world’s primary sources for climate data. GISS issues regular updates on world temperatures based on their analysis of temperature readings from thousands of monitoring stations over the globe. GISS’ most recent data release originally reported last October as being extraordinarily warm-- a full 0.78C above normal. This would have made it the warmest October on record; a huge increase over the previous month’s data.
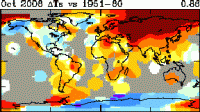
Those results set off alarm bells with Steve McIntyre and his gang of Baker Street irregulars at Climateaudit.org. They noted that NASA’s data didn’t agree at all with the satellite temperature record, which showed October to be very mild, continuing the same trend of slight cooling that has persisted since 1998. So they dug a little deeper. McKintyre, the same man who found errors last year in GISS’s US temperature record, quickly noted that most of the temperature increase was coming from Russia. A chart of world temperatures showed that in October, most of Russia, the largest nation on Earth, was not only registering hot, but literally off the scale.
Yet anecdotal reports were suggesting that October was actually slightly colder than normal. Could there be another error in GISS’s data? An alert reader on McKintyre’s blog revealed that there was a very large problem. Looking at the actual readings from individual stations in Russia showed a curious anomaly. The locations had all been assigned the exact temperatures from a month earlier-- the much warmer month of September. Russia cools very rapidly in the fall months, so recycling the data from the earlier month had led to a massive temperature increase. A few locations in Ireland were also found to be using September data. Steve McKintyre informed GISS of the error by email.
According to McKintyre, there was no response, but within “about an hour”, GISS pulled down the erroneous data, citing a “mishap” and pointing the finger of blame upstream to the National Oceanic and Atmospheric Adminstration (NOAA). NOAA’s Deputy Director of Communications, Scott Smullens, tells DailyTech that NOAA is responsible only for temperature readings in the US, not those in other nations.The error not only affected October data, but due to the complex algorithm GISS uses to convert actual temperature readings into their output results, altered the previously published values for several other months as well. The values for August 2008, for instance, changed by 0.11C and the global anomaly as far back as 2005 increased by a hundredth of a degree.
GISS is run by Dr. James Hansen, a strident global warming advocate who has accused oil companies of “crimes against humanity”. Hansen recently made headlines when he travelled to London to testify on behalf of a group of environmentalists who had damaged a coal plant in protest against global warming. Hansen also serves as science advisor to Al Gore. Dr. Hansen could not be reached for comment.
See Michaels blog here.
By Ross McKitrick, U of Guelph
Dear Colleagues
Following my testimony before the House Energy and Air Quality Subcommittee in Washington last summer, chairman John Dingell sent me a letter asking a set of follow-up questions. I am told by a staffer in DC that this was somewhat unusual because the deadline for on-the-record questions closed a long time ago. However, I was pleased to be given the opportunity to elaborate. I have attached my letter, in case you are interested in the questions and my answers. I have posted this letter here.
Cheers,
Ross
Icecap Note: The second link above provides a long litany of peer review work by Ross et al relative to the Hockey Stick and global temperatue observation issues. It is a very comprehensive source and a real credit to Ross for the continuing stream of good work he has done alone and with others over the past decade to correct the misleading and erroneous information provided by the IPCC, CCSP, MBH and friends and of the national data centers.
The first link is his very detailed letter to Chairman Dingell. It is a credit to Chairman Dingell that he actually care about getting at all the facts. We will not be able to provide more than just a few excerpts of 1 of Ross’s reponses here.
The third question was “Is the tropical troposphere more or less sensitive to climate change than the troposphere at the poles?”. Ross responded “I believe you mean “more or less sensitive to greenhouse gases”. I will answer the question first with reference to the predictions of models and then with reference to the observed data.
Climate models in which greenhouse gases are assumed to be capable of causing significant global warming show greater sensitivity to greenhouse gases in the troposphere over the tropics than over the poles. The US Climate Change Science Program (CCSP) presented very similar results for a more recent interval. The CCSP report (Figure 5.7, p. 116) presented an atmospheric weather balloon series for the interval 1979-1999, (Hadley AT2) in a format similar to the backcast panels. You can see the comparison below. This balloon record exhibits no overall warming pattern in the tropical troposphere: instead here is slight cooling at lower altitudes, and minimal warming at the upper altitudes. The tropospheric warming is at a lower rate than in the troposphere as a whole and lower in comparison to the North Pole region. The CCSP text (fn 66, p.115) points out that this data span includes the ‘end-point effect’ of the powerful 1998-1999 El Nino so the absence of tropical tropospheric warming is an even more conspicuous discrepancy with the models.
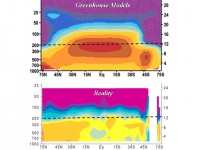
See larger image here
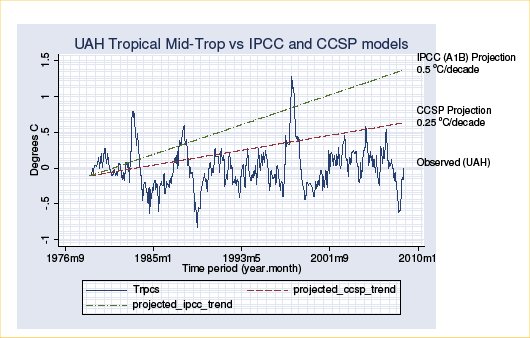
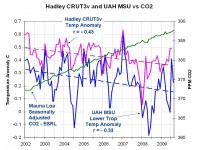
Weather satellite records for the mid-troposphere are available from Remote Sensing Systems (RSS) in California and the Earth Systems Science Center at the University of Alabama-Huntsville (UAH). I obtained the data from each lab for the mid-troposphere layer covering January 1979 to September 2008. Over this interval the annual average atmospheric concentration of CO2 measured at Mauna Loa Hawaii rose from 337 ppm to 384 ppm, a 14% increase. I have graphed the RSS and UAH tropical mid-troposphere series and compared them to the CCSP- and IPCC-predicted trends (0.25 C/decade and 0.5 C/decade respectively). In contrast to climate model predictions the data indicate neither significant warming in the tropics nor greater warming than at the poles.
See larger image here
Read much more detail on this issue and the other questions Dingell asked here.
By Joseph D’Aleo, CCM, AMS Fellow
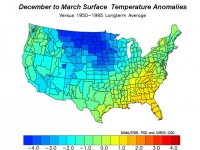
Early snowstorms and cold have been in the news here in the US and UK. Models have more snow and winter-like cold in their forecasts for mid November. What about the winter?
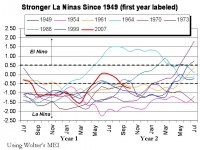
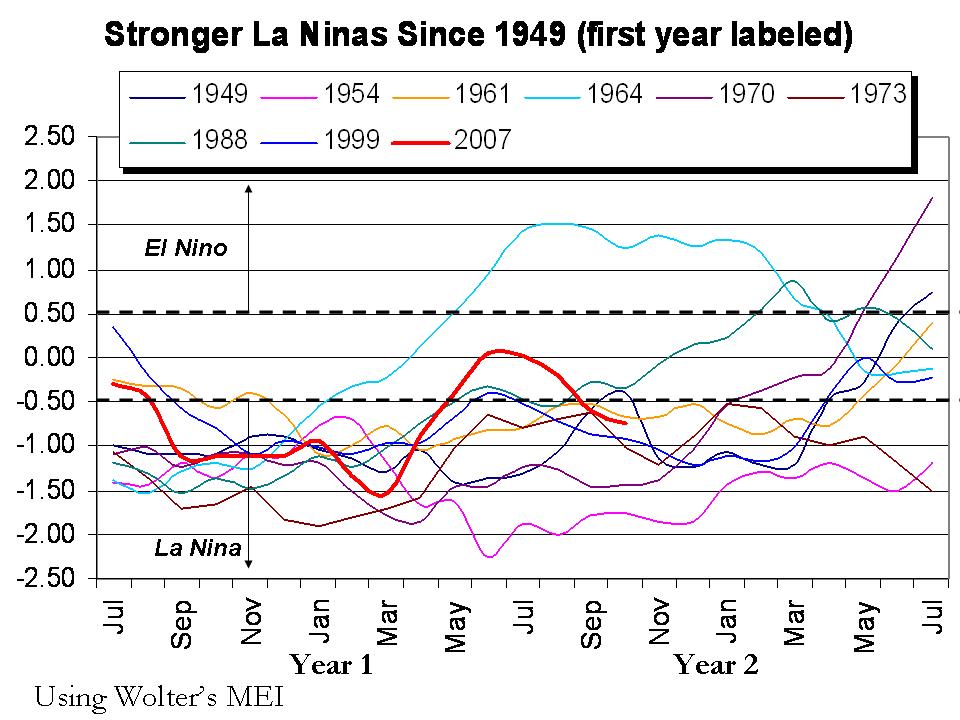
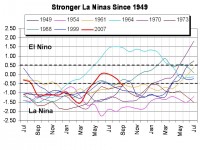
La Nina is gradually returning. The Multivariate ENSO Index (MEI) has dropped to -0.74 in October, well into weak La Nina territory. The tropical Pacific sea surface temperatures all the way from South America to beyond the dateline are back below normal. The North Pacific as a whole remains strongly in the cold mode (negative PDO). The Atlantic is weakly in its warm mode (Atlantic Multidecadal Oscillation is positive). The sun recently showing slight signs of life is still at solar minimum levels. The winds in the stratosphere over the tropical Pacific are blowing anomalously westerly) in their Quasi Biennial Oscillation.
All these conditions point to another cold winter in all but the southeastern United States, most of central and western Canada, most of western Europe, eastern and southern Asia. Expect a coolish summer in South Africa, Indonesia and South America and parts of New Zealand and Australia.
See larger image here
See larger image of US temperature anomalies (F) here
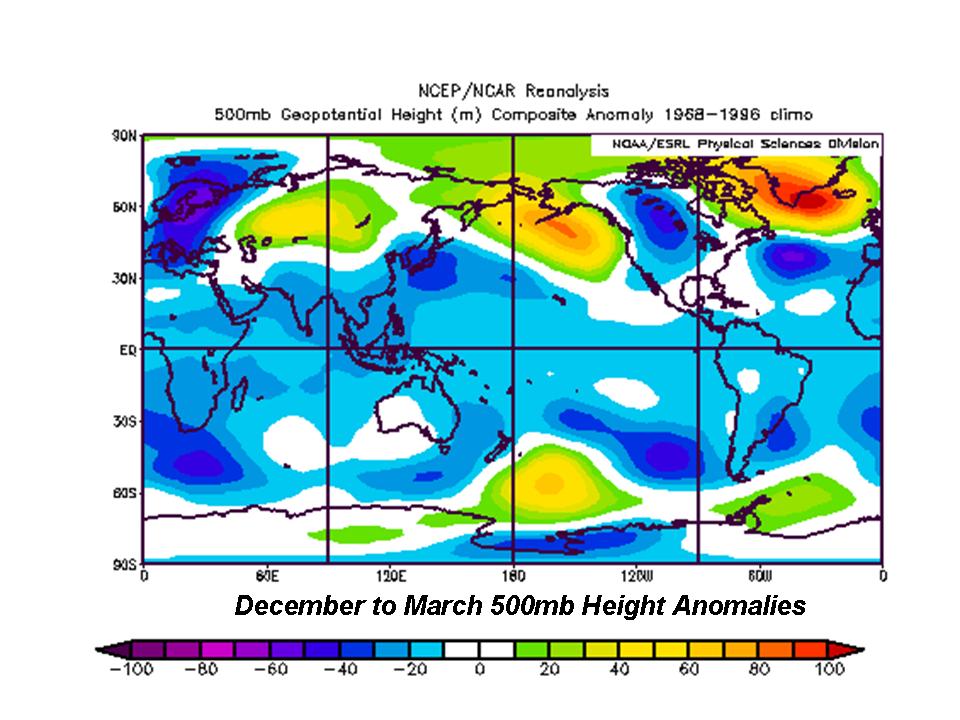
We are already seeing early cold and snow in the northern Rockies and Plains and even in the UK. Cold weather appears to be in the cards for eastern Asia the next week or two. Blocking high pressure seen above in first figure in the North Atlantic is what will keep northwest Europe and the eastern United States cold. Snow should be heaviest relative to normal from the northern and central Rockies, northern and central Plains, Ohio Valley to the Mid-Atlantic and southeastern New England. Snow to north should be less than last year but snowcover will be most persistent there.
WHAT TO WATCH FOR: Should La Nina become stronger than expected, the southeast warmth will be more pervasive and extend further north and west the second half of winter. That is the classic pattern in west QBO La Ninas. However, most strong La Ninas as was the case last winter reprise in a weakened form the second winter especially if they weakened as much a this one did during the intervening summer. The maps about are based on that assumption.
See larger image here
By Meteorologist Art Horn
Recently I was looking at some graphical temperature data from NASA. I was able to find a graph of United States temperature from 1880 up to 1999. I then went to the NASA GISS site and found the most recent plot of this data. I wanted to compare the two and see if there had been any changes in the trends. Each graph was on a different scale so I had to fit one to the other so they could be compared. After that I saved each image and opened them each in a simple paint program. In this way I could toggle between the two and visually see any changes that might have taken place.
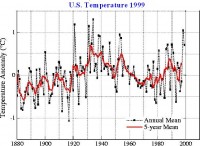
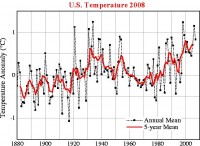
See PPT PDF to toggle back and forth using forward and back arrows
Well it was quite an eye opener! Going back and forth between the images there is a clear cooling the temperatures before 1970 and a clear warming of the temperatures after 1970. It is unmistakable and quite remarkable. Figure one is the temperature data from 1880 to 1999. Figure two shows the most recent plot. I suggest you save each image in your computer then bring them back up in some program that allows you to toggle rapidly back and forth so you can see the changes.
We all know that Dr. James Hansen is one of the worlds most visible global warming alarmists. He is also caretaker of the NASA GISS data. It would appear that he is not happy with the trend of temperature in the United States. It would also appear that he is doing something about it. By adjusting temperatures in the past downward and adjusting more recent temperatures upward we get an amplification (or at least the appearance of one) of the rise in temperature between the late 1970s and the late 1990s. If these adjustments continue we will eventually have a new “Hockey Stick” graph. The old Hockey Stick has been broken and thrown away by most although Dr. Mann is attempting to duct tape it back together again. Now Dr. Hansen is gradually fashioning a new stick by adjusting the United States temperatures more to his liking.
On September 13th , 2008 I wrote a letter to Dr. Hansen’s boss at NASA Michael Griffin explaining my dissatisfaction of having Dr. Hansen in charge of the very data that is used to support his alarmist point of view. To date I have not received a reply.
By Dr. Willian Flood, Dumfries in the Scotsman
No doubt some readers will have been alarmed by your report (31 October) that scientists from the University of East Anglia’s climate research unit claim to have “finally” proved human behaviour is responsible for warming at the north and south poles, leading the public to assume the ice caps are melting.
This alarm may have been tempered somewhat by the disclosure that the so-called “scientific” proof was the result of yet another computer simulation, which, almost by definition, bears no relationship to reality.
The facts can be easily verified and are somewhat different. The Antarctic has shown no general warming trend in the past 30 years, whether one uses ground station records or satellite or weather balloon data, nor is there any evidence of diminishing sea ice extent. In 2007, the Antarctic winter sea ice maximum was at an all-time high and 2008 levels have been consistent with the long-term average.
The Arctic has shown a warming of about 1C since 1995 and there has been some reduction in ice coverage. A recent Nasa study found the warming was probably due to changed ocean currents carrying greater amounts of warm water into the Arctic basin from the Pacific and Atlantic.
However, recently there has been yet another change in ocean circulation patterns and Arctic ice is once again close to average values for this time of year. It remains to be seen whether this Arctic cooling trend will continue.
On the basis of real data, there is no likelihood of the Antarctic ice cap melting nor of the Greenland ice cap sliding into the sea and causing a 7m rise in sea levels, as has been fancifully suggested. The Argo buoy system launched in 2003 to search for increasing ocean temperatures can find none, nor can the Topex/Poseidon satellite find any evidence of rapidly rising global sea levels, unless you call 2.5mm per year rapid.
The climate industry relies on alarmism to maintain a steady flow of research grants and financial contributions but none of its apocalyptic visions are coming to pass. Politicians should take note. See letter here. Note the ice extent in the arctic increase in October was the greatest in history.
See larger here.
By Joseph D’Aleo, CCM, AMS Fellow on Intellicast
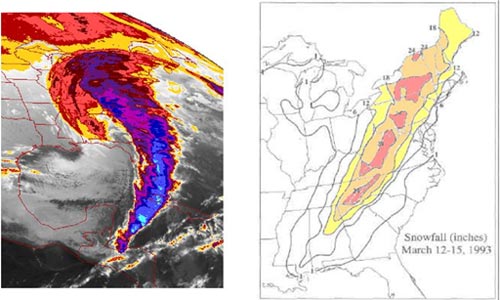
STORM OF THE CENTURY MARCH 12-15, 1993
It was an El Nino year that had delivered lots of snow for New England but was rather mild and lackluster in many areas. Then came this mid-March blockbuster that was well predicted by the computer models days in advance and was being hyped in the media as a storm likely to be historic. Unlike many other storms, this storm lived up to the hype. With a level of confidence they had never experienced, forecasters began using terms like “of historic proportions” to describe the impending storm. In turn, this allowed, for the first time, officials such as the governors of New York and the New England states to declare states of emergency prior to the first snow flake falling on their states and take actions to mitigate potential disaster.
The storm became one of the most intense nor’easters to ever strike the Eastern United States. Record low pressures, wind speeds, low temperatures and mountainous snowfall amounts were more than enough for this storm to gain the status of “Storm of the Century” early in its existence. Indeed, this storm was monumental, killing over 250 people and cancelling 25% of the United States’ flights for two days.
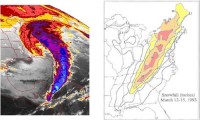
See larger image here
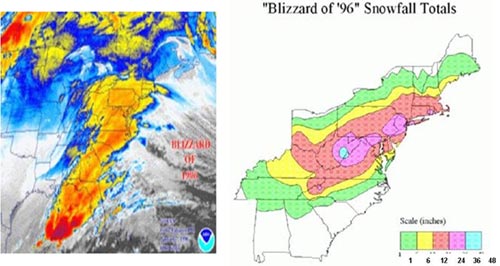
THE BLIZZARD AND WINTER OF 1995/96
The winter of 1995/96 was a record breaker for many of the big cities of the east and central United States. A very weak La Nina winter with very strong repetitive Atlantic blocking situation produced a continuous series of moderate snowstorms and one blockbuster storm called the “Blizzard of ‘96”. The Blizzard of 1996 was incredibly massive and truly historic in its scope. All-time snowfall records were widespread, including 24.9 inches in Roanoke, Virginia; 30.7 inches in Philadelphia, Pennsylvania; 27.8 in Newark, New Jersey; and 14.4 inches as far away as Cincinnati, Ohio. Every city along the northeast megalopolis, from Washington to Boston, received between 17 to 30 inches of snow. While other storms have been bigger in any given city, it appears that there has never been a greater snowfall event for such a large, highly populated area of the Eastern U.S..
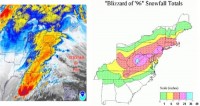
See larger image here
The storms came at a steady stream from November to May. By the time, it had warmed enough to produce mainly rain, all-time seasonal snow records were set in many locations. By the end of the 1995-1996 winter season, New York City had experienced 16 snowstorms and recorded more than 75 inches of snow. In many cases, seasonal snowfall exceeded 250 or even 300% of the normal. Read much more on these two storms and the record setting winter of 1995/96 here. The two premier storms affecting the northeast ranked number 1 and 2 on the Northeast Storm Impact list compiled by Paul Kocin and Lou Uccellini in their AMS monograph on Northeast Snowstorms.
A week from Monday(November 10), we will post a story on two major storms in what was an all-time record snow year in 2007/08 in other spots here.
At least seven people have been found dead after ”the worst snowstorm on record in Tibet,” China’s state-run news agency reported Friday. About 1,350 people were rescued in Lhunze County—another 300 were trapped—after nearly five feet (1.5 meters) of snow blanketed much of Tibet this week. The storm caused buildings to collapse, blocked roads and killed about 144,000 head of cattle, the state-run China Daily newspaper reported. The seven people who died either froze to death or were killed as a result of collapsing buildings, and one person is still missing, China Daily said. The BBC added: Heavy snowstorms have hit eastern Tibet over the last few days, worsening the situation for survivors of the earthquake earlier this month. Temperatures plummeted as snow started falling on Sunday.
At least two people are reported to have died and many more are missing. Snowfalls have blocked roads, caused avalanches and led to widespread power cuts. Thousands of people have been living in tents or temporary shelters since the earthquake on 6th October. Relief materials including food and blankets are flooding into the area. Heavy snowstorms are rare for this part of Tibet in October, and temperatures are unseasonably cold.
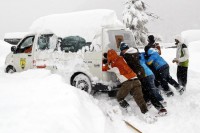
Record snow storm in Switzerland - The most snow for any October since records began in 1931 - 30 Oct 08 - A heavy, wet snow snapped trees, which fell across tracks and roads. The most affected regions included Zurich, Schaffhausen in the north and the areas around the Gotthard pass in central Switzerland.`Farmers in the Bernese Oberland also awoke to snow-related problems. Damaged fences allowed their cows to wander freely.`According to MeteoNews, the Swiss lowlands received the most snow for any October since records began in 1931. Zurich received 20cm, beating a record of 14cm set in 1939.
Meanwhile first October snow fell in London in 74 years as Arctic blast swept across UK. One man was killed and thousands were left without power today after inches of snow fell across the country overnight. Thousands of homes were without power in Bedfordshire, Hertfordshire and Buckinghamshire after two inches of snow damaged high voltage cables in temperatures of minus 4C. The icy conditions also brought chaos to the roads across the South, Midlands and East Anglia. And commuter trains ground to a halt when snow fell off overhanging branches onto the lines. While the wintry dusting soon vanished in Wednesday’s sunshine and showers, more snow was forecast for Wales last night. The last time snow settled on London in October, Britain was in the midst of an economic depression, the prime minister was losing his grip on power and Spurs were at the start of a season that would see them relegated from top flight football. While the capital woke to its first October blanketing since 1934, the rest of the South had its first pre-Halloween snowfalls since the 1970s. The unseasonal flurries, caused by a blast of air from the Arctic, were welcomed by millions of children in the middle of their half-term holidays.
Anchorage, Alaska also had A TOP TEN cold and snowy Ocotober. With an average temperature of 29.7 degrees, October landed a spot in history as one of the 10 coldest out of the roughly 90 years since records have been kept in Anchorage. The coldest October on record was in 1996, with an average temperature of 25.5 degrees. The 10th coldest was in 1965, with an average temperature of 30.7 degrees. And, though there’s little snow left on the ground to prove it, the month was also the 14th snowiest on record, the Weather Service said. Snowfall for the month was 13.1 inches, 5.1 inches above normal. In years past, Octobers have seen as little as no snow to as much as 28.1 inches in 1996, the Weather Service said. UPDATE from Mark Vogan in the UK after correspondence with a forecaster at the NWS Fairbanks, who told him Alaska is ready to end their 4th but potentially 3rd coldest October on record fir AK, at the same time Northern Ireland ends their October an amazing 7 to 8 degrees C BELOW NORMAL and yesterday (Wed) marked the COLDEST OCTOBER DAY in Northern Ireland since 1934!! Scotland saw it’s worst winter weather in October in 30 years and (Central) London saw it’s first October snow in some 70 years. He also reports on this story.
See many more cold and snow stories in the Round-Up compiled by Marc Morano.
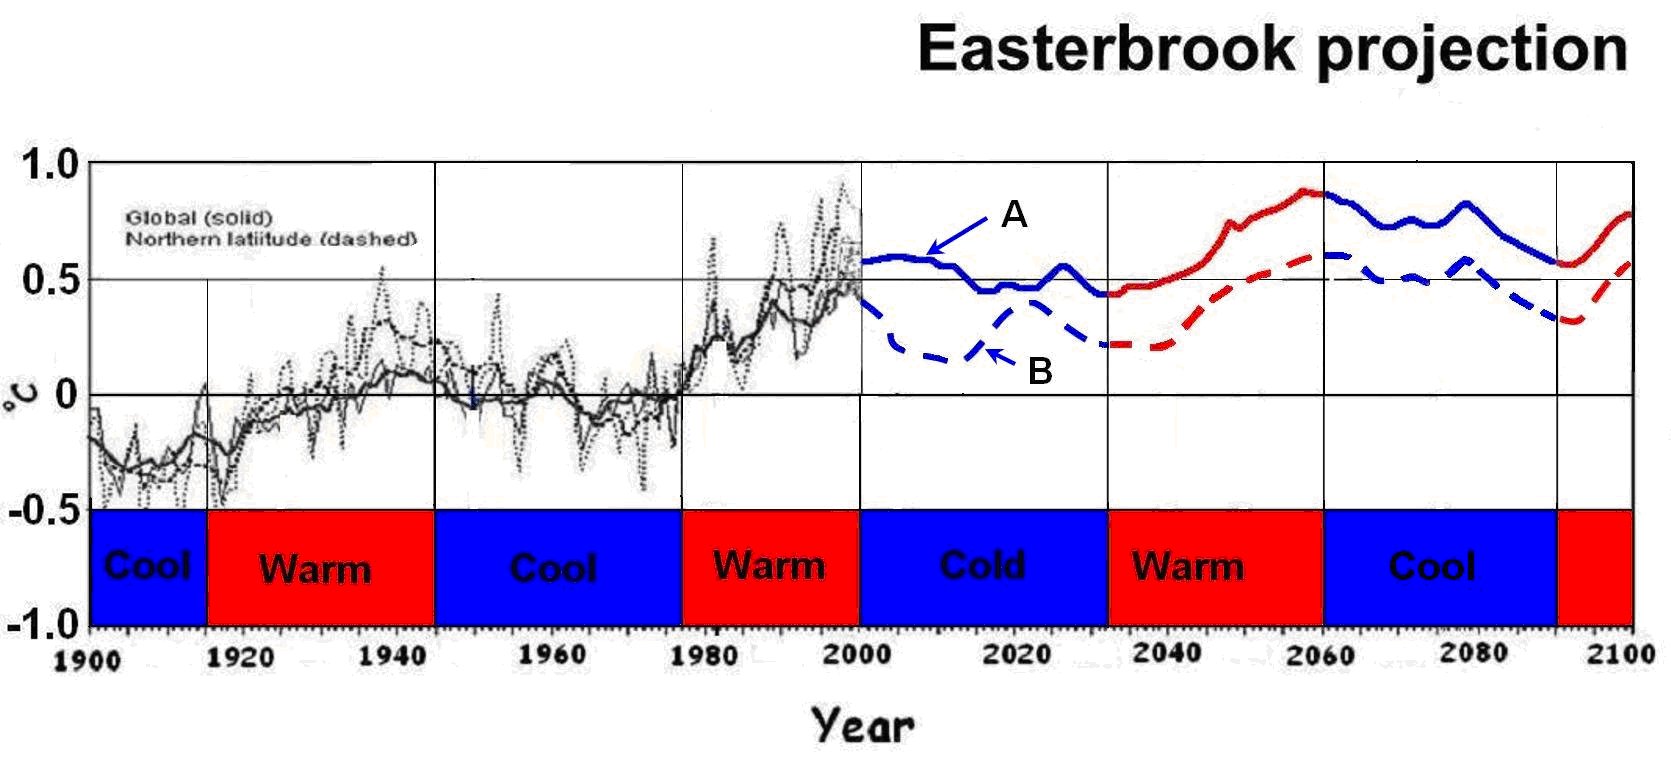
By Professor Don Easterbrook, Western Washington University
In 2007-2008, the Intergovernmental Panel on Climatic Change (IPCC) and computer modelers who believe that CO2 is the cause of global warming still predict the Earth is in store for catastrophic warming in this century. IPCC computer models have predicted global warming of 1F per decade and 5-6C (10-11F) by 2100, which would cause global catastrophe with ramifications for human life, natural habitat, energy and water resources, and food production. All of this is predicated on the assumption that global warming is caused by increasing atmospheric CO2 and that CO2 will continue to rise rapidly.
However, records of past climate changes suggest an altogether different scenario for the 21st century. Rather than drastic global warming at a rate of 0.5C (1F) per decade, historic records of past natural cycles suggest global cooling for the first several decades of the 21st century to about 2030, followed by global warming from about 2030 to about 2060, and renewed global cooling from 2060 to 2090 (Easterbrook, D.J., 2005, 2006a, b, 2007, 2008a, b); Easterbrook and Kovanen, 2000, 2001). Climatic fuctuations over the past several hundred years suggest ~30 year climatic cycles of global warming and cooling, on a general rising trend from the Little Ice Age.
See larger image here
Now a decade later, the global climate has not warmed 1F as forecast by the IPCC but has cooled slightly until 2007-08 when global temperatures turned sharply downward. In 2008, NASA satellite imagery confirmed that the Pacific Ocean had switched from the warm mode it had been in since 1977 to its cool mode, similar to that of the 1945-1977 global cooling period. The shift strongly suggests that the next several decades will be cooler, not warmer as predicted by the IPCC.
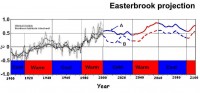
Global temperature projection for the coming century, based on warming/cooling cycles of the past several centuries. ‘A’ projection based on assuming next cool phase will be similar to the 1945-1977 cool phase. ‘B’ projection based on assuming next cool phase will be similar to the 1880-1915 cool phase. The predicted warm cycle from 2030 to 2060 is based on projection of the 1977 to 1998 warm phase and the cooling phase from 2060 to 2090 is based on projection of the 1945 to 1977 cool cycle. See larger image here
Global warming (i.e, the warming since 1977) is over. The minute increase of anthropogenic CO2 in the atmosphere (0.008%) was not the cause of the warming- it was a continuation of natural cycles that occurred over the past 500 years.
The PDO cool mode has replaced the warm mode in the Pacific Ocean, virtually assuring us of about 30 years of global cooling, perhaps much deeper than the global cooling from about 1945 to 1977. Just how much cooler the global climate will be during this cool cycle is uncertain. Recent solar changes suggest that it could be fairly severe, perhaps more like the 1880 to 1915 cool cycle than the more moderate 1945-1977 cool cycle. A more drastic cooling, similar to that during the Dalton and Maunder minimums, could plunge the Earth into another Little Ice Age, but only time will tell if that is likely. Read more here.
Scientific Alliance Newsletter - October 24th, 2008
Much has been made by others of the importance of environmental goals relative to financial ones, and economic analyses have been produced to justify this stance. But how much credence can we give to these? Assessing the worth of ecosystems is in itself a worthwhile goal; how else is expenditure on environmental projects to be prioritised against alternative uses of the money? The problem is always to establish a fair value.
Assumptions are everything. In the case of forests, a large part of this notional value relates to carbon sequestration: the capture of atmospheric carbon dioxide in the wood of the trees and the organic matter in the soil. Estimates of the carbon content of established forests, together with a projection for the value of carbon set by emissions trading systems gives a value per hectare. Multiply this by the number of hectares lost each year, and we have a value for this service provided by forests.
This economic analysis tells us that it is cost effective to pay up to the calculated value of the forest to prevent its destruction. But how valid is this? The implicit assumption in such calculations is that the cleared land then has no value, while the forest itself has a steady, ongoing value. However, taking the example of carbon sequestration alone, it is clear that such capture is not permanent, but part of a continuing cycle. As forests mature, they reach a state of equilibrium, with old trees dying and releasing their carbon into the atmosphere as they rot on the forest floor, and new trees taking their place, growing rapidly and themselves tying up atmospheric carbon.
However, if areas of forest are cleared, the timber continues to act a reservoir of carbon if it is used for construction: all the carbon is released only if the wood is burned. Most likely the cleared area is itself then used to grow crops, which will also sequester carbon. If the poor tropical soil is soon exhausted and the forest allowed to regenerate, rapidly growing trees are a greater annual carbon sink than mature trees.
But we also need to look at the broader picture: as tropical forests are to some extent shrinking, the area of temperate forests is increasing. Looking at the broader picture may give a different perspective. Although we are (rightly) concerned about the recent and current loss of tropical forest, in earlier times the area of temperate woodland declined dramatically as mankind increasingly turned to farming and the population grew. The point is that it is relatively easy to place a value on the loss of something such as woodland, but more difficult to value what might replace it. Certainly there is no indication that the loss of European forests, regrettable though that may be on one level, has had any detrimental effect on the lives of humans, and many plant and animal species have thrived, while others have declined. Read more here.
By Joseph D’Aleo, CCM, Fellow of the AMS
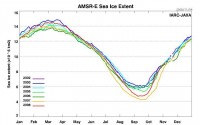
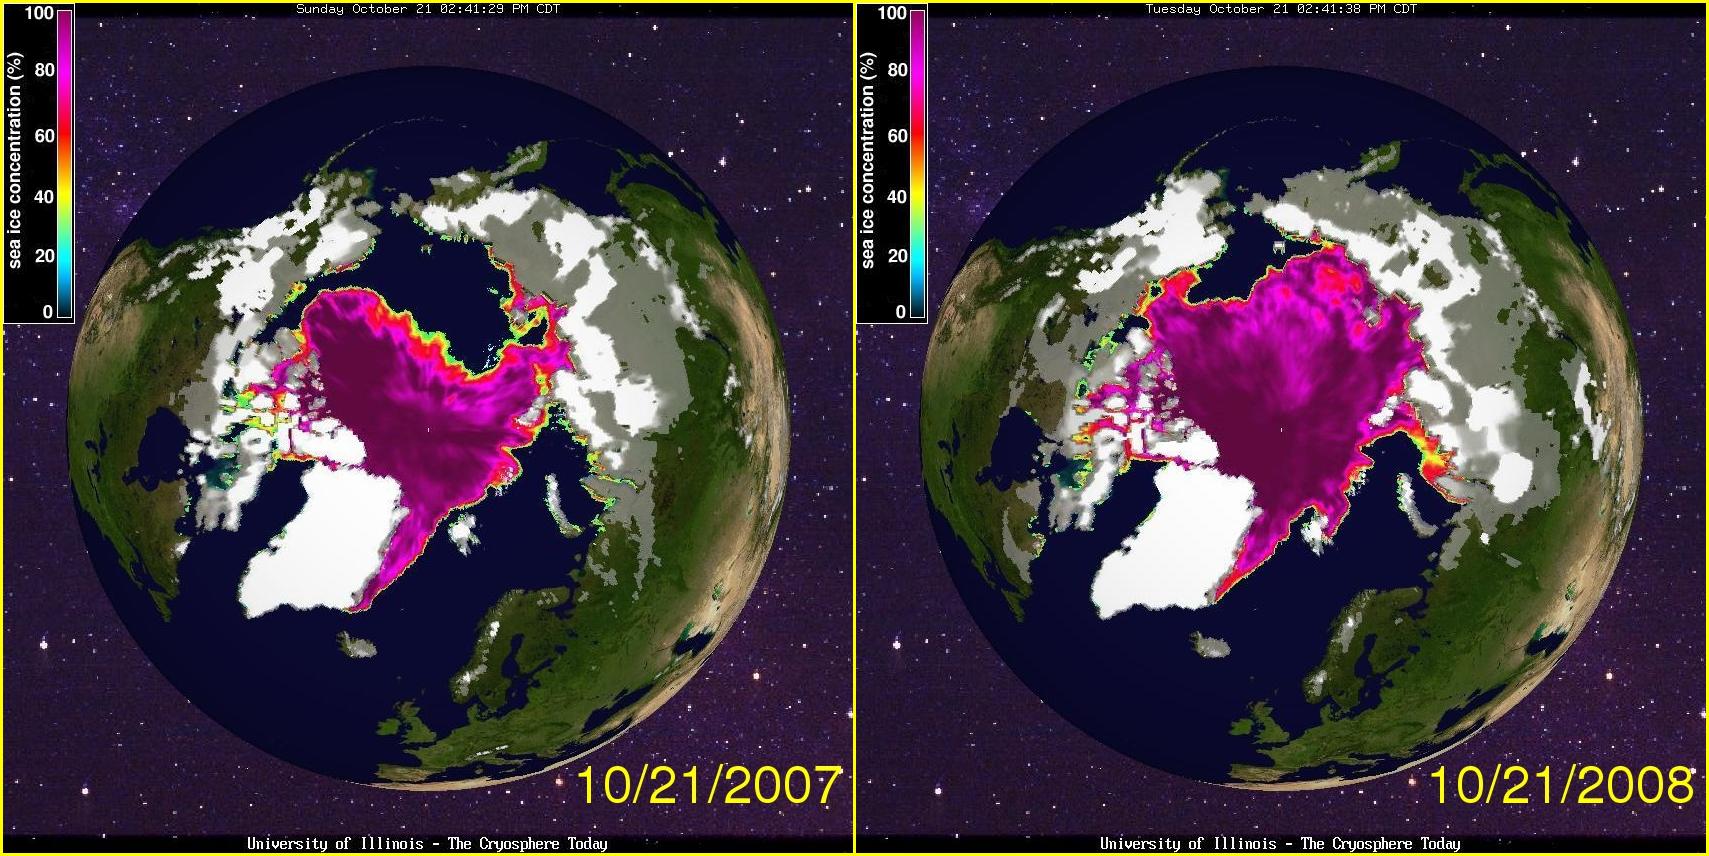
A very cold polar vortex with a strongly positive Arctic Oscillation is causing arctic ice to increase rapidly and the extent is well ahead of last year on this date.
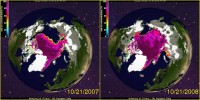
See full size image from Cryosphere today shows the side-by-side comparison here
Also see how in this image, the 2008 extent rapidly coming in line with other recent years and departing from 2007.
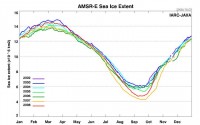
See full size image that shows extent by date for each of the last half dozen years
here
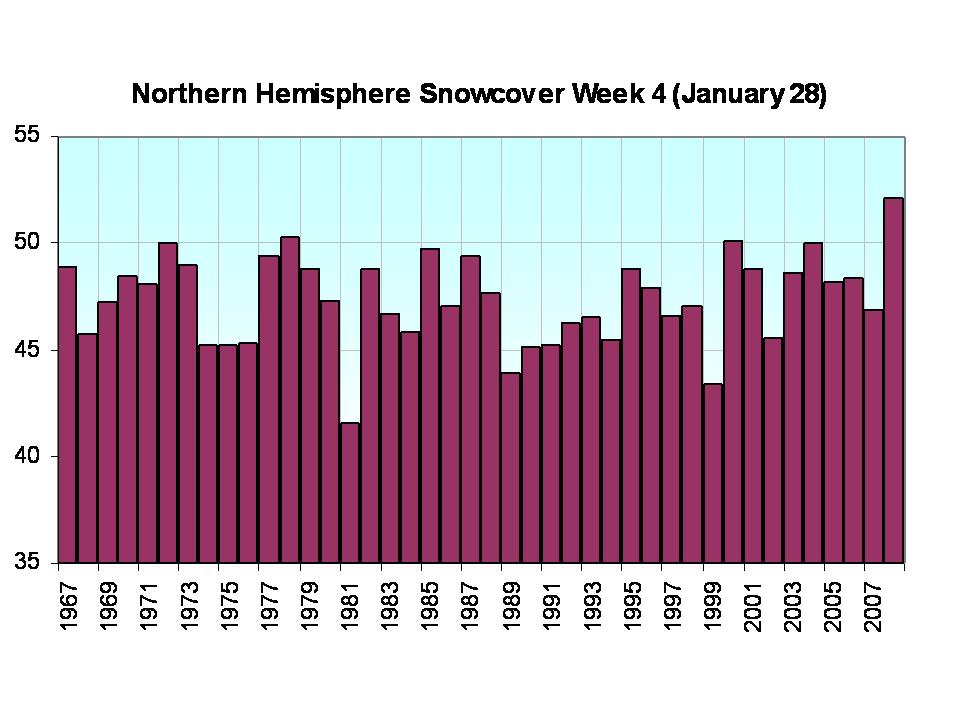
Snowcover is also rapidly increasing. recall last year even after the record low summer ice extent, by late January, the hemisphere was at an all-time record for extent of snow and ice.
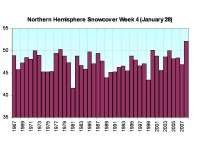
See full size image of last week of last January snow and ice extent here.
When the arctic oscillation flips negative, some of the very cold air will make an early appearance into middle latitudes in North America and Eurasia. Watch for an early snowstorm.
See also this story on Watts Up With That on showing the arctic had less ice 6,000-7,000 years ago. See this comprehensive listing of recent story Scientists Counter Latest Arctic Warmth as Psuedoscience.
By Joseph D’Aleo, on Intellicast.com
The PDO continues to be strongly negative and the ENSO measures are trending back towards La Nina. Should that surprise us? No, because most La Ninas have a tendency to persist more than one year and the negative PDO states favors more and stronger and longer lasting La Ninas.
See larger image here.
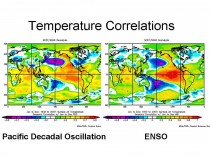
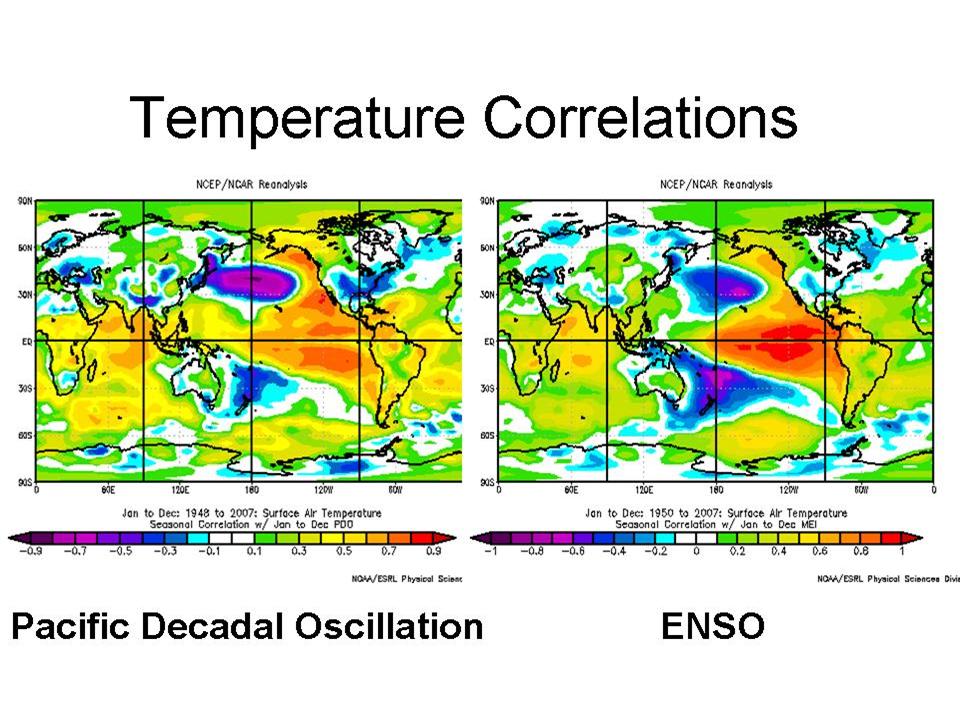
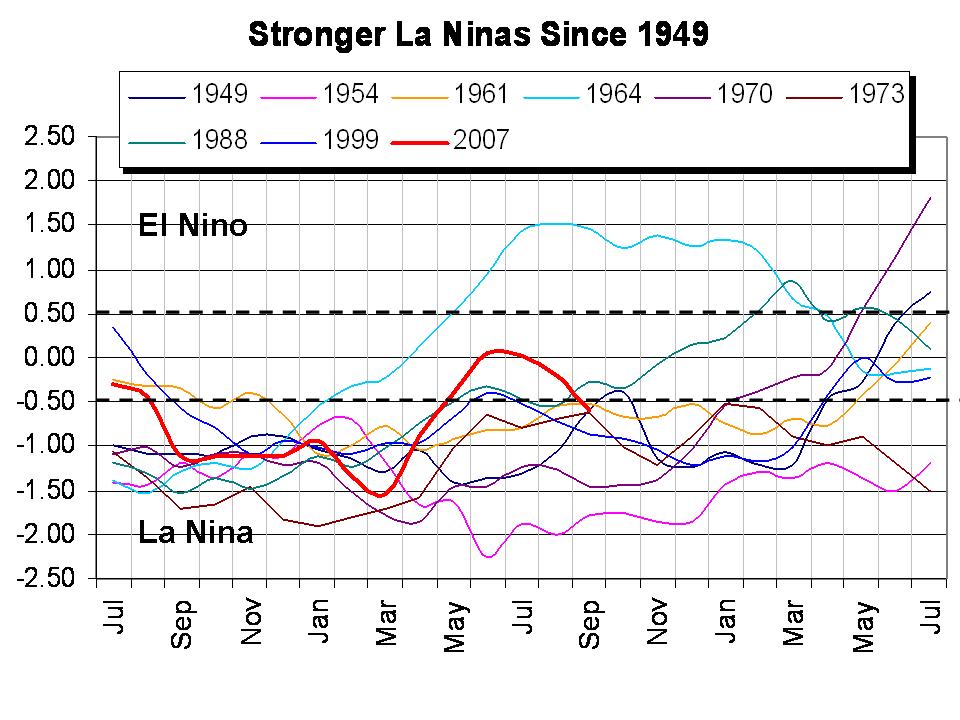
In a paper in 1997, Mantua et al found the “Pacific Decadal Oscillation” (PDO) is a long-lived El Nino-like pattern of Pacific climate variability. While the two climate oscillations have similar spatial climate fingerprints, they have very different behavior in time. Two main characteristics distinguish PDO from El Nino/Southern Oscillation (ENSO): first, 20th century PDO “events” persisted for 20-to-30 years, while typical ENSO events persisted for 6 to 18 months; second, the climatic fingerprints of the PDO are most visible in the North Pacific/North American sector, while secondary signatures exist in the tropics - the opposite is true for ENSO.
See larger image here.
A study by Gershunov and Barnett (1998) shows that the PDO has a modulating effect on the climate patterns resulting from ENSO. The climate signal of El Nino is likely to be stronger when the PDO is highly positive; conversely the climate signal of La Nina will be stronger when the PDO is highly negative. This does not mean that the PDO physically controls ENSO, but rather that the resulting climate patterns interact with each other. You can see the similarity of the El Nino to the positive PDO and La Nina to the negative PDO ocean temperature anomaly pool configurations above. Not surprisingly as the following shows, El Ninos as shown by the positive MEI spikes are more common during the warm phases (1977-1998) with La Nina (spikes down) more common in the cold phases as we found from 1947 to 1977 and after 1998.
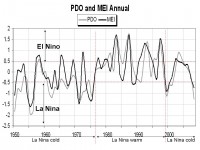
See larger image here.
The above shows how they follow in lock step with El Ninos and La Ninas augmenting the strength of the accompanying PDO state when they are synchronous and weakening it when they oppose each other. Since El Ninos lead to more global warmth than La Ninas, periods during which the PDO is positive and there are more and stronger El Ninos are not surprisingly periods of increasing global warmth (what we observed from 1979 to around 2000). Conversely cold PDO phases with more cool La Ninas lead to global cooling as we observed from the 1940s to 1970s and again after 1998.
See larger image here.
See larger image here.
See full story here.
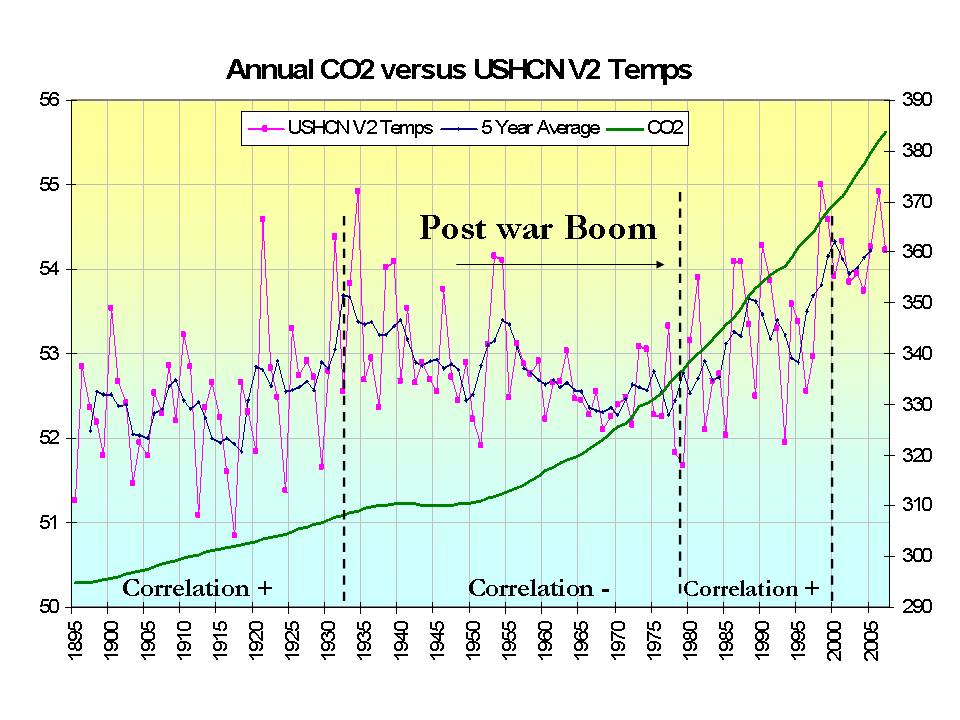
No Significant Global Warming Since 1995By Jarl Ahlbeck
The recovery of the earth’s climate from the little ice age started about 200 years ago, but the concentration of the atmospheric carbon dioxide started to increase significantly as late as in the 1950s, probably due to rapidly increased burning of fossil fuels.
The climate recovery is still an ongoing process today. A natural warming rate of roughly 0.5 deg C /100 years has been the baseline for more than 100 years, but both short (a few years) and long (20 years) fluctuations around the baseline have occurred for natural but highly speculative reasons, for example a rapid warming in the 1930s followed by a cooling period, and recently again warming until about 1998.
According to the UK climate panel IPCC, this last warming period has been forced by increased carbon dioxide concentration in the atmosphere. There is however no proof of that and the theory of how carbon dioxide influences the global mean temperature is complicated and unreliable. And if the global temperature again starts to increase slower than the natural long-term trend of 0.5 deg C/100 years, or even starts to cool, we can be quite certain that the recent faster warming trends have been natural too.
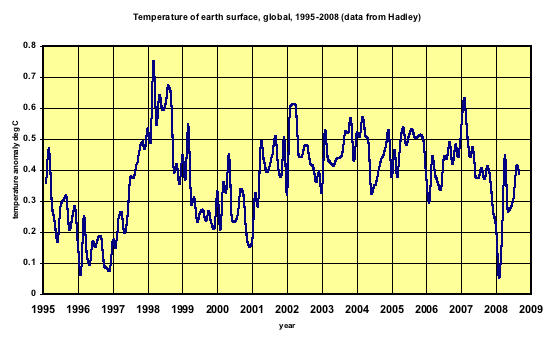
Hadley Center surface data. See larger image here
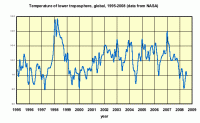
NASA Lower Tropospheric Temperatures since 1995. See larger image here
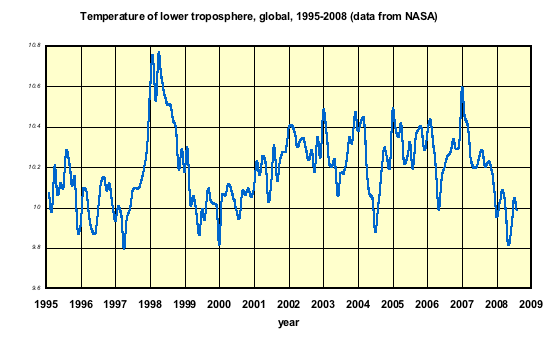
A good reason to start a diagram from 1995 is that since that year no big (cooling) volcano eruptions have disturbed the temperature trend. Contrary to common belief, there has been no or little global warming since 1995 and this is shown by two completely independent datasets.
The curves look very normal and it seems probable that the natural recovery from the little ice age has went on without any significant decelerations or accelerations caused by human activity. It is impossible to say what is going to happen in the future. But so far, real measurements give no ground for concern about a catastrophic future warming.
The author Jarl R. Ahlbeck is D.Sc. and lecturer at Abo Akademi University, Finland
Read more here.
By Art Horn, Meteorologist
Barack Obama has let it be known that he will allow the Environmental Protection Agency (EPA) to regulate carbon Dioxide as a dangerous pollutant if elected president. Last years supreme court ruling makes this possible. The court ruled that the EPA may use the Clear Air Act of 1990 to regulate carbon dioxide as “pollution”. This was of course a terrible ruling. Carbon dioxide is essential for life on earth as we know it. If carbon dioxide levels in the atmosphere fall below about 200 parts per million trees stop growing and agriculture grinds to a halt. Carbon dioxide is plant food. If you own a greenhouse and you want your plants to glow faster you pump in three times as much carbon dioxide as exists in the air, up to 1000 parts per million. Something in the air that brings life to the world is not pollution.
Now if Barack is elected and does what he says he will do some interesting things will happen. The EPA will require that every business, every farm, every piece of machinery that produces carbon dioxide will need a permit to do so. The “carbon tax” will supposedly then be used to somehow reduce the effects of all that “pollution” going into the air and fueling “global warming”. In reality we know that government is a bottomless money pit. This revenue will go wherever the environmentalist controlling the new administrations “green” policies want it to go. That could be anywhere as we have seen with Fannie Mae.
If the environmentalists controlling the policies of Barack Obama have their way we could see some really amazing taxes in the future. Since everything producing carbon dioxide must be regulated than it makes sense that you must be as well. As a human you are producing carbon dioxide by breathing. So in this Orwellian future we will be required at birth to have a “breathing permit” as soon as we enter the world. And it won’t stop there. As you get older and your lung capacity grows you will be emitting more carbon dioxide and therefore your tax will have to increase proportionally as you grow older. Let us not forget the other “polluters” like your dog and cat, they are also guilty of polluting so we’ll need to have you pay for their permits as well. If you have a gas powered lawn mower you better be ready to let that grass grow taller, your permit will only allow so many cuts a year. Don’t even think about grilling food, that fine tradition will spill untold amounts of global warming fuel into the air, you’ll need a permit to cook up that steak in Barack’s American future. Taking the boat out for spin? Don’t forget that the coast guard will be checking for your carbon permit. It almost goes without saying that all cars, trucks any vehicle that spews carbon dioxide into the air will need a permit. Will the EPA be able to process all these applications? Of course not, they will need much more staff.
What is the other greenhouse gas that living things like people and pets produce? Methane of course. At some point the EPA will see that it is necessary to regulate this gas as a “dangerous pollutant” as well. In reality this will result in a fart tax. I’m not kidding. Anything and anyone that produces “gas” will have to get a permit from the EPA to do so. Kind of puts a new spin on “gas tax”. If people only knew what they were really voting for.
By The Viscount Monckton of Brenchley in the American Thinker
Dear Senator McCain, Sir,
You chose a visit to a wind-farm in early summer 2008 to devote an entire campaign speech to the reassertion of your belief in the apocalyptic vision of catastrophic anthropogenic climate change - a lurid and fanciful account of imagined future events that was always baseless, was briefly exciting among the less thoughtful species of news commentators and politicians, but is now scientifically discredited.
With every respect, there is no rational basis for your declared intention that your great nation should inflict upon her own working people and upon the starving masses of the Third World the extravagantly-pointless, climatically-irrelevant, strategically-fatal economic wounds that the arrogant advocates of atmospheric alarmism admit they aim to achieve.
You have said: “We have many advantages in the fight against global warming, but time is not one of them.”
Here, Sir, are the facts about “rising temperatures”. The facts which I shall give you in this letter are taken not from my own imagination, nor from the obscurantist reports of the UN’s climate panel, nor from any lobby group, but from the peer-reviewed scientific literature. Very nearly all of the citations that support the crucial facts which your advisers seem not to have put before you, and which I shall set forth in this letter, are from peer-reviewed papers. Some, however, such as the documents of the UN’s climate panel, the IPCC, are not peer-reviewed in the accepted sense of the term. Peer-reviewed papers will be indicated by citations with the date in parentheses, thus: Boffin et al. (2008). Papers that are not peer-reviewed will be indicated by square brackets, thus: IPCC [2007].
From 1700-1998, temperature rose at a near-uniform rate of about 1F per century [Akasofu, 2008]. In 1998, “global warming” stopped, and it has not resumed since: indeed, in the past seven years, temperature has been falling at a rate equivalent to as much as 0.7F per decade [Hadley Center for Forecasting, 2008; US National Climatic Data Center, 2008]. Very few news media have given any prominence to this long and pronounced downturn in the temperature trend.
It is now thought possible that no new global annual temperature record will be set until at least 2015 (Keenlyside et al., 2008). Yet the projection of the UN’s climate panel had been that temperature would rise by about 1F during the 17 years to 2015. Is it not strange that the “global warming” scare has been rising in the media headlines and in the rhetoric of the classe politique throughout the past seven years, even though global temperature has been falling throughout that period?
Finally, now that you have the facts about temperature before you, it will be evident to you that you were not correct in having said that a new temperature record seems to be set every few years. Despite rapidly-rising carbon dioxide concentrations, there has been no new record year for global temperature in the ten years since 1998; and, in the United States, there has been no new record year for national temperature since 1934 - a record set almost three-quarters of a century ago, and well before humankind could have had any significant influence on temperature. See the full letter detailing the temperature, carbon dioxide and consensus misconceptions held by McCain and many politicians of both parties here.