


An MIT professor of meteorology is dismissing global-warming alarmists as a discredited “cult” whose members are becoming more hysterical as emerging evidence continues to contradict their beliefs.
During an appearance on this writer’s radio show Monday, MIT Professor emeritus Richard Lindzen discussed the religious nature of the movement.
“As with any cult, once the mythology of the cult begins falling apart, instead of saying, oh, we were wrong, they get more and more fanatical. I think that’s what’s happening here. Think about it,” he said. “You’ve led an unpleasant life, you haven’t led a very virtuous life, but now you’re told, you get absolution if you watch your carbon footprint. It’s salvation!”
Lindzen, 74, has issued calm dismissals of warmist apocalypse, reducing his critics to sputtering rage.
Last week, government agencies including NASA announced that 2014 was the “hottest year” in “recorded history,” as The New York Times put it in an early edition. Last year has since been demoted by the Times to the hottest “since record-keeping began in 1880.”
But that may not be true. Now the same agencies have acknowledged that there’s only a 38 percent chance that 2014 was the hottest year on record. And even if it was, it was only by two-100ths of a degree.
Lindzen scoffs at the public-sector-generated hysteria, which included one warmist blogger breathlessly writing that the heat record had been “shattered.”
“Seventy percent of the earth is oceans, we can’t measure those temperatures very well. They can be off a half a degree, a quarter of a degree. Even two-10ths of a degree of change would be tiny but two-100ths is ludicrous. Anyone who starts crowing about those numbers shows that they’re putting spin on nothing.”
Last week, after scoffing at Vermont socialist Sen. Bernie Sanders’ call for a Senate vote on global warming, Lindzen was subjected to another barrage of diatribes. At his listed MIT phone number, Prof. Lindzen received a typical anonymous call:
“I think people like you should actually be in jail,” the male caller told him, “because you must know where this is all leading not the people you support and take your money from to make these outrageously anti-human comments (also ‘know’![]() … In other words, you’re a sociopath!”
… In other words, you’re a sociopath!”
Lindzen chuckled when the voicemail was replayed.
This writer asked him if, as has been alleged in some of the warmist blogs, he is taking money from the energy industry.
“Oh, it would be great!” he said with a laugh. “You have all these people, the Gores and so on, making hundreds of millions of dollars on this, Exxon Mobil giving $100 million to Stanford for people who are working on promoting this hysteria. The notion that the fossil-fuel industry cares - they don’t. As long as they can pass the costs on to you, it’s a new profit center.”
Lindzen said he was fortunate to have gained tenure just as the “climate change” movement was beginning, because now non-believers are often ostracized in academia. In his career he has watched the hysteria of the 1970’s over “global cooling” morph into “global warming.”
“They use climate to push an agenda. But what do you have left when global warming falls apart? Global normalcy? We have to do something about ‘normalcy?’”
As for CO2, Lindzen said that until recently, periods of greater warmth were referred to as “climate optimum.” Optimum is derived from a Latin word meaning “best.”
“Nobody ever questioned that those were the good periods. All of a sudden you were able to inculcate people with the notion that you have to be afraid of warmth.”
The warmists’ ultimate solution is to reduce the standard of living for most of mankind. That proposition is being resisted most vigorously by nations with developing economies such as China and India, both of which have refused to sign on to any restrictive, Obama-backed climate treaties. Lindzen understands their reluctance.
“Anything you do to impoverish people, and certainly all the planned policies will impoverish people, is actually costing lives. But the environmental movement has never cared about that.”
---------
EPA Plan to Ban Coal Hits Major Roadblock
By Phil Kerpen
The EPA proposal to impose a de facto ban on new coal-fired power plants received more than two million comments from the public - but it looks like it was just one five-page comment from the Energy and Environment Legal Institute (E&E Legal) that sent EPA scrambling back to the drawing board.
The draft rule mandated the use of so-called carbon capture and storage, a technology that would inject carbon dioxide underground but which has so far proved to be little more than a white elephant experiment. To mandate this technology, the law required the EPA to prove it was “adequately demonstrated” and “commercially available.” Thanks to E&E Legal, they failed.
Dawn Reeves at Inside EPA broke the story that carbon capture and storage has apparently been dropped from the agency’s final rule regulating greenhouse gas emissions. She also, curiously, reports that the White House may not allow the EPA to back down, instead forcing the agency to defend the legally indefensible in court.
But whether they win now or not until the issue is litigated, E&E Legal has scored a huge victory for the rule of law and economic common sense.
I reached out to Chris Horner, their lead author on the comment that carried the day.
“We submitted comments for the record explaining that EPA had made a mockery of the interagency review process, ignoring the government’s own experts in order to push an ideological agenda,” Horner said.
That’s a crucial point because if the EPA is demonstrably not serving as an expert but an ideological actor, it would not warrant deference in court, making its whole global warming agenda vulnerable.
E&E Legal obtained information proving that expert analysis from the Department of Energy actually concluded the opposite of what the EPA claimed when they asserted that carbon capture and storage had been “adequately demonstrated.”
“The truth is that the experts had persuasively argued the opposite, in effect, that carbon capture and storage has been demonstrated to be not viable,” Horner said. “Making this more egregious, the Department of Energy had paid a quarter of a billion taxpayer dollars to learn this information and lesson that EPA ignored and even misrepresented.”
The EPA was caught red-handed faking science and ignoring expert opinion, in effect requiring a technology that they knew did not practically exist. It is therefore reasonable to conclude that their actual intended purpose was indeed to impose a de facto ban on coal-fired power plants. And they might have gotten away with it if E&E Legal hadn’t busted them.
----------
States Rebel Against EPA’s Clean Power Plan
State Officials have gone on the offensive against the Environmental Protection Agency’s Clean Power Plan (CPP) limiting carbon-dioxide emissions at existing fossil-fuel-fired power plants.
The CPP would establish state-by-state carbon emissions rate reduction targets.
Gov. Mary Fallin, R-Okla., in late April issued an executive order arguing that the EPA “has exceeded its authority under the Clean Air Act,” the 1970 federal law requiring the EPA to take steps to reduce air pollution that harms the public’s health, from which the EPA claims authority for the CPP.
Fallin also prohibits the state’s Department of Environmental Quality from participating with the development of plans to implement CPP regulations.
And she said that if the CPP is adopted this summer, she “will not submit” a State Implementation Plan (SIP) intended to ensure full compliance with the federal mandate, Thomas K. Lindsay disclosed in an article for realclearpolicy.com.
Nine days after Fallin issued the executive order, Texas’ Republican Gov. Greg Abbott met with Senate Majority Leader Mitch McConnell and Texas Sens. John Cornyn and Ted Cruz to discuss what Abbott predicted would be “grave consequences for the State of Texas” if the CPP is enforced.
Abbott’s press advisory said the CPP “will certainly result in higher energy prices for Texans, killing jobs and stagnating Texas’ unprecedented economic growth.”
The Texas House of Representatives is considering a bill that would require the state, like Oklahoma, to deny the EPA’s request that it submit a SIP for the federal mandate.
Texas and Oklahoma are not alone, observes Lindsay, director of the Centers for Tenth Amendment Action and Higher Education at the Texas Public Policy Foundation. He cited one survey disclosing that there are now 32 states “in which elected officials have expressed firm opposition” to the CPP.
Several U.S. senators have proposed legislation to combat the CPP. Sen. Shelley Moore Capito, R-W.Va., head of the Senate Environmental and Public Works Committee’s Clean Air and Nuclear Safety Subcommittee, and six other senators introduced the Affordable Reliable Energy Now Act (ARENA).
The bill would extend the CPP’s compliance deadlines pending review by federal courts, and bar any state from being forced to implement a SIP or a Federal Implementation Plan if the state’s governor concludes that doing so would harm the state’s economy.
ARENA would also prohibit the EPA from withholding federal highway funds from states that are found to not be in compliance with the CPP.
FOOTNOTE: According to The Atlantic, the EPA itself admits that the CPP’s effect against the threat of climate change will be so small, reducing warming by 0.016 degrees Fahrenheit over the next century, that it will be impossible to measure.
See how EPA’s 3,373 regulations are 6,552 times as long as the Constitution; 46 times ss long as the bible here.
See these two stories in the Patriot Post:
Satellite Data Defies NOAA and NASA Claims
See more on the Coldest February and January to March in the entire record back to 1895 in the Northeast (10 states and DC) here.
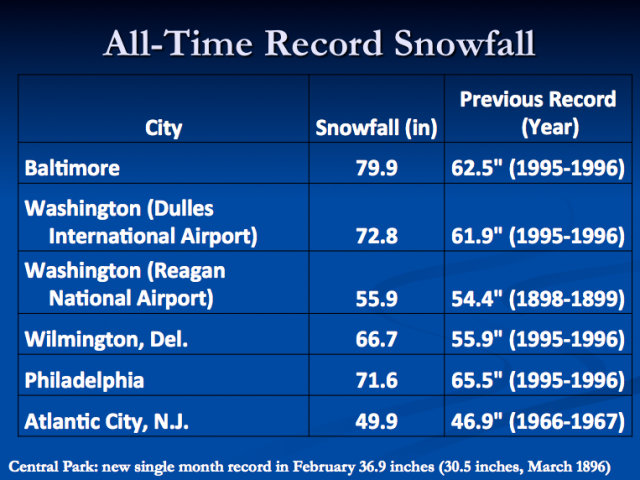
It was also the snowiest February in parts of the northeast.
--------------
Guest Post by Bob Tisdale
Dr. Roy Spencer introduced the updated and much corrected UAH atmospheric temperature data in his blog post Version 6.0 of the UAH Temperature Dataset Released: New LT Trend = +0.11 C/decade. The new temperature anomaly data for the lower troposphere, mid troposphere and lower stratosphere are presently in beta form for comment. That is, they’re not official...yet. I suspect the update will not go over well with the catastrophic-anthropogenic-global-warming crowd. Links to the version 6.0 beta data are at the bottom of Roy’s post, which also contains a detailed discussion of the updates. So if you have questions, please ask them at Roy Spencer’s blog through the above link. This post is a simple data presentation.
The version 6.0 beta temperature anomaly data for the lower troposphere used in this post are here.
In this post, we’ll take a quick look at the new UAH version 6.0 beta lower troposphere temperature anomaly data, comparing it to: (1) the current UAH version 5.6 data and (2) the RSS lower troposphere temperature data.
But first…
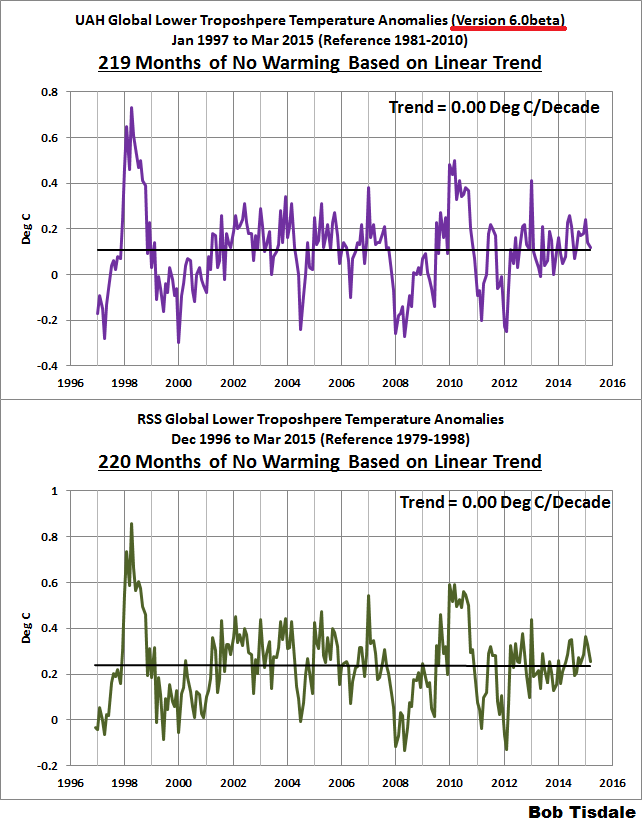
BASED ON LINEAR TRENDS, THE NEW UAH LOWER TROPOSPHERE TEMPERATURE DATA SHOW NO WARMING FOR 18+ YEARS, LIKE RSS
For Figure 1, I’ve extended the new UAH version 6.0 beta and the RSS lower troposphere temperature anomaly data as far back in time as they could go while showing no warming based on their linear trends. The new UAH data show no warming for 219 months, and for the RSS data, it’s 220 months.

Figure 1 Enlarged
A QUICK OVERVIEW OF LOWER TROPOSPHERE TEMPERATURE DATA
The following is a reprint of the initial discussion of lower troposphere temperature data from the monthly updates. The most recent update is here.
Special sensors (microwave sounding units) aboard satellites have orbited the Earth since the late 1970s, allowing scientists to calculate the temperatures of the atmosphere at various heights above sea level. The level nearest to the surface of the Earth is the lower troposphere. The lower troposphere temperature data include the altitudes of zero to about 12,500 meters, but are most heavily weighted to the altitudes of less than 3000 meters.
See the left-hand cell of the illustration here. The lower troposphere temperature data are calculated from a series of satellites with overlapping operation periods, not from a single satellite. The monthly UAH lower troposphere temperature data is the product of the Earth System Science Center of the University of Alabama in Huntsville (UAH). UAH provides the data broken down into numerous subsets. See the webpage here [version 5.6 data]. The UAH lower troposphere temperature data are supported by Christy et al. (2000) MSU Tropospheric Temperatures: Dataset Construction and Radiosonde Comparisons. Additionally, Dr. Roy Spencer of UAH presents at his blog the monthly UAH TLT data updates a few days before the release at the UAH website. UAH uses the base years of 1981-2010 for anomalies. The UAH lower troposphere temperature data are for the latitudes of 85S to 85N, which represent more than 99% of the surface of the globe.
UAH VERSION 5.6 VERSUS UAH VERSION 6.0 BETA
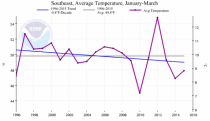
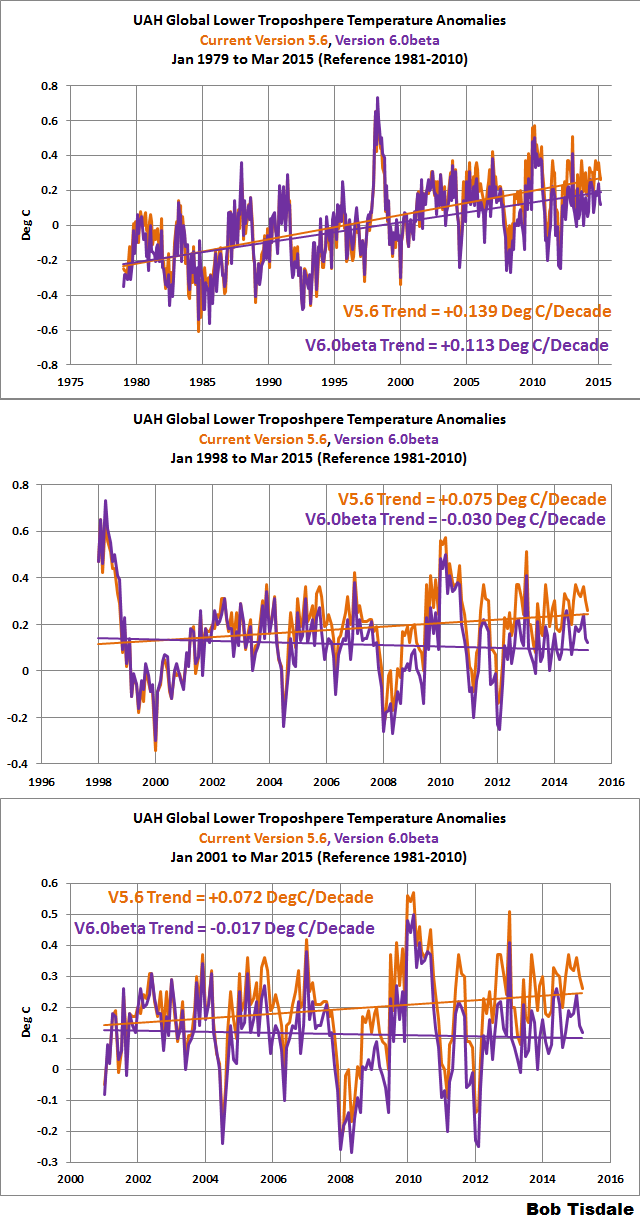
Figure 2 compares the current version 5.6 UAH lower troposphere temperature anomaly data to the recently released version 6.0 beta. The comparisons start in the Januarys of 1979, 1998 and 2001 and run through March 2015. The first full year of the UAH lower troposphere temperature data is 1979, while 1998 and 2001 are commonly used as start years during discussions of the recent slowdown in global surface and global lower troposphere temperatures. They are the same time periods we present in the monthly surface and lower troposphere temperature anomaly updates. See the most recent update here.

Figure 2 Enlarged
Since 1979, the new version (v6.0 beta) of the UAH lower troposphere temperature data show a noticeably lower warming rate than current version 5.6 data. For the periods starting in 1998 and 2001, the new beta version data show cooling of the lower troposphere based on the linear trends, while the current 5.6 version data show warming.
RSS VERSUS UAH VERSION 6.0 BETA
The warming rate since 1979 for the new UAH data is slightly less than (basically the same as) the lower troposphere temperature anomaly data from RSS. The shorter term cooling rates since 1998 and 2001 are also comparable. See the graphs in Figure 3.
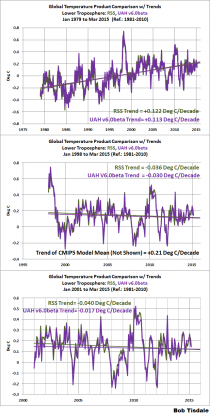
Figure 3 Enlarged
CLOSING
The RSS lower troposphere temperature data used to be an outlier, showing much lower trends than the surface temperature data and the UAH lower troposphere data. That will no longer be the case with the new UAH version 6.0 data.
SOURCES
The UAH version 6.0 beta lower troposphere temperature anomaly data are here.
The UAH version 5.6 lower troposphere temperature anomaly data are here.
The RSS lower troposphere temperature anomaly data are here.
By Joseph D’Aleo, CCM
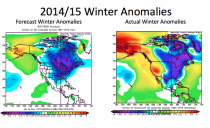
The eastern Pacific has driven the climate bus the last two years. The warm water moved into the Gulf of Alaska in 2013 and the Alaska ridge pumped down arctic and at times Siberian air down to the Great Lakes and east. A constant stream of clipper storms brought snow almost every other day to the lakes.
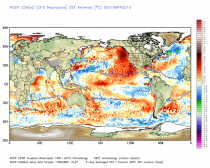
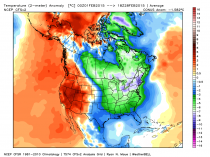
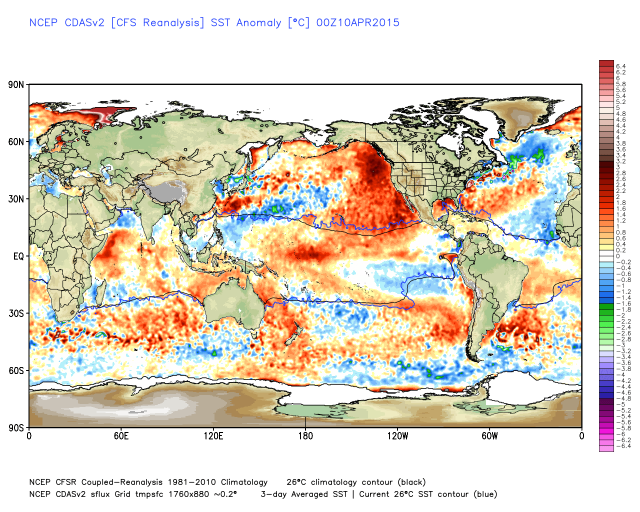
In 2014 the warm water was carried south along the west coast and aided by diminished upwelling with a displaced/weakened Pacific high, helped as it did in the mid 1970s, produce the California drought. See the sea surface temperature anomalies this winter.
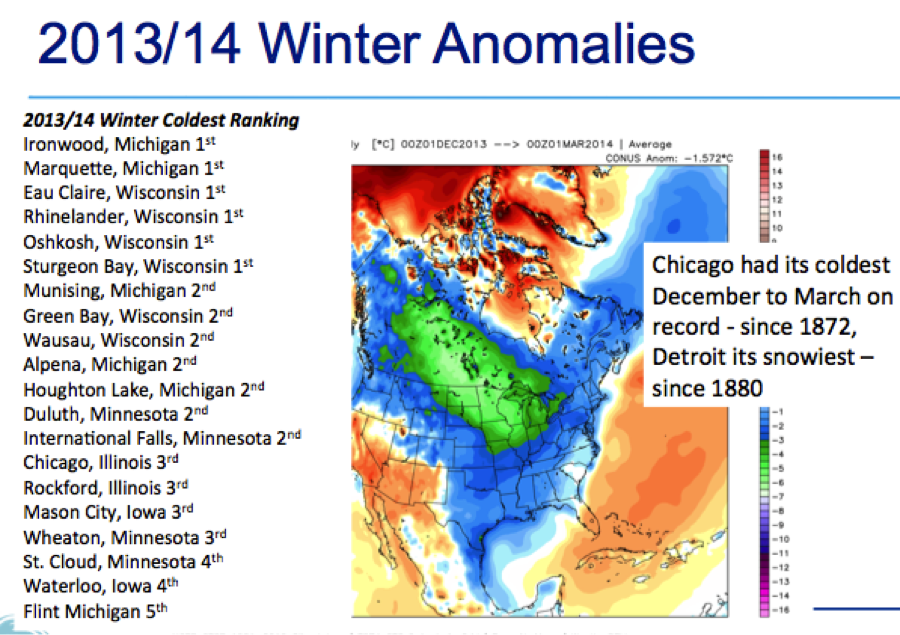
Though the media wants to focus on the western warmth and drought, the bigger story has been the cold and snow to the east the last two winters.
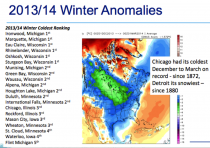
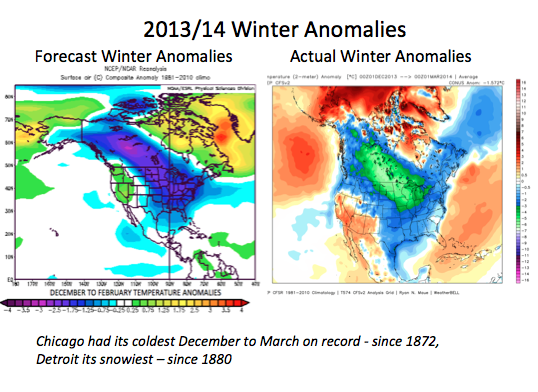
Chicago had its coldest December to March in the record back to 1872 and third snowiest winter in 2013/14, Detroit had its snowiest winter since 1880.
See the brutal 2013/14 winter that focused on the Great lakes and Upper Midwest.
_thumb.png)
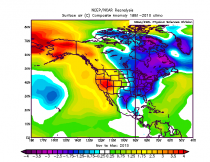
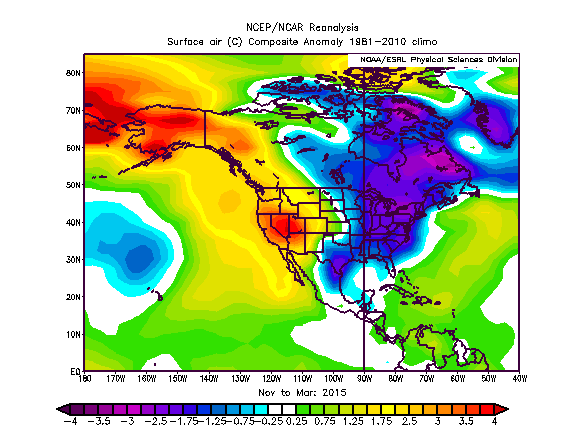
This winter, the trough and the axis of coldest air was in the mean farther east, the expansion east made easier by a cooling North Atlantic. The cold shifted to the northeast and all of the cities in eastern Canada, which had their coldest February and January to March and in many places in the east, the snowiest ever on record (similar to what we saw and earlier wrote about in parts of central New England).
We wrote about the remarkable February 2015 in March.
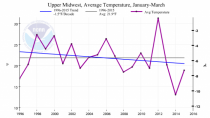
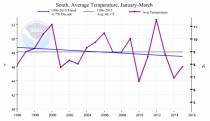
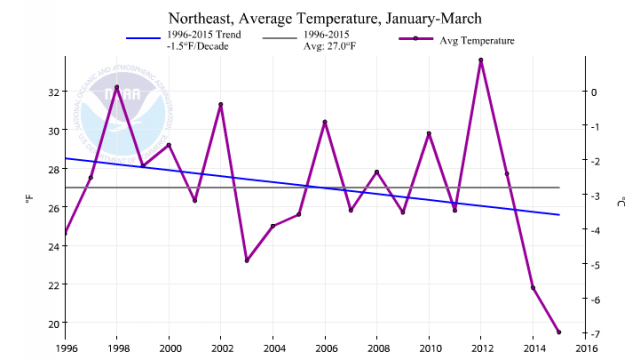
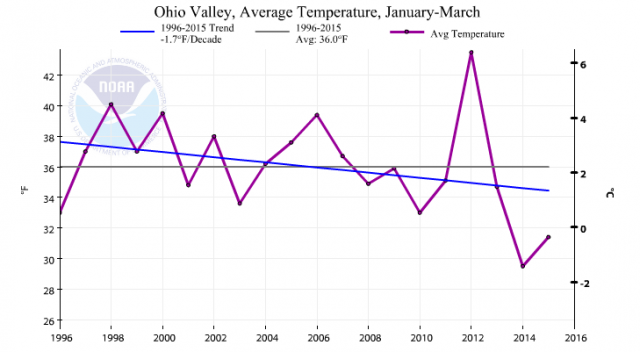
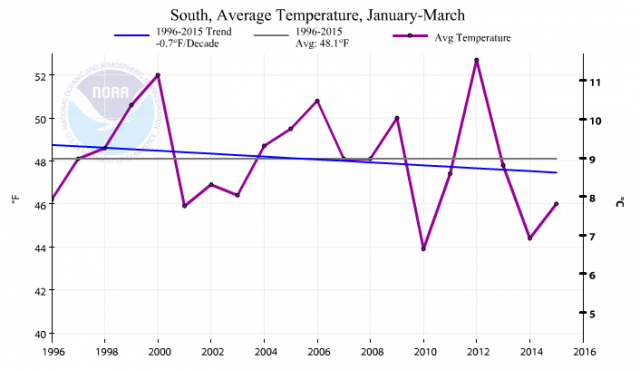
This week, NCDC updated their Climate pages to include March 2015 and looked at the brutal eastern January to March story for the Northeast, and the cold in the Upper Midwest, Ohio Valley, South and Southeast.
In the northeast region (the 10 eastern states with all the major metros and DC) had their coldest January to March in the record back to 1895.
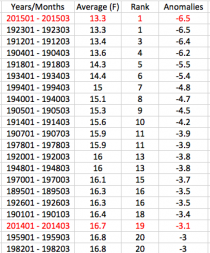
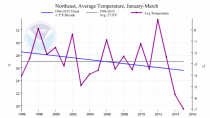
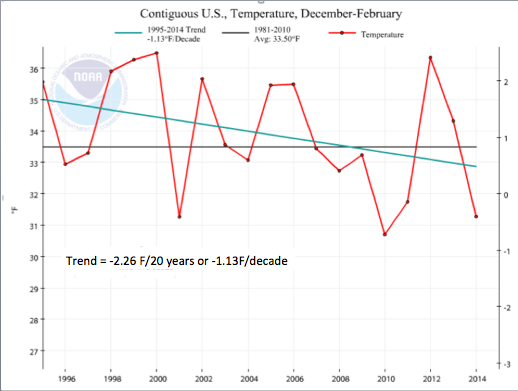
The trend the last 20 years has been down 1.5F/decade!
It has cooled in the last 20 years in the Ohio Valley, Great Lakes/Upper Midwest, South and Southeast.

Western, Northwest and Southwest plots, which had two decade cooling trends though 2012 have flattened with the warmer winters the last two years.
The last two winters have been throwback winters for the Great Lakes and northeast.
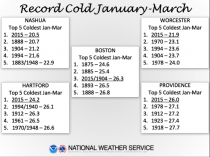
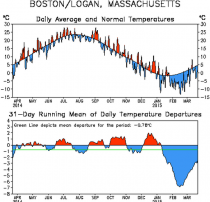
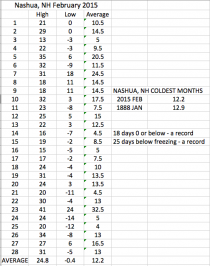
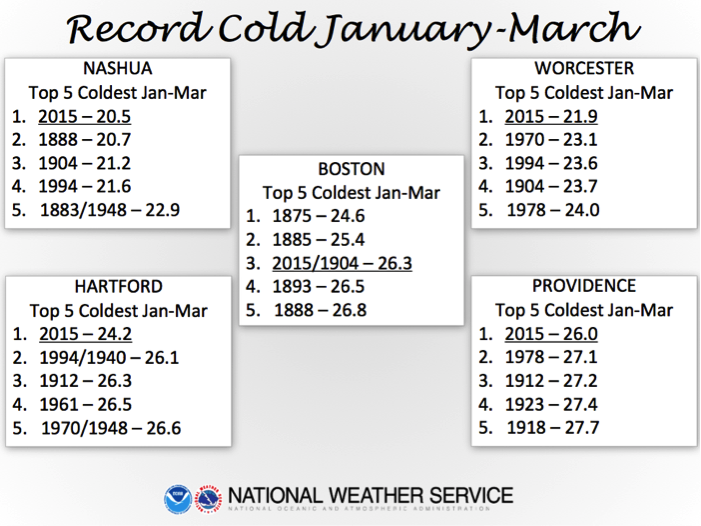
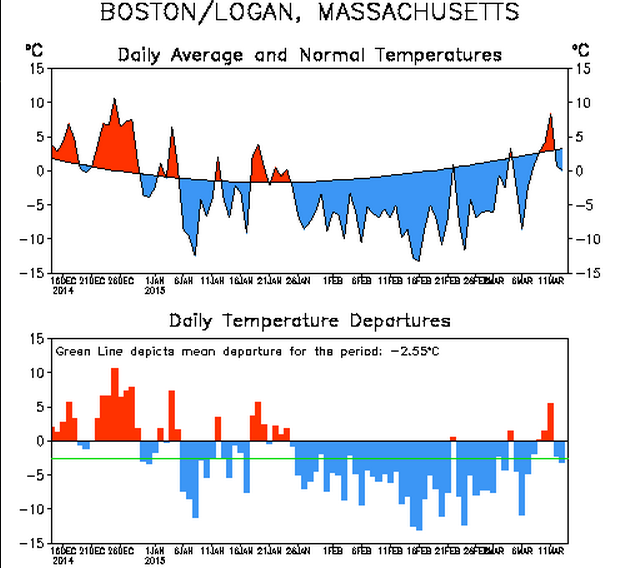
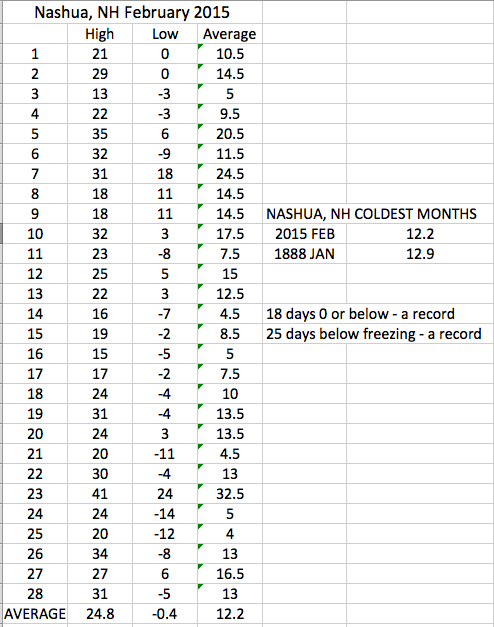
No one who has lived in central New England including the Boston area has experienced a 6-week and calendar month as extreme for the combination of cold and snow as we have this late winter. Here in the Nashua area, February 2015 was the coldest month ever recorded with an average temperature of 12.2F. It beat out January 1888, which had averaged 12.9F. A record 18 days had low temperatures zero or below (as cold as 14F below). 25 days remained freezing or below, also a record.
In Boston where temperature records began in 1872, this month was exceeded only by February 1934, which brought Boston their all-time record of -18F. Temperatures never rose out of the 30s this year in February in Boston though it topped 40 four times in 1934.
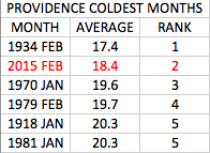
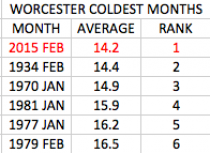
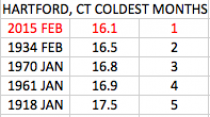
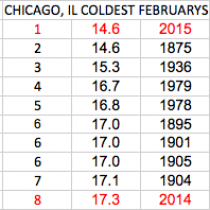
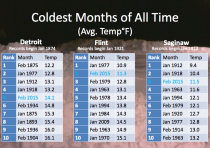
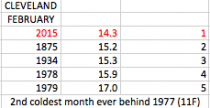
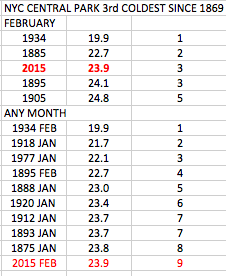
The cold in February 2015 was not confined to the Boston-Nashua area. It was the coldest month ever in Worcester, Hartford and Portland. It was the coldest February in Chicago and Cleveland and 3rd coldest in New York City, 5th coldest month ever in Detroit and Baltimore, both with records back into the early 1870s.
The year Nashua replaced, 1888, was the year was the year of the Blizzard of ‘88 in March. That storm called ‘The Great White Hurricane’ dumped as much as 50 inches of snow in parts of Connecticut and Massachusetts, while parts of New Jersey and New York had up to 40 inches. Drifts were reported to average 30-40 feet, over the tops of houses from New York to New England, with reports of drifts covering three-story houses. That storm spared eastern New England its worst as milder Atlantic air dominated the early stages of that storm with less than 2 feet here in the Nashua area and just 12” in Boston although 42” fell in southwest New Hampshire at Dublin.
2015 in Nashua had a record February for snowfall, though Boston had more with 64.6 inches and 100.4 inches in the 39 days following January 24th. The 110.6 inches exceeded the 107.6 inch record from 1995/96. The snow that year was spread out over 6 months with thaws, not concentrated so much in less than 6 weeks. The snow blitz and the intense cold is why the snow piles were so high this year.
ONLY 1717 BEAT THIS?
Looking back through accounts of big snows in New England by the late weather historian David Ludlum, it appears for the eastern areas, this winters snowblitz may have delivered the most snow since perhaps 1717.
That year, snows had reached 5 feet in December with drifts of 25 feet in January before one great last assault in late February into early March of 40 to 60 more inches. The snow was so deep that people could only leave their houses from the second floor, implying actual snow depths of as much as 8 feet or more. The New England Historical Society’s account indicated New Hampshire, Massachusetts and Connecticut were hardest hit, a lot like 2015 in what was known as the year of the great snows.
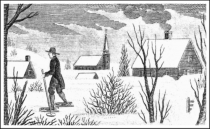
“Entire houses were covered over, identifiable only by a thin curl of smoke coming out of a hole in the snow. In Hampton, N.H., search parties went out after the storms hunting for elderly people at risk of freezing to death… Sometimes they were found burning their furniture because they couldn’t get to the woodshed. People maintained tunnels and paths through the snow from house to house.”
The driver for this winter was a peculiar configuration of ocean warm and cold pools, similar to the frigid winters of 1916/17, 1917/18, 1976/77 and 1977/78. We correctly forecasted the last two historic winters many months in advance based on the ocean patterns. The models suggest the ocean temperatures remain in this configuration this spring and summer resulting in a cool spring and relatively cool and wet summer.
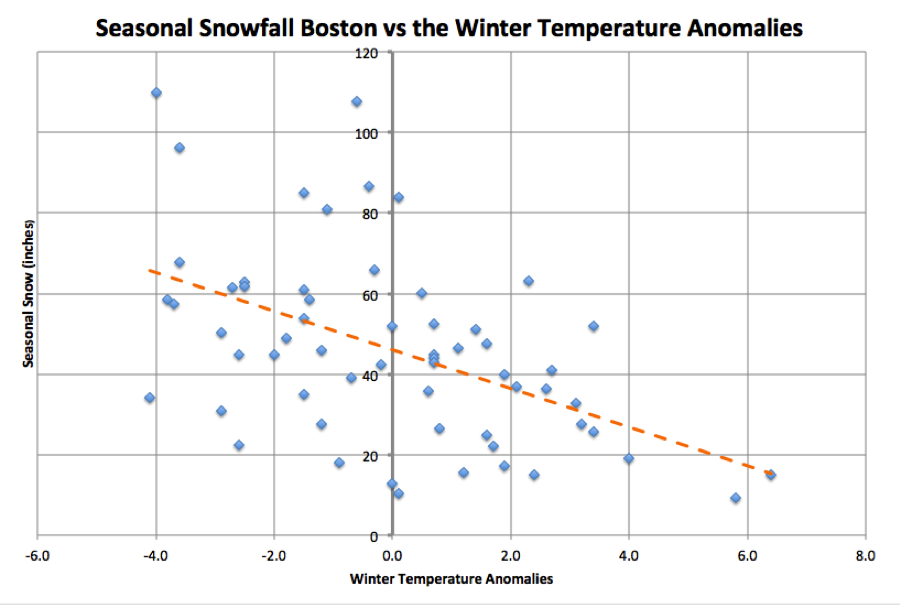
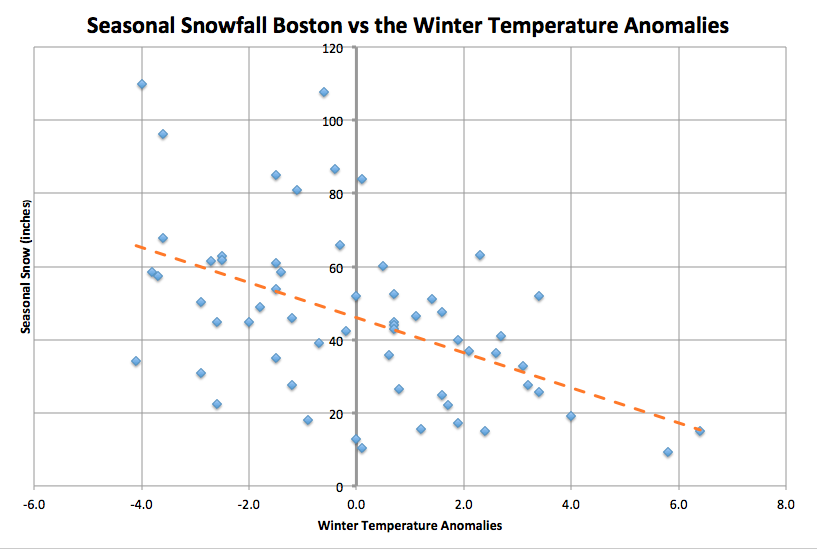
You may hear or read the increased snow is consistent with global warming because warmer air holds more moisture. In actual fact, only 1 of the 14 years with more than 60 inches of snow in Boston was warmer than normal.
Enlarged
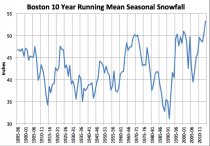
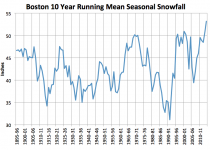
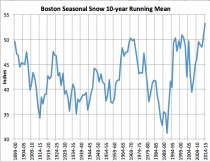
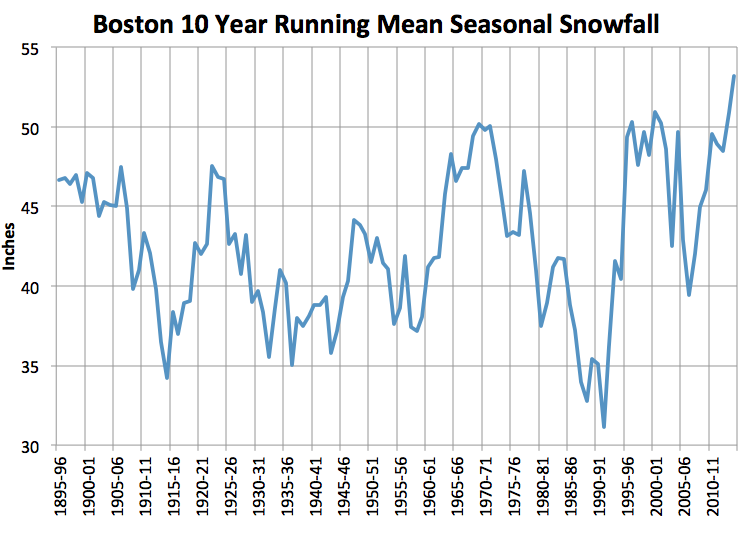
During the 40 days of snowy weather this winter, we averaged over 11F below normal. Cooling increases snowfall not warming. Indeed winter temperatures have cooled over the last two decades in the United States which fits with the fact that 10 year running mean of Boston area snowfall has increased to the highest level since snow records were first kept in 1890.
The cold continued in March here in New England. The month averaged 5.8F below normal here in Nashua and 5.1F below in Boston. There were only four 50F days after no 40F days in February in Boston. This compares with seventeen 50F days, eleven 60F days, seven 70F days and one 80F day in March 2012.
JANUARY TO MARCH RECORD COLD
The January to March average temperatures were the coldest in the entire record in Nashua, Worcester, Providence, Hartford and third coldest in Boston behind only 1885 and 1895.
Ironically 2012 was the warmest first quarter in the record. Despite that spike then, temperatures in the winter (and cold season) in the US (including the northeast states) have declined for over 20 years, which fits with the fact that 10 year running mean of Boston and eastern New England area snowfall has increased to the highest level since snow records were first kept in 1890. This season, most areas of central New England had the snowiest mid to late winter and many spots the snowiest season on record.
The combination of cold and snow here to northern areas and back to the Great Lakes the last two winters, harkens back to the Little Ice Age that ended in the early 20th century.
In 2013/14, Chicago had their coldest December to March back to 1872 and third snowiest while Detroit had their snowiest back to 1880.
The Adirondacks in these years usually gets the worst of the arctic cold. Saranac Lake in February 2015 was 13.6F below normal with 23 sub-zero days, no day reaching freezing and 4 record lows. March had 15 days zero or below with 10 record lows. Last March (2014), Saranac Lake was 11.4F below normal with 10 sub-zero days and 7 record lows. These were two amazing late winters.
WHAT IS BEHIND THE EXTREMES?
I learned early in my career from the some of the giants in the field like Jerome Namias how ocean temperature pools that change locations with changes in the global ocean current circulation patterns in conjunction with strong El Nino and La Nina events are important to where the jet stream sets up and how strong and persistent it is. This determines how extreme winters and summer are for both temperature and precipitation.
A super La Nina in 2010/11 (2nd strongest in 120 years by some measures), set up warm water in the central Pacific and cold water near the west coast of North America, which lead to that record warm and droughty 2011/12 central and eastern winter, spring and summer. That warm water came east first to off of Alaska last year leading to the historic winter near the western Lakes and North Central and then the warm water was carried by the currents southeast to the entire west coast forcing the cold to take aim more on the eastern Lakes and Northeast.
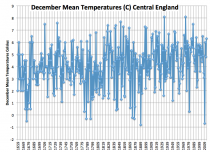
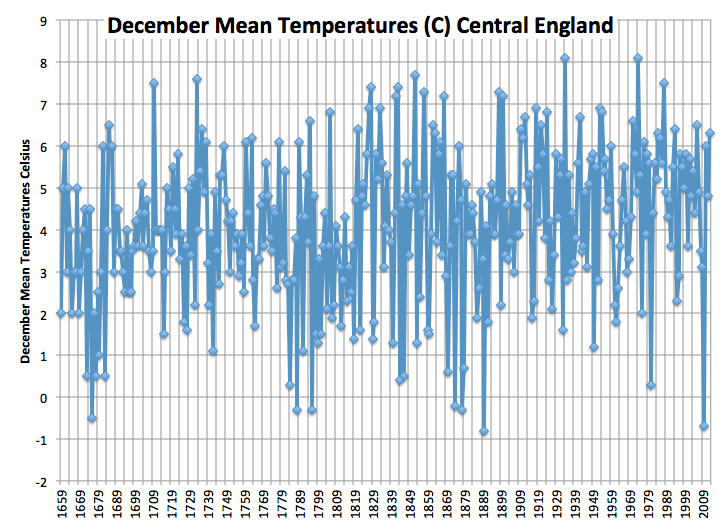
Similar changes occurred in the Atlantic. Starting in 2007, warm North Atlantic helped build high pressure in the Polar Regions and drive Siberian air west to Europe where in December 2010, the UK had their second coldest December since 1659 in the Little Ice Age.
Though scientists had warned them snow was a thing of the past, the UK and much of northern Europe had all-time record snows and cold in 5 of 6 years. The North Atlantic turned cold last year and more so this year and Europe turned milder. But a cold North Atlantic means colder and snowier winters in eastern Canada, the Great Lakes and northeast. The Atlantic thus helped exaggerate the Pacific driven cold last two winters.
At Weatherbell.com, where we use the oceans and sun in our statistical models for long-range prediction, we successfully predicted many months in advance these historic winters.

By Joseph D’Aleo
A quick 2.9 inches of snow at the end of a weekend cold rain storm followed by another 2.3 inches in the following weeks brought Boston to an all-time snow record of 110.6 inches (over 9 feet) beating out the all-time record of 107.6 set in 1995/96. In that year, the snow was spread out over 6 months.
This year it has been mostly concentrated in 40 days centered on the second coldest month in the city’s history. Records for snowfall began in 1891, temperatures in 1872 in Boston. The snowy recent years have the 10 year running mean at a new high in the entire record.

----------
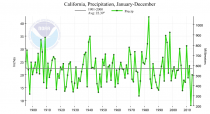
California is seeing the reverse of 2012 when the eastern Pacific was cold and the coastal areas cold and wet. Now the eastern Pacific is warm due to downstream effects after the super La Nina of 2010/11 and the cluster of La Ninas since 2007. This warming in the eastern Pacific is similar to what happened in the 1970s when La Ninas were dominant and some strong in the last cold PDO. In 1976, water warmed off the west coast and a two year devastating drought followed despite, like this year, a weak El Nino. 1977/78 was legendary big snow year in Boston which 2014/15 will surpass or at least rival in the minds of the populace that experienced both years.
See the warm water now.
_thumb.png)
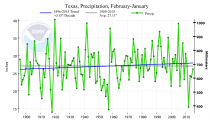
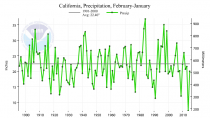
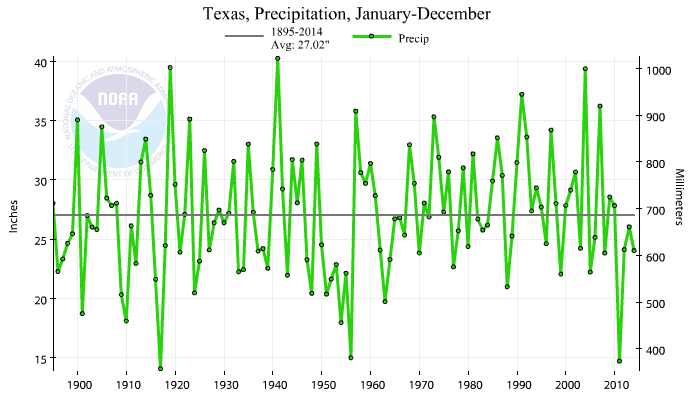
See the California precipitation plot since 1895. It is obious there is no ‘trend’ anymore than the dry warm year in 2012 in Texas was anything unusual or the start of a permanent drought.
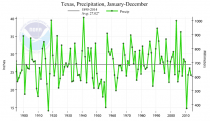
The warmists decided several years ago to play ambulance chasing games to try and alarm the public into believing every natural event was man made and required eliminating fossil fuel from the energy equation because it emits CO2, a beneficial gas, which by the way we emit 40,000 ppm in every breath we take into air containing near 400 ppm. Record crop yields have occurred as a benefit of the increased CO2, allowing us to feed more of the world’s people at a lower cost.
By Joe D’Aleo, CCM
Despite the fact that winters have been cooling in the CONUS (all 9 climate regions) for the last 20 years and snows have been increasing, the Union of Concerned ‘Scientists’, an advocacy group whose environmentalists have taken over most universities at least here in the northeast have been advising the state goverments that warming was producing less snow and threatening the ski and maple sugar industries. They have been repeating this since at least 2007, ignoring new snow records not only in ski areas but in the big cities. Boston 10 year running mean is at a new high. A lot of bad energy and regulatory policy has been already enacted based on ‘failing climate models’ on the state and federal level.
While some democrats with full mainstream media support, are trying to silence scientists who don’t accept the so called consensus ‘warming’ position, mother nature is voting ‘Nay’.
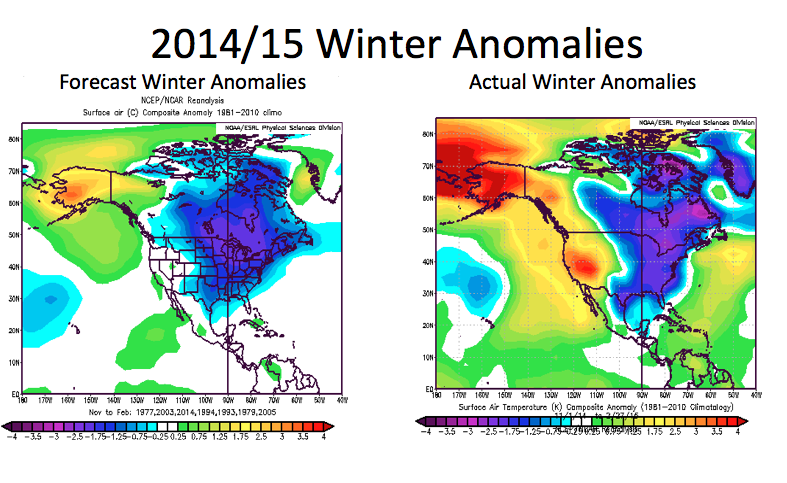
Last three years had heavy snows and last March was coldest ever in VT. 2nd coldest in NH, ME, 5th in MA. It was the coldest and snowiest December to March ever in Chicago and snowiest ever in Detroit. NOAA and Enviornment Canada had projected at the end of November 2013 a warm winter for the Great lakes and east in 2013/14. NOAA’s winter outlook in October for 2014/15 smarting from a busted 2013/14 headlined the politically correct forecast
“Repeat of last year’s extremely cold, snowy winter east of Rockies unlikely.”
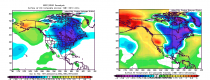
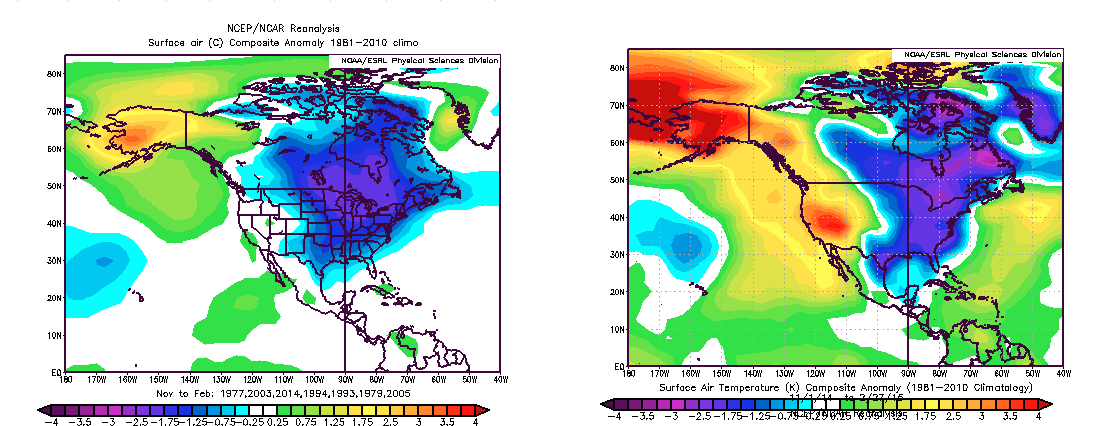
Note that we have high respect for NOAA forecasters at all levels who strive hard to provide accurate forecasts and life saving warnings. However, the last two years were high confidence cold forecasts based on ocean temperature patterns. I was told over dozen years ago, NOAA seasonal forecasters are not permitted to work with any factors not statistically determined by the universities or labs to be valid. Private sector forecasters can play detective and look at all factors- like ocean warm and cold pools outside the tropical Pacific and solar. See how well the ocean pools and other factors’ analog pattern (left) fit the actual November to February mean (through February 27) (right).
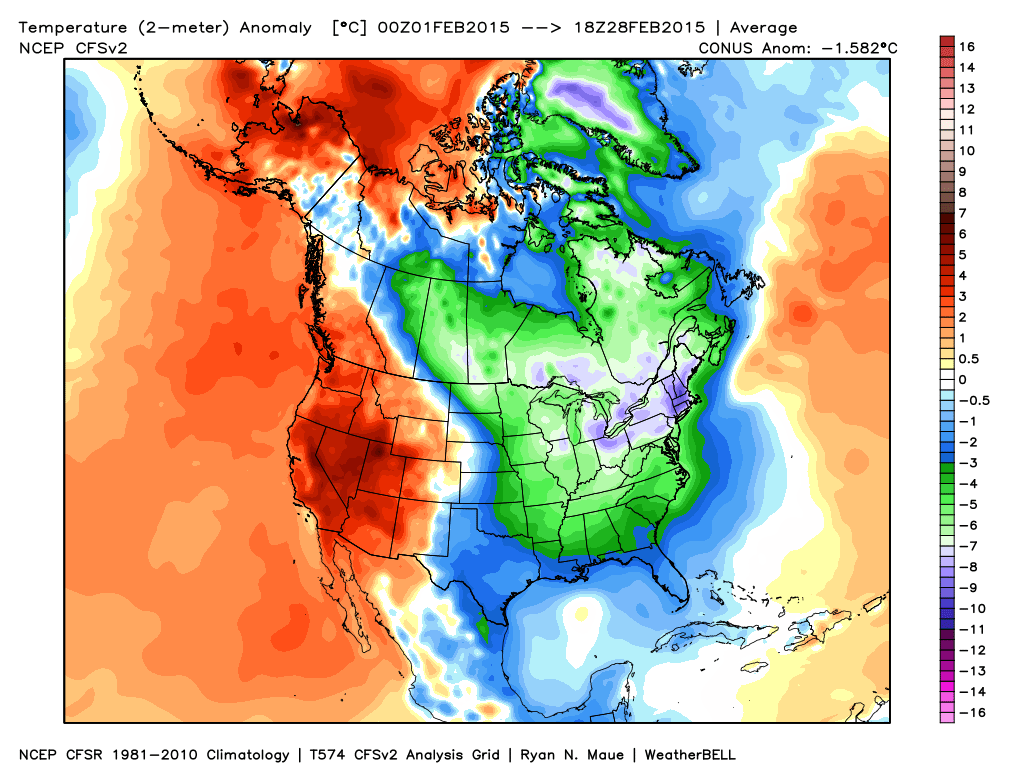
After a frigid November, in late December, mild weather got the official winter off to a slow start nationwide. January brought cold to the central and east but the thaw mid month central knocked down the anomalies there. Then came this February. The month has been a remarkable one from the Great Lakes to the Northeast and Mid Atlantic.
This February has been 2nd coldest winter month EVER in BOS behind only February 1934. BOS had 8 feet of snows since January 24th and will set the all-time record this week (they are now at 102”, record 107.6 inches in 1995/96).
In Boston, where they have had 8 feet of snow since January 24th, it was the 2nd coldest February and month ever. It was the snowiest winter (DJF) on record and will be the snowiest season perhaps by Monday. There is some evidence this may be the snowiest year since the Pilgrims were here in 1717.
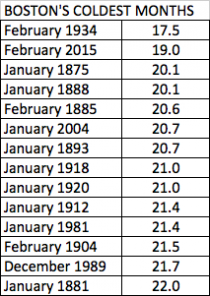
It was the coldest month ever in Worcester and Hartford, 2nd coldest in Providence (like Boston trailing 1934).
In Concord it was the 2nd coldest February just 0.1F behind 1934. In Nashua the next town west from me, it was the coldest month ever beating out January 1888! Records go back to 1886. Nashua had 18 days at 0 or below and 25 days below freezing, both records for any month. We are foot away from the all time record.
In Chicago where it was the 3rd snowiest February, it was the coldest since records began in 1872. February 2014 was 8th coldest.
It ranked between 2nd and 5th coldest month in lower Michigan.
In Cleveland it was the coldest February and trailed only 1977 for the coldest month.
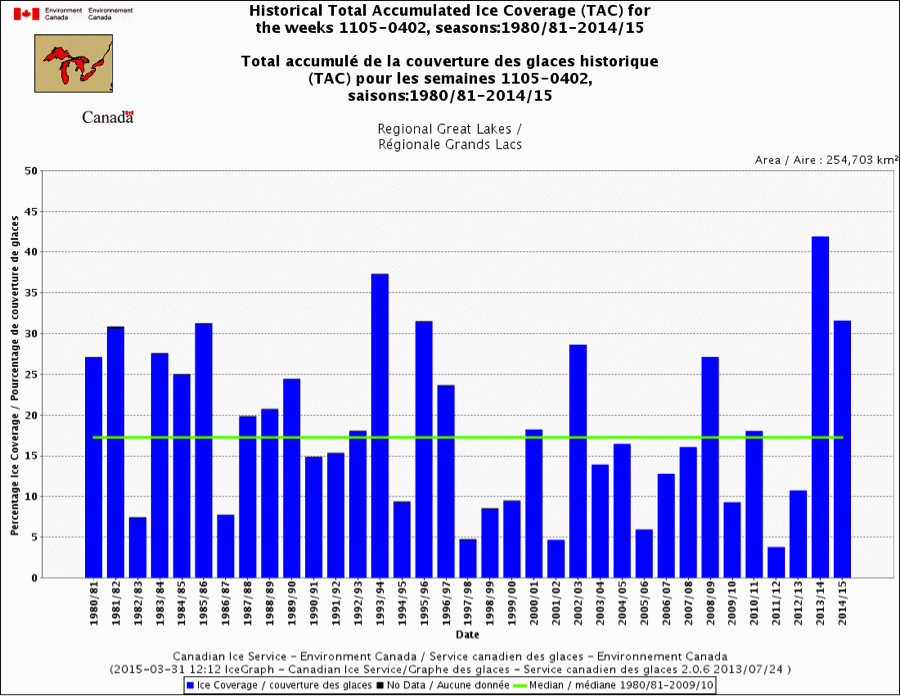
The ice cover has increased to 88.8%. Last year this is when the ice made its run for the gold, topping out at 92.5%. They were 85.4% on the same date.
_thumb.png)
The next 5-10 days, cold temperatures will help challenge the record. As with Antarctica, when the facts are inconvenient, expect the media to dredge up some story that implies the opposite. The last two weeks there were stories that Lake Superior may be warming faster than any other lake in the world. The last two years it has frozen over (rare because it is so deep) and last year ice flows remained into June with lake temperature 7F below normal.
In New York CIty it was the 3rd coldest February and 9th coldest month since records began in 1869.
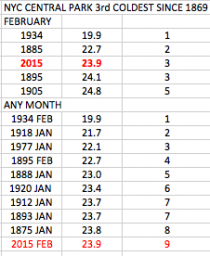
Enlarged
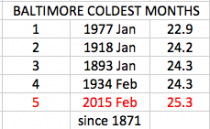
In Baltimore, it was the 5th coldest month since 1871.
Speaking of icy water, this is from a photographer on Nantucket. It should be looked at from the perspective that some scientists were blaming the snows in Boston on a warm Atlantic pool east of Cape Cod (MMann - as much as 21F above normal). In actual fact specific humidity during the cold period was well below normal and each of the three major snowstorms occurred in Bston with temperatures in the teens.
The waves captured by NBC photographer Jonathan Nimerfroh are so thick with ice that they’ve drawn comparisons to ‘Slurpees’ and other frozen beverages, but the texture and shape of the wave also suggest a giant, grey tongue, licking the shores of Nantucket.
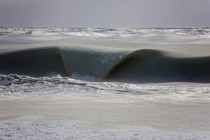
Here’s what the photographer had to say about his images: “When I pulled up to the beach I could see the horizon just look strange. When I got to the top off the dunes I saw that beginning about 300 yards away from the shoreline the ocean was starting to freeze. The high temp that day was around 19 degrees. The wind was howling from the southwest which would typically make rough or choppy conditions not so good for surfing, but since the surface of the sea was frozen slush the wind did not change the shape. What resulted was perfect, dreamy, slush waves. Most waves were around 2 feet with some larger sets slushing through around 3 foot or waist high. What an experience to be absolutely freezing on the beach watching these roll in while I mind-surfed them! I wonder if a shaper can make me a special designed slurfboard?”
“The next day I drove up to see if they melted but beginning that same 300 yards away from shore the water had frozen solid and there were no waves at all. I’ve been asking all the fishermen and surfers I know if they have ever seen such a thing and they have all reported that this is a first, a result of it being the coldest winter we’ve had in 81 years. I guess the people I asked weren’t old enough to remember a colder winter than this!”
One last thought, we hear that warming is why we are seeing more snow because warm air holds more water. Meteorologists know that cold weather produces snow. When it is cold, the atmospheric water content is less. See this prior analysis. Indeed most big snow years are cold years, warm years lean on snow.
Cold snaps like the ones that hit the eastern United States in the past winters are not a consequence of climate change. Scientists at ETH Zurich and the California Institute of Technology have shown that global warming actually tends to reduce temperature variability.
Repeated cold snaps led to temperatures far below freezing across the eastern United States in the past two winters. Parts of the Niagara Falls froze, and ice floes formed on Lake Michigan. Such low temperatures had become rare in recent years. Pictures of icy, snow-covered cities made their way around the world, raising the question of whether climate change could be responsible for these extreme events.
It has been argued that the amplified warming of the Arctic relative to lower latitudes in recent decades has weakened the polar jet stream, a strong wind current several kilometres high in the atmosphere driven by temperature differences between the warm tropics and cold polar regions. One hypothesis is that a weaker jet stream may become more wavy, leading to greater fluctuations in temperature in mid-latitudes. Through a wavier jet stream, it has been suggested, amplified Arctic warming may have contributed to the cold snaps that hit the eastern United States.
Temperature range will decrease
Scientists at ETH Zurich and at the California Institute of Technology, led by Tapio Schneider, professor of climate dynamics at ETH Zurich, have come to a different conclusion. They used climate simulations and theoretical arguments to show that in most places, the range of temperature fluctuations will decrease as the climate warms. So not only will cold snaps become rarer simply because the climate is warming. Additionally, their frequency will be reduced because fluctuations about the warming mean temperature also become smaller, the scientists wrote in the latest issue of the Journal of Climate.
The study’s point of departure was that higher latitudes are indeed warming faster than lower ones, which means that the temperature difference between the equator and the poles is decreasing. Imagine for a moment that this temperature difference no longer exists. This would mean that air masses would have the same temperature, regardless of whether they flow from the south or north. In theory there would no longer be any temperature variability. Such an extreme scenario will not occur, but it illustrates the scientists’ theoretical approach.
Extremes will become rarer
Using a highly simplified climate model, they examined various climate scenarios to verify their theory. It showed that the temperature variability in mid-latitudes indeed decreases as the temperature difference between the poles and the equator diminishes. Climate model simulations by the Intergovernmental Panel on Climate Change (IPCC) showed similar results: as the climate warms, temperature differences in mid-latitudes decrease, and so does temperature variability, especially in winter.
Temperature extremes will therefore become rarer as this variability is reduced. But this does not mean there will be no temperature extremes in the future. “Despite lower temperature variance, there will be more extreme warm periods in the future because the Earth is warming,” says Schneider. The researchers limited their work to temperature trends. Other extreme events, such as storms with heavy rain or snowfall, can still become more common as the climate warms, as other studies have shown.
North-south shift makes the difference
And the jet stream? Schneider shrugs off the idea: “The waviness of the jet stream that makes our day-to-day weather does not change much.” Changes in the north-south difference in temperatures play a greater role in modifying temperature variability.
Schneider wants to explore the implications these results have in further studies. In particular, he wants to pursue the question of whether heatwaves in Europe may become more common because the frequency of blocking highs may increase. And he wants to find why these high pressure systems become stationary and how they change with the climate.
Read more.
Richard Lindzen, The Wall Street Journal
Research in recent years has encouraged those of us who question the popular alarm over allegedly man-made global warming. Actually, the move from “global warming” to “climate change” indicated the silliness of this issue. The climate has been changing since the Earth was formed. This normal course is now taken to be evidence of doom.
Individuals and organizations highly vested in disaster scenarios have relentlessly attacked scientists and others who do not share their beliefs. The attacks have taken a threatening turn.
As to the science itself, it’s worth noting that all predictions of warming since the onset of the last warming episode of 1978-98 - which is the only period that the United Nations Intergovernmental Panel on Climate Change (IPCC) attempts to attribute to carbon-dioxide emissions - have greatly exceeded what has been observed. These observations support a much reduced and essentially harmless climate response to increased atmospheric carbon dioxide.
In addition, there is experimental support for the increased importance of variations in solar radiation on climate and a renewed awareness of the importance of natural unforced climate variability that is largely absent in current climate models. There also is observational evidence from several independent studies that the so-called “water vapor feedback,” essential to amplifying the relatively weak impact of carbon dioxide alone on Earth temperatures, is canceled by cloud processes.
There are also claims that extreme weather - hurricanes, tornadoes, droughts, floods, you name it - may be due to global warming. The data show no increase in the number or intensity of such events. The IPCC itself acknowledges the lack of any evident relation between extreme weather and climate, though allowing that with sufficient effort some relation might be uncovered.
World leaders proclaim that climate change is our greatest problem, demonizing carbon dioxide. Yet atmospheric levels of carbon dioxide have been vastly higher through most of Earth’s history. Climates both warmer and colder than the present have coexisted with these higher levels.
Currently elevated levels of carbon dioxide have contributed to increases in agricultural productivity. Indeed, climatologists before the recent global warming hysteria referred to warm periods as “climate optima.” Yet world leaders are embarking on costly policies that have no capacity to replace fossil fuels but enrich crony capitalists at public expense, increasing costs for all, and restricting access to energy to the world’s poorest populations that still lack access to electricity’s immense benefits.
Billions of dollars have been poured into studies supporting climate alarm, and trillions of dollars have been involved in overthrowing the energy economy. So it is unsurprising that great efforts have been made to ramp up hysteria, even as the case for climate alarm is disintegrating.
The latest example began with an article published in the New York Times on Feb. 22 about Willie Soon, a scientist at the Harvard Smithsonian Center for Astrophysics. Mr. Soon has, for over 25 years, argued for a primary role of solar variability on climate. But as Greenpeace noted in 2011, Mr. Soon was, in small measure, supported by fossil-fuel companies over a period of 10 years.
The Times reintroduced this old material as news, arguing that Mr. Soon had failed to list this support in a recent paper in Science Bulletin of which he was one of four authors. Two days later Arizona Rep. Raul Grijalva, the ranking Democrat on the Natural Resources Committee, used the Times article as the basis for a hunting expedition into anything said, written and communicated by seven individuals - David Legates, John Christy, Judith Curry, Robert Balling, Roger Pielke Jr. , Steven Hayward and me - about testimony we gave to Congress or other governmental bodies. We were selected solely on the basis of our objections to alarmist claims about the climate.
In letters he sent to the presidents of the universities employing us (although I have been retired from MIT since 2013), Mr. Grijalva wanted all details of all of our outside funding, and communications about this funding, including “consulting fees, promotional considerations, speaking fees, honoraria, travel expenses, salary, compensation and any other monies.” Mr. Grijalva acknowledged the absence of any evidence but purportedly wanted to know if accusations made against Mr. Soon about alleged conflicts of interest or failure to disclose his funding sources in science journals might not also apply to us.
Perhaps the most bizarre letter concerned the University of Colorado’s Mr. Pielke. His specialty is science policy, not science per se, and he supports reductions in carbon emissions but finds no basis for associating extreme weather with climate. Mr. Grijalva’s complaint is that Mr. Pielke, in agreeing with the IPCC on extreme weather and climate, contradicts the assertions of John Holdren, President Obama’s science czar.
Mr. Grijalva’s letters convey an unstated but perfectly clear threat: Research disputing alarm over the climate should cease lest universities that employ such individuals incur massive inconvenience and expense - and scientists holding such views should not offer testimony to Congress. After the Times article, Sens. Edward Markey (D., Mass.), Sheldon Whitehouse (D., R.I.) and Barbara Boxer (D., Calif.) also sent letters to numerous energy companies, industrial organizations and, strangely, many right-of-center think tanks (including the Cato Institute, with which I have an association) to unearth their alleged influence peddling.
--------
In their own words, their real agenda:
At a news conference in early February, 2005 in Brussels, Christiana Figueres, admitted that the goal of environmental activists is not to save the world from ecological calamity but to destroy capitalism.
“This is the first time in the history of mankind that we are setting ourselves the task of intentionally, within a defined period of time, to change the economic development model that has been reining for at least 150 years, since the Industrial Revolution,” she said. Referring to a new international treaty environmentalists hope will be adopted at the Paris climate change conference later this year, she added: “This is probably the most difficult task we have ever given ourselves, which is to intentionally transform the economic development model for the first time in human history."--Investor’s Business Daily, 10 February 2015
And, as EPA Administrator Gina McCarthy testified before the Senate Environment and Public Works Committee on July 23, 2014:
“The great thing about this [EPA Power Plan] proposal is that it really is an investment opportunity. This is not about pollution control.”
By Steve Goreham
Originally published in Communities Digital News.
The use of petroleum is under attack as never before in today’s society. But contrary to the cries of critics, petroleum and the things people can do with petroleum are a modern miracle and a foundation of modern society.
Last year, the Intergovernmental Panel on Climate Change of the United Nations called for the world to move to “near zero emissions” of carbon dioxide by the year 2100. President Obama has threatened to veto the Keystone XL pipeline bill. Activist Bill McKibben has launched a national effort to persuade universities and colleges to divest financial holdings in oil companies. These efforts target the oil industry with the aim of eliminating the societal use of petroleum.
But have you ever stopped to consider what petroleum products do for people each and every day?
Back in 1620, it took the 120 passengers and crew of the Mayflower 25 days to travel from England to what was to become America. Two passengers died on the voyage. Today, a jumbo jet safely carries more than 300 passengers the same distance in less than seven hours. Each day, 25,000 commercial aircraft transport 9 million passengers a combined total of 10 billion miles, all powered by aviation fuel from petroleum.
Back in the late 1800s, the horse-drawn carriage became a preferred mode of transportation in major cities. By 1890, the average New York citizen took 297 horse car rides per year. The 200,000 horses of New York deposited three to six million pounds of manure in stables and on streets each day. When the “horseless carriage” replaced the mess and smell of the horse-drawn carriage, many regarded the car as a pollution-control invention. Each day today, fuel from petroleum powers more than one billion automobiles across the world.
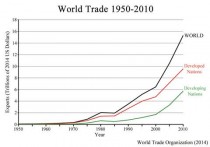
Historically, goods traded between societies were transported by camel, wagon, and sail. While trade has grown throughout history, the value of total world exports amounted to only about $10 billion per year in 1900, measured in today’s dollars. Since 1900, world exports have exploded, increasing 1,800 times to a total of $18 trillion per year in 2013. Each day, more than 100 million tons of freight is carried by ship, train, truck, and plane, with more than 90 percent powered by fuel from petroleum.
Back in 1809, Emperor Napoleon Bonaparte of France had a problem. When his armies marched across Europe, food supplies for his troops quickly spoiled. He offered a reward of 12,000 francs for a solution, which led to the invention of sterilized food sealed in tin cans. Historically, food was “packaged” in animal skins, glass, paper, metal cans, and wooden crates. Today, plastics from petroleum and other hydrocarbons provide safe, convenient, and inexpensive packaging for food and other products. More than two million plastic bottles and 1.3 billion plastic bags are consumed each day globally.
Each day, one-half million in-patient surgeries are performed across the world. Plastics from oil and natural gas play an essential role in modern medicine. Thousands of items, such as disposable catheters, surgical gloves, pharmaceutical drugs, hip implants and heart valves, bandages, and various parts of lab equipment are plastic, made from petroleum and other hydrocarbons.
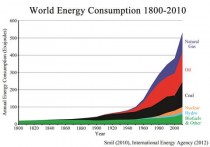
Today we live in a golden age of low-cost energy. Just two hundred years ago, wood burning and human- and animal-muscle power provided more than 90 percent of society’s energy. Since 1800, global energy usage has increased by 26 times. Today, more than 30 percent of the world’s energy is provided by petroleum and more than 80 percent is provided by coal, natural gas, and oil.
Since 1800, global Gross Domestic Product has increased by a factor of 10, human life expectancy has more than doubled, and infant mortality is down by a factor of six. Since 1950, the years of education for world populations have more than doubled. In our golden age of hydrocarbon energy, people are wealthier, healthier, better educated, and enjoy more consumer goods and leisure time than any era in history.
Despite climate change warnings by the Obama administration and the United Nations, there is no evidence that carbon dioxide emissions from the petroleum industry have harmed a single person on Earth. Senior citizens continue to retire to southern states, disregarding foolish US government claims that warm climates are “dangerous.”
Satellite data shows global temperatures have been flat for the last 18 years, that storms are neither stronger nor more numerous than those of history, and that global sea ice extent remains at the 30-year average. Satellites further show that world vegetation has increased over the last 20 years, nourished by rising atmospheric CO2. And today’s polar bear populations are double the levels of 1960.
Nor is there evidence that petroleum use is causing increasing pollution of Earth’s environment. Today, air and water pollution is declining in all major industrialized nations. Nations that use the most energy and petroleum have the best air and water quality and the best methods for handling disposal of wastes. Trends indicate that developing nations will also achieve declining pollution levels as their national incomes rise.
We’re fortunate to be living in a golden age of energy, fueled by petroleum.
Steve Goreham is Executive Director of the Climate Science Coalition of America and author of the book The Mad, Mad, Mad World of Climatism: Mankind and Climate Change Mania.
We ain’t seen nothing yet: The intense drought in California is only an appetizer compared with what’s coming this century across much of the western and central USA, according to a study out last Thursday.
During the years 2050 to 2100, the Southwest and Great Plains will face a persistent “megadrought” worse than anything seen in the past 1,000 years, and the dry conditions will be “driven primarily” by human-induced global warming, scientists said.
There’s at least an 80% chance of a megadrought in these regions if climate change continues unabated, Toby Ault, an atmospheric scientist at Cornell University and co-author of the research, said at a news conference Thursday in San Jose.
A megadrought is defined as a drought that lasts for decades or longer, such as those that scorched portions of the West in the 12th and 13th centuries. Ault said megadroughts should be considered a natural hazard on par with earthquakes and hurricanes.
To identify past droughts, scientists studied tree rings to find out how much - or little - rain fell hundreds or even thousands of years ago. Scientists used that historical data in combination with 17 different computer model simulations to predict what changes we may see this century.
The computers showed robust and consistent drying in the Southwest and Plains, due to a combination of reduced precipitation and warmer temperatures that dried out the soils.
“Natural droughts like the 1930s Dust Bowl and the current drought in the Southwest have historically lasted maybe a decade or a little less,” Ben Cook, climate scientist at NASA’s Goddard Institute for Space Studies and lead author of the study, said in a statement.
-------
Icecap comments:
First the authors admit it happened before in 12th and 13th century. So such a thing is not unprecedented. Indeed, droughts have multiyear and longer variability. Instrumental data indicate that the Dust Bowl of the 1930s and the 1950s drought were the most widespread twentieth-century droughts in the United States, while tree ring data indicate that the megadroughts over the 12th Century exceeded anything in the 20th Century in both spatial extent and duration.
Second, it is based on model simulations - the same models that have failed in every projection since the 1990s. Third the drought in Texas that they said was unprecedented was nothing like the multi year drought of the 1950s. Fourth the Calfirnia drought is related to the warm water off the west coast as an after effect of the super La Nina of 2010/11 which led to cold water there and warm to the west that migrated to the west coast. It will be gone in a year and rains will return. In fact this rainy season though not the heavy wet El Nino is running near normal for rains in the northern parts of California and the Sierra though snowpack lags. There wil be more episodic rains and snows and a slow exit from the drought can be expected the next year or so.
_thumb.png)
And finally, since, the 60 year cycle max has past, and the Atlantic cooling will accelerate the PDO will resume its cold mode and the sun will continue its dive into a 200 year minimum, temperatures will cool not warm the next few decades or longer. Ironically historic megadroughts have been common in cold periods because they tend to have amplified pattern and show more persistence in the patters leading to cold and warm areas. wet and dry areas. Their models are worthess because they do not consider the oceans and sun and they projections are based entirely on radiative factors and assumptions, many of which have been shown to be wrong. Their failures prove that.
By Joseph D’Aleo, CCM
Update: The snowstorm in the northeast less than a week after the big blizzard, made it the snowiest 10 day period ever in Boston beating out January 1996. 47.9” fell in the Boston area the last 10 days beating out the 36.6” ending in early January 1996. Over 52 inches fell in the Worcester area in just the last 2 storms where another 17.5 fell after the record 34.5 inch snowstorm fell last week. During the storms, temperatures have been as cold as the single digits and in Maine below zero with heavy snows. If this global warming gets any worse, we will all freeze to death.
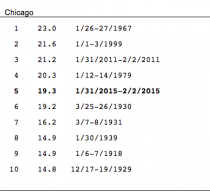
The 16.2 inches recorded at Chicago’s O’Hare just during the hours of February 1st (out of 19.3 inches total) were the most ever for any February day in Chicago. The 10.5 inches recorded on February 1st at Rockford (out of 11.9 inches total) ranked #2 all time for the date and #3 all time for any February day in Rockford. For the event as a whole, the 19.3 inches at O’Hare ranks as #5 out of all snow events in Chicago, while the 11.9 inches at Rockford ranks as #10 overall for that city.
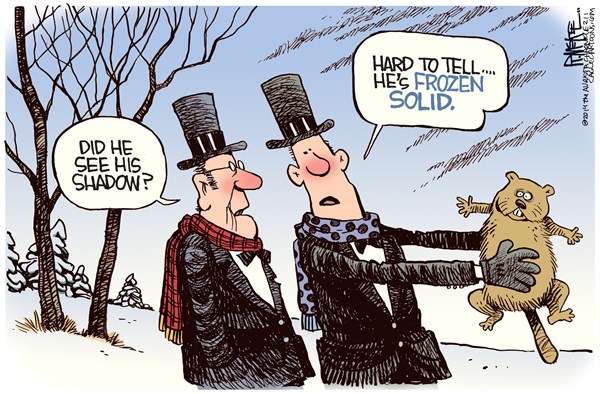
Monday was Ground Hog Day and Punxatwney Phil saw his shadow and he forecasts 6 more weeks of winter.

--------
February 2 08:42 AM
The theme had been snows were diminishing due to global warming.
Flashback 2000: ‘Snowfalls are now just a thing of the past’: According to Dr. David Viner, a senior research scientist at the climatic research unit (CRU) of the University of East Anglia, within a few years winter snowfall will become ‘a very rare and exciting event. Children just aren’t going to know what snow is.’
The IPCC and US government reports through 2007 had projected snows would become much less common as the climate warms especially in the cities.
Environmentalist from Princeton Michael Oppenheimer and RFK Jr, in the year before the Snomageddon winter both bemoaned their children would never get to enjoy sledding like they did as young in the 1960s.
Sleds and snows were the only way to get around at times in 2009/10.
The New York Times had an article in February, 2014 titled ‘The end of snow.’ The article documented how snow soon was going to be a distant memory and our kids would never see it except in news reels.
EPA’s chief Gina McCarthy said in Colorado snows are decreasing and soon Colorado would be like Amarillo (ironically which 12-14 inches of snow that day).
Oh really?
5 of the top 10 snowstorms have occurred since 2003 in NYC. And the decade has been the snowiest in the eastern US cities since the 1950s (just 5 years in).
And now the same scientists tell us that snowstorms are increasing and they have long known it:
“We’ve long known that warmer-than-normal winters favor snow storms. Temporal and Spatial Characteristics of Snowstorms in the Contiguous United States found we are seeing more northern snow storms and that we get more snow storms in warmer years: The temporal distribution of snowstorms exhibited wide fluctuations during 1901-2000....Upward trends occurred in the upper Midwest, East, and Northeast, and the national trend for 1901-2000 was upward, corresponding to trends in strong cyclonic activity.... Assessment of the January-February temperature conditions again showed that most of the United States had 71%-80% of their snowstorms in warmer-than-normal years.’
A future with wetter and warmer winters, which is one outcome expected, will bring more snowstorms than in 1901-2000. Agee (1991) found that long-term warming trends in the United States were associated with increasing cyclonic activity in North America, further indicating that a warmer future climate will generate more winter storms.
Oh really?
As Joe Bastardi noted, the last two storms with better than 20 to 1 ratios in areas near Boston occur in colder weather not warm years.
-------------------
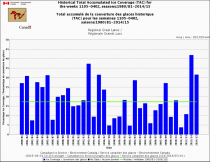
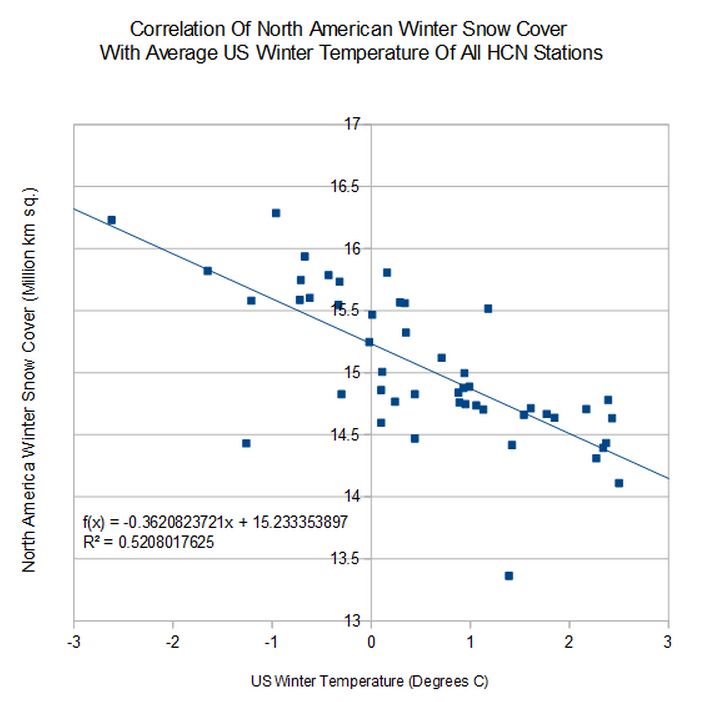
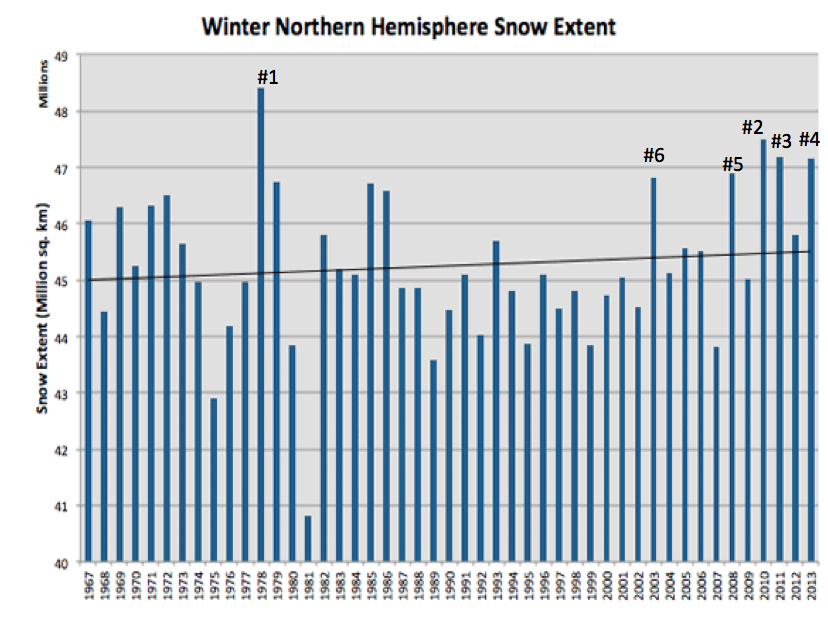
Lets look at North American snowcover versus temperatures. And see also that for the Northern Hemisphere winters, 4 of the top 5 winters for snowcover extent have occurred since 2007/08.
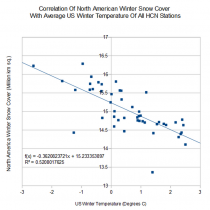

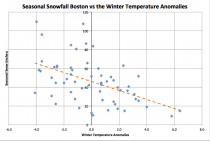
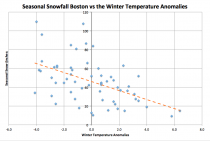
Boston seasonal snow versus winter temperature anomalies:
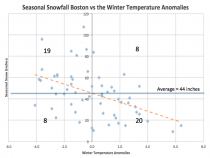
In other words, colder than normal winters have a 70% chance of above normal snows, warmer than normal winters a 71% chance of below normal snows in Boston.
And by the way, the winters have cooled for 20 years in the U.S.

Case closed.
JB and I have agreed that the warm water off the east coast ls warmer after a few quiet tropical seasons and with the AMO in transition does helps provide enhanced moisture for the snows but again the ratios in the very cold snow events pumps up totals too. In warm winters like 1997/98, 2001/02 or 2011/12, rains are more likely.
Today’s snowstorm have more following.
_thumb.png)
By Robert Lee Hotz, Wall Street Journal
National Weather Service experts misjudged the path and impact of the blizzard that struck the Northeast on Monday and Tuesday, in large part because they trusted the wrong forecasting model, several independent meteorologists said.
Rather than rely on their own forecasting system-upgraded in recent weeks - the federal experts placed their faith instead on a well-regarded European computer model that predicted the worst of this storm would squarely hit New York City. That system earlier had outperformed the U.S. forecasting system in predicting the path of superstorm Sandy.
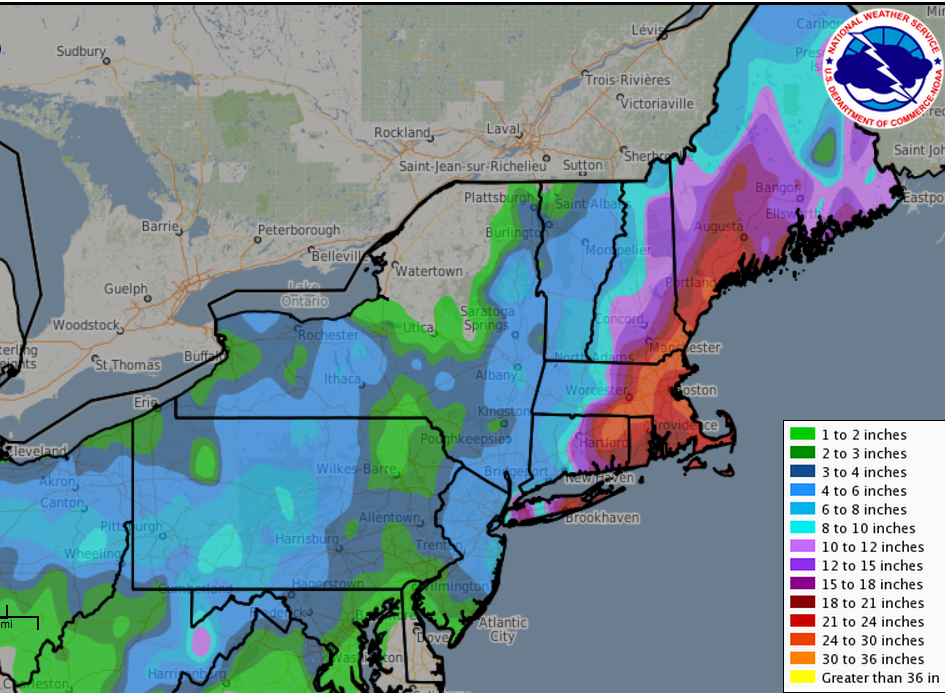
This time, the European forecasting model was wrong, several commercial forecasters said. That model, one of four complex computer simulations normally used to calculate weather patterns along the Eastern seaboard, predicted that the heaviest snow would fall between 50 and 100 miles farther west than actually occurred. Still, it correctly calculated the broader outlines of the blizzard. As predicted, the storm pounded parts of Long Island, Connecticut, Rhode Island, Massachusetts and Maine, with winds in excess of 50 mph and snow in some locales up to 30 inches deep.

See amounts across the New York area and New England here.
Experts predicted the blizzard nicknamed Juno could dump record snow amounts on New York City. This timelapse view of Manhattan during the storm shows that the reality was far less impressive. Other parts of the Northeast received record snowfalls.
“Too much trust was based on a single model, and there was not enough emphasis on uncertainty,” said Jeff Masters, chief meteorologist at Weather Underground, a commercial forecasting service. “The European model was about 100 miles off. That is a big deal for a heavy snow situation”.
The National Weather Service had recently improved its own system, called the Global Forecast System, and its forecast correctly predicted that the storm would go farther out to sea, away from New York City.
Joe D’Aleo, one of the chief forecasters at Weatherbell Analytics LLC, a commercial forecasting company based in New York, said the revamped system was perhaps still too new to be considered completely reliable. “It has not been battle-tested,” he said.
Even so, some uncertainty is the norm. “The models are very rarely exactly on track,” Mr. D’Aleo.
The National Weather Service in Washington, D.C., didn’t respond to an inquiry about its forecasting models today. In a statement this morning, the service’s New York office said, “The science of forecasting storms, while continually improving, still can be subject to error, especially if we’re on the edge of the heavy precipitation shield. Efforts, including research, are already under way to more easily communicate that forecast uncertainty.”
Republicans on Wednesday agreed that climate change is not a hoax. Sort of.
In what The Washington Post characterizes as a “nifty, if insincere, bit of politics,” Republicans successfully parsed language in an amendment to the Senate’s Keystone XL pipeline bill that stated climate change “is real and not a hoax.”
Democrats had been trying to force Republicans to state, on the record, their positions on human contributions to climate change.
In an act of chicanery, Oklahoma Sen. Jim Inhofe, who authored a book on the subject entitled “The Greatest Hoax: How the Global Warming Conspiracy Threatens Your Future,” argued in favor of the amendment, stating climate change is not a hoax.
He gave his reasoning in a speech on the Senate floor.
“Climate is changing, and climate has always changed, and always will, there’s archaeological evidence of that, there’s biblical evidence of that, there’s historic evidence of that, it will always change,” Inhofe said.
“The hoax is that there are some people that are so arrogant to think that they are so powerful that they can change climate. Man can’t change climate.”
The hoax, according to Inhofe, was the idea that man was responsible for global warming.
Just before the vote, Inhofe sent a cryptic message on Twitter alluding to something in the works.
Democratic Sen. Sheldon Whitehouse of Rhode Island had attached the “hoax” language to the Keystone bill.
It was expected to fail, but Republicans successfully altered the wording so that they could vote for the bill while continuing to argue that climate change was not man-made.
The only Republican who did not vote for the amendment was Mississippi Sen. Roger Wicker.
“With Inhofe’s re-framing the question, the Democrats, trying to engineer a gotcha moment, ended up empty-handed on the vote, with neither the satisfaction of nailing down opposition to scientific consensus and without a point of leverage for future discussions of addressing the warming planet,” according to Post writer Philip Bump.
Politico reports that a GOP Senate aide needled Democrats following the vote, questioning why Democrats were wasting their time trying to “embarrass” Republicans on climate change instead of “offering substantive proposals” on carbon tax or cap-and-trade emissions legislation.
“Democrats are stuck in messaging mode,” the aide said. Have been for 6 years.
By Dr. Craig Idso, CO2 Science
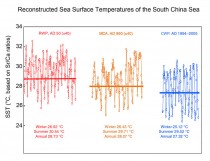
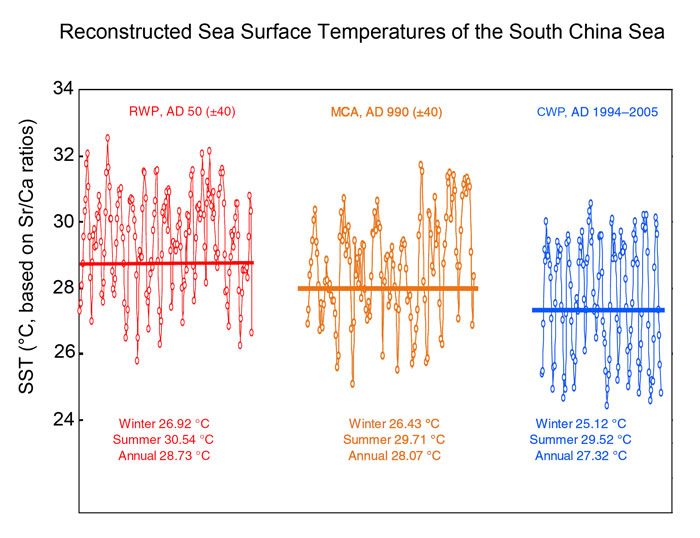
In an eye-opening study published in the Chinese Science Bulletin, Yan et al. (2014) recount how they derived high-resolution sea surface temperature (SST) histories of two 80-year time windows centered at approximately AD 990 and AD 50 within the Medieval Climate Anomaly (MCA) and the Roman Warm Period (RWP), respectively, by analyzing the Sr/Ca ratios and δ18O values of Tradacna gigas (giant clam) shells collected from the northern South China Sea.
As indicated in the figure below, this undertaking revealed that the mean annual SSTs of the 80-year periods centered on AD 990 (MCA) and AD 50 (RWP) were 0.8C and 1.4C higher than the mean SST during the AD 1994-2005 portion of the Current Warm Period (CWP). Likewise, they also report that the mean summer SSTs of the MCA and RWP were, respectively, 0.2 and 1.0C higher than that of the CWP, while the mean winter SSTs of the MCA and RWP were, respectively, 1.3 and 1.8C higher than that of the CWP.
In commenting on their findings, the five Chinese researchers say “our well-calibrated high-resolution tropical SST records, which suggested a warmer MCA than recent decades, did not agree with the results of the IPCC fourth report, which suggested that the recent decades were the warmest in at least the past 1,300 years.” And they additionally go on to say that their new temperature reconstruction is “not the only evidence in eastern Asia for a warmer MCA than recent decades.”
.png)
.png)
.png)
.png)
Yan et al. note, for example, that a winter temperature reconstruction for eastern China based on crop distribution data recorded in Chinese historical documents has also “showed a distinct warm period (AD 930-1310) in the MCA,” when “temperatures in the warmest 30-year period were 0.9C higher than those of 1951-1980,” citing Ge et al. (2003). In addition, they note that “tree ring research from the mid-eastern Tibetan Plateau suggested that the temperatures during AD 864-882 and AD 965-994 were comparable or warmer than those during AD 1970-2000,” citing Liu et al. (2009).
Last of all, the Chinese group of five write that a “recent study in Qaidam Basin of northwest China also indicated a warmer MCA,” noting that “quantitative reconstructions from Sugan Lake and Gahai Lake both suggested a much higher temperature in the MCA than in the recent warm period,” citing He et al. (2013). And, we might add, the second NIPCC report of 2013 also provides a wealth of data that contradict the claim of the IPCC that “recent decades were the warmest in at least the past 1,300 years,” clearly demonstrating that there has been nothing unusual or unprecedented about the mean level of global warmth experienced over the past 18 years of no significant upward or downward trend.
References
Ge, Q., Zheng, J., Fang, X., Man, Z., Zhang, X., Zhang, P. and Wang, W.-C. 2003. Winter half-year temperature reconstruction for the middle and lower reaches of the Yellow River and Yangtze River, China, during the past 2000 years. The Holocene 13: 933-940.
He, Y., Liu, W., Zhao, C., Wang. C., Wang, H.Y., Liu, Y., Qin, X.-Y., Hu, Q.-H., An, Z.-S. and Liu, Z.H. 2013. Solar influenced late Holocene temperature changes on the northern Tibetan Plateau. Chinese Science Bulletin 57: 1053-1059.
Liu, Y., An, X., Linderholm, H.W., Chen, D.-L., Song, H.-M., Cai, Q.-F., Sun, J.-Y. and Tian, H. 2009. Annual temperatures during the last 2485 years in the mid-eastern Tibetan Plateau inferred from tree rings. Science in China Series D: Earth Science 52: 3498-359.
Obama, Gore other climate alarmists refuse to debate, but love to vilify - and love their money
Paul Driessen
Manmade climate disaster proponents know the Saul Alinksy community agitator playbook by heart. In a fight, almost anything goes. Never admit error; just change your terminology and attack again. Expand your base, by giving potential allies financial and political reasons to join your cause. Pick “enemy” targets, freeze them, personalize them, polarize them and vilify them.
The “crisis” was global cooling, until Earth stopped cooling around 1976. It was global warming, until our planet stopped warming around 1995. The alarmist mantra then became “climate change” or “climate disruption” or “extreme weather.” Always manmade. Since Earth’s climate often fluctuates, and there are always weather extremes, such claims can never be disproven, certainly not to the alarmists’ satisfaction.
Alarmists say modern civilization’s “greenhouse gas” emissions are causing profound climate change - by replacing the powerful, interconnected solar and other natural forces that have driven climate and weather patterns and events since Earth and human history began. They insist that these alleged human-induced changes are already happening and are already disastrous. Pope Francis says we are already witnessing a “great cataclysm” for our planet, people and environment.
However, there is no cataclysm, now or imminent, even as atmospheric carbon dioxide levels have gone well past the alleged 350 parts-per-million “tipping point,” and now hover near 400 ppm (0.04%). There has been no warming since 1995, and recent winters have been among the coldest in centuries in the United Kingdom and continental Europe, despite steadily rising levels of plant-fertilizing CO2.
As of January 12, 2015, it has been 3,365 days (9.2 years!) since a Category 3-5 hurricane hit the US mainland. This is by far the longest such stretch since record-keeping began in 1900, if not since the American Civil War. Sea levels are barely rising, at a mere seven inches per century. Antarctic sea ice is expanding to new records; Arctic ice has also rebounded. Polar bears are thriving. In fact:
Every measure of actual evidence contradicts alarmist claims and computer model predictions. No matter how fast or sophisticated those models are, feeding them false or unproven assumptions about CO2 and manipulated or “homogenized” temperature data still yields garbage output, scenarios and predictions.
That’s why alarmists also intoned the “peak oil” and “resource depletion” mantra - until fracking produced gushers of new supplies. So now they talk about “sustainable development,” which really means “whatever we advocate is sustainable; whatever we despise and oppose is unsustainable.”
USEPA Administrator Gina McCarthy also ignores climate realities. Her agency is battling coal-fired power plants (and will go after methane and gas-fired generators next), to “stop climate change” and “trigger a range of investments” in innovation and a “clean power future.” What she really means is: Smart businesses will support our agenda. If they do, we’ll give them billions in taxpayer and consumer money. If they oppose us, we will crush them. And when we say innovation, we don’t mean fracking.
As to responding to these inconvenient climate realities, or debating them with the thousands of scientists who reject the “dangerous manmade climate change” tautology, she responds: “The time for arguing about climate change has passed. The vast majority of scientists agree that our climate is changing.”
This absurd, dismissive assertion underscores citizen investigative journalist Russell Cook’s findings, in his perceptive and fascinating Merchants of Smear report. The climate catastrophe narrative survives only because there has been virtually no debate over its scientific claims, he explains. The public rarely sees the extensive evidence debunking and destroying climate cataclysm assertions, because alarmists insist that “the science is settled,” refuse to acknowledge or debate anyone who says otherwise, and claim skeptical scientists get paid by oil companies, tainting anything they say.
The fossil-fuel-payoff claim is classic Alinsky: Target and vilify your “enemies.”
“No one has ever offered an iota of evidence” that oil interests paid skeptical researchers to change their science to fit industry views, :despite legions of people repeating the claim,” Cook notes. “Never has so much, the very survival of the global warming issue depended on so little a paper-thin accusation from people having hugely troubling credibility issues of their own.” The tactic is intended to marginalize manmade global warming skeptics. But the larger problem is mainstream media malfeasance: reporters never question “climate crisis” dogmas...or allegations that “climate denier” scientists are willing to fabricate studies questioning “settled science” for a few grand in illicit industry money.
Pay no attention to the real-world climate or those guys behind the curtain, we are told. Just worry about climate monsters conjured up by their computer models. “Climate change deniers” are Big Oil lackeys and you should turn a blind eye to the billions of dollars in government, industry and foundation money paid annually to researchers and modelers who subscribe to manmade climate disruption claims.
In fact, the US government alone spent over $106 billion in taxpayer funds on alarmist climate research between 2003 and 2010. In return, the researchers refuse to let other scientists, IPCC reviewers or FOIA investigators see their raw data, computer codes or CO2-driven algorithms. The modelers and scientists claim the information is private property, even though taxpayers paid for the work and the results are used to justify energy, job and economy-killing policies and regulations. Uncle Sam spends billions more every year on renewable energy programs that raise energy prices, cost jobs and reduce living standards.
None of these recipients wants to derail this money train, by entertaining doubts about the “climate crisis.” Al Gore won’t debate anyone or even address audience questions he hasn’t preapproved.
As to claims of a “97% consensus,” one source is responses from 75 of 77 “climate scientists” who were selected from a 2010 survey that went to 10,257 scientists. Apparently, the analysts didn’t like the “consensus” of the other 10,180 scientists. Another study, by a University of Queensland professor, claimed that 97% of published scientific papers agree that humans caused at least half of the 1.3 F (0.7 C) global warming since 1950; in reality, only 41 of the 11,944 papers cited explicitly said this.
“Skeptical” scientists do not say climate doesn’t change or humans don’t affect Earth’s climate to some (small) degree. However, more than 1,000 climate scientists, 31,000 American scientists and 48% of US meteorologists say there is no evidence that we are causing dangerous warming or climate change.
Two recent United States Senate staff reports shed further light on other shady dealings that underlie the “dangerous manmade climate change” house of cards. Chains of Environmental Command reveals how Big Green activists and foundations collude with federal agencies to develop renewable energy and anti-hydrocarbon policies. EPA’s Playbook Unveiled shines a bright light on the fraud, deceit and secret science behind the agency’s sue-and-settle lawsuits, pollution standards and CO2 regulations.
The phony “solutions” to the imaginary “climate crisis” hurt our children and grandchildren, by driving up energy prices, threatening electricity reliability, thwarting job creation, adversely impacting people’s health and welfare, and subsidizing wind turbines that slaughter birds and bats. They perpetuate poverty, misery, disease and premature death in poor African and Asian countries, by blocking construction of fossil fuel power plants that would bring electricity to 1.3 billion people who still do not have it.
The caterwauling over climate change has nothing to do with real-world warming, cooling, storms or droughts. It has everything to do with an ideologically driven hatred of hydrocarbons, capitalism and economic development, and a callous disdain for middle class workers and impoverished Third World families that “progressive” activists, politicians and bureaucrats always claim to care so much about.
House and Senate committees should use studies cited above as a guide for requiring a robust pollution, health and climate debate. They should compel EPA, climate modelers and scientists to testify under oath, present their evidence and respond to tough questions. Congress should then block any regulations that do not conform to the scientific method and basic standards of honesty, transparency and solid proof.
Paul Driessen is senior policy analyst for the Committee For A Constructive Tomorrow (http://www.CFACT.org), author of Eco-Imperialism: Green power - Black death and coauthor of Cracking Big Green: To save the world from the Save-the-Earth money machine.