


By CO2 Science
CO2 Science reviewed the paper “A 2000-year global temperature reconstruction based on non-treering proxies” by Loehle in 2007 Energy and Environment Volume 18, pages 1049-1058.
Using data from eighteen 2000-year-long proxy temperature series from all around the world that were not developed from tree-ring data (which provide significant interpretive challenges), the author (1) smoothed the data in each series with a 30-year running mean, (2) converted the results thereby obtained to anomalies by subtracting the mean of each series from each member of that series, and then (3) derived the final mean temperature anomaly history defined by the eighteen data sets by a simple averaging of the individual anomaly series, a procedure that he rightfully emphasizes is “transparent and simple.” The results obtained by this procedure are depicted in the figure below, where it can be seen, in the words of its creator, that “the mean series shows the Medieval Warm Period (MWP) and Little Ice Age (LIA) quite clearly, with the MWP being approximately 0.3C warmer than 20th century values.”
See larger image here
Loehle notes that “the 1995-year reconstruction shown here does not match the famous hockey stick shape,” which clearly suggests that one of them is a poorer, and the other a better, representation of the truth. Because of its simplicity and transparency, as well as a host of other reasons described in detail by Loehle—plus what we have learned since initiating our Medieval Warm Period Record-of-the Week feature—it is our belief that Loehle’s curve is by far the superior of the two in terms of the degree to which it likely approximates the truth. Get printable version of this review here.
By Anthony Watts on Watts Up With That
According to wire reports, temperatures reached their lowest point in 30 years, reaching to -2C in the capital, Riyadh, and to -6C in mountainous regions blanketed by snow. At least 10 people have died in the country as a weather system driven South from Siberia sent temperatures plummeting. Apparently its gotten so bad (or they just aren’t prepared to deal with it) that King Saud ordered that government assistance should be given in the affected areas, which witnessed sub-zero temperatures this week.
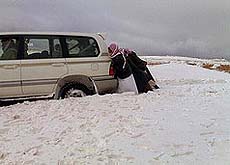
I had to laugh at the photo above and the caption: Saudi Arabians are used to getting stuck in the sand, but snow is a new challenge for many. It almosts seems Pythonesque.
While I’m enjoying pointing out these uncommon phenomena, I’d also point out that even though both the northern and southern hemispheres have both seen some record cold events in the past 6 months, that doesn’t necessarily equate to “climate change”. Still, something seems afoot as we are seeing more and more events like this. Maybe the massive La Nina now stretching across the Pacific ocean has something to do with this.
Oh but wait, there’s more! Snow was seen yesterday atop Maui’s Mount Haleakala in Hawaii.

Yeah, somethings up. See the full story and many more photos from the middle east and Hawaii on Anthony’s site here.
By Joseph D’Aleo, CCM
Late Thursday Update: See this story on the new snowstorm for the Midwest. The cold will abate early in February as we have been saying but expect a new arctic blast and snow even maybe further east early in week 2.
Late Wednesday Update: It dropped to 0F in Kirksville, MO this morning down from 55 yesterday. In St. Louis, the drop was from a high of 73F to 11F this morning. Wind chills were as low as -57F in Grand Marais, MN. The front created chaos as it came east last night and today before losing its punch in the northeast. The next storm will lift northeast with heavy snows perhaps as far west as Chicago and St Louis and east as the eastern Great Lakes.
Tuesday’s Post: An arctic front is whipping through the central states this morning with drops of 40 and 50 degress in the matter of hours. In Kirksville, MO at 7am when folks headed off to work and school, it was a balmy 55F. By 1 pm as they were at lunch, it was a frigid 14F with 24 mph winds bringing a wind chill of -4F with light snow and blowing snow. At 2 pm it was down to 12F. The change is even more dramatic considering yesterday it reached 65F there. The low tonight is forecast to be 5F. Big drops like this were common throughout the plains and midwest and will be the case through tonight as the arctic front sweeps east.
See full size image here.
That cold front will put an end to the brief warm up as it sweeps east but the cold will moderate in transit. the readings well below zero in the upper midwest tonight will be much less severe as they come further east. Last week we talked about how the oscillating wave in the tropical high atmosphere called the MJO often affects the location of warming and cooling as it traverses the globe in an a somewhat erratic and irregular fashion. It is current roughly entering the same location where it was when the warmth was felt in the east and central earlier in January though this time the MJO is weaker so the warmth may not be as anomalous. This will likely mean above normal temperatures will dominate the next week to 10 days especially in the east with storms tending to curl west and bring rain and the warmest days. That track will mean the heaviest snows in places like Chicago and Detroit. After that, the cold should shift more to the east along with the threat again of snow for the east.
More Moisture in the Air?By Karl Bohnak, Meteorologist
Water vapor accounts for about 95 percent of earth’s natural “greenhouse” effect. Carbon dioxide gets all the attention because that is what is released in the burning of fossil fuels. Yet it accounts for less than 4 percent of the total greenhouse effect. For the anthropogenic global warming argument to work, water vapor must increase along with CO2. C02’s contribution - natural and manmade - is just not enough to raise global temperatures as much as climate models predict. Two recent studies claim to show that moisture has indeed increased and go further in stating this increase is tied to human activity.
The latest edition of the Bulletin of the American Meteorological Society (BAMS) summarizes the findings of these papers in their “Nowcast” feature section. The first study, published in the Proceedings of the National Academy of Sciences, is titled “Identification of human-induced changes in atmospheric water content.” In it, an increase in atmospheric water vapor content was found. Then, a fingerprint examination of water vapor content in the atmosphere was conducted using computer models. The researchers claim to have found a “human fingerprint” on the increase, stating that other natural factors such as solar forcing or the atmospheres recovery from the eruption of Mt. Pinatubo in 1991 could not explain the increase. Roger Pielke, Sr., Senior Research Scientist at the Cooperative Institute for Research in Environmental Studies (CIRES) commented on this study at Climate Science: “The paper shows no trend in absolute humidity since 1998 despite surface temperature increasing since then! Indeed, plotting the model data since 1900 is disingenuous, since there is no data to compare with.” (Data from the satellite based Special Sensor Microwave Imager (SSM/I) was used, which is only available from 1988 on.)
The second paper was published in Nature and is entitled, “Attribution of observed surface humidity changes to human influence.” It states there has been a global increase of 2.2 percent in humidity in the years 1973-2002. The authors claim they found a “clear influence of manmade gases on increased humidity.” To this, Pielke commented: “The paper only deals with surface humidity (which as shown on Climate Science is very significantly altered by land use.)” In an email to ICECAP, he went further, stating that “model simulations are used to test the explanation. This is not the scientific method.”
On the other hand, Pielke coauthored a paper which does not support the findings of the above studies. In it, lower-tropospheric temperatures over North America had indeed increased between 1979 and 2006, but precipitable water vapor and total precipitable water content had not. This suggests that climate model assumptions of constant relative humidity in a warmer world may be all wet. See the pdf here.
Karl Bohnak is a long-time TV meteorologist at WLUC TV6 in Marquette Michigan who came north from a TV position in Milwaukee. He is the author of So Cold A Sky, Upper Michigan Weather Stories
When One Crazy Month Ends Up NormalBy Joseph D’Aleo, CCM
For Madison, Wisconsin, if the forecasts for the last three days of the month turn out close to accurate, January will average just about exactly normal. Someone years from now looking back at the month might assume it was a boring month. The folks who live there, where I spent 6 wonderful years at the University, will tell you it was anything but.
Take a look at the daily highs and lows for the month. The last three days are utilizing the local forecast office forecast values. After a frigid start, a ten day warm spell set in which peaked in week 2, held back by the snowpack that had built up from the second snowiest December on record and never entirely disappeared even during the warm days. Cold set back in on the 14th and really deepened after the 17th until the 25th. Moderation followed with today the 28th being the warmest day but it will be brief with another day blast of arctic air hitting hard late tomorrow into Wednesday when below zero readings return. 11 days of the month will have had below zero (F) readings, one day for an entire 24 hours. In contrast four days stayed entirely above freezing.
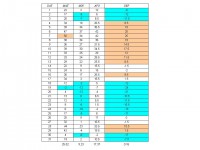
See full size table here
The city had 20.6 inches of snow as of this morning for the month following the second snowiest December which had 33.5 inches. The seasonal total with the 1.5 inches on November is 55.6 inches with two plus months more to go in the snow season. Normal total seasonal snow there is 44.1 inches, so already they have had a foot more than the normal amount of snow.
See full size map here
This confirms (1) how fickle and extreme La Ninas can be and (2) how they often produce above normal snows across the north central states. See pdf of this here.
By Joseph D’Aleo, CCM
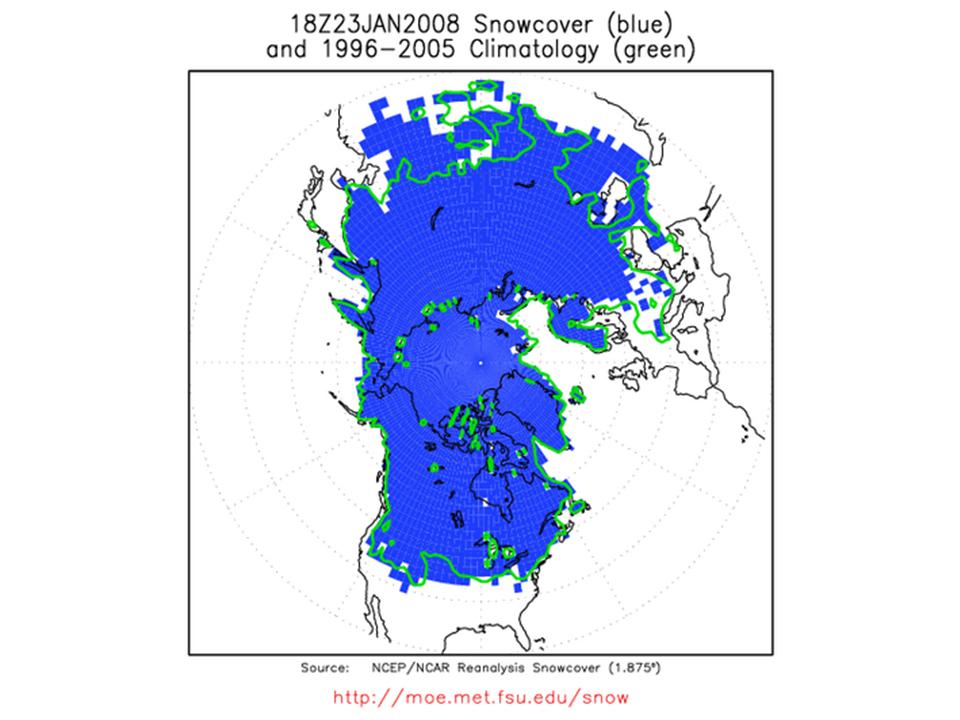
With a major snowstorm in China and snow covering much of Asia and parts of the middle east and a decent snowpack in North America (recently NASA reported 60% of the lower 48 states and all of Canada was snowcovered), our Northern Hemispheric snowcover is now 2% above normal and the highest level in at least 5 years. A rather amazing 25% of the northern Hemispheric is snow and ice covered. The next two images come from Dr. Bob Hart at Florida State University. In the first, the green line represents the normal snowcover extent for the date and the blue the actual snowcover.

See full size image here.
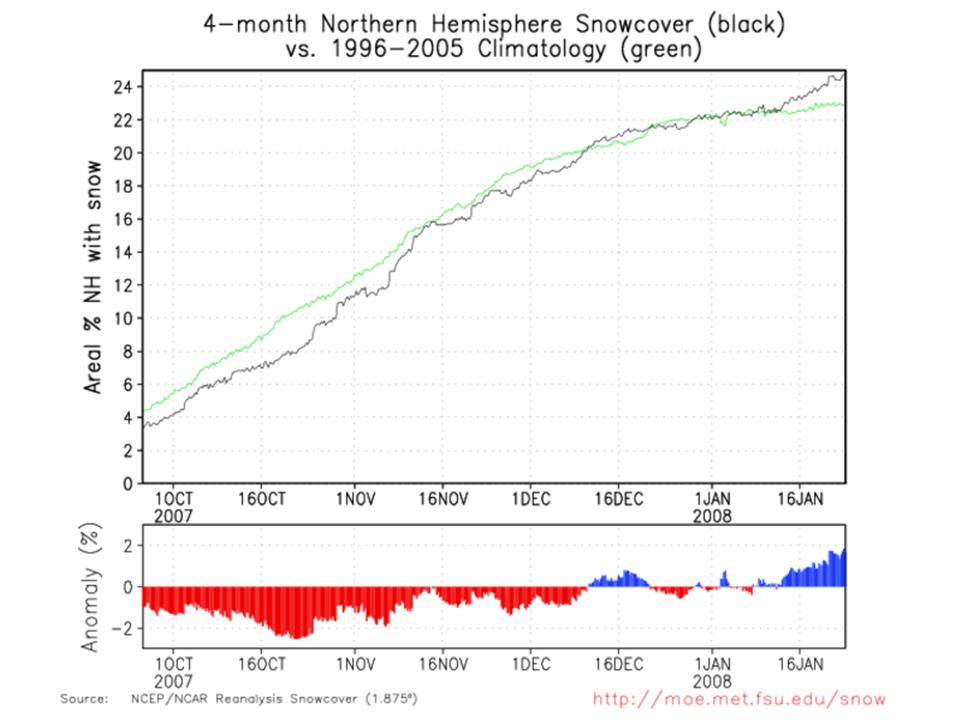
In the second image the actual percent (black) is plotted relative to the climatological (green). We reversed a 2% snow and ice coverage deficit this past summer and now have a 2% excess (above normal).

See full size image here.
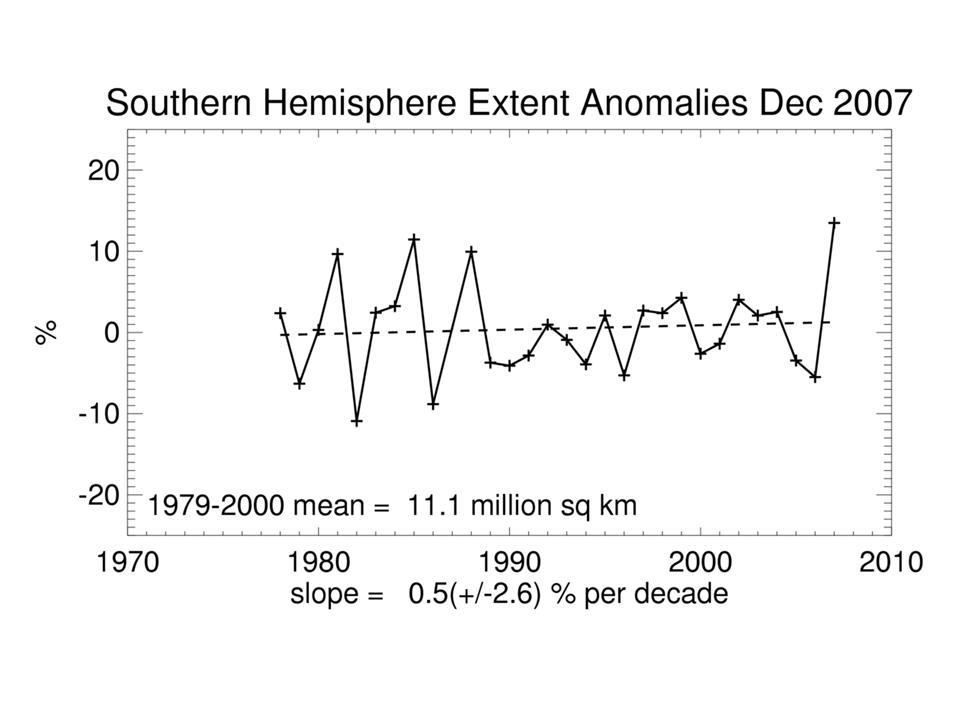
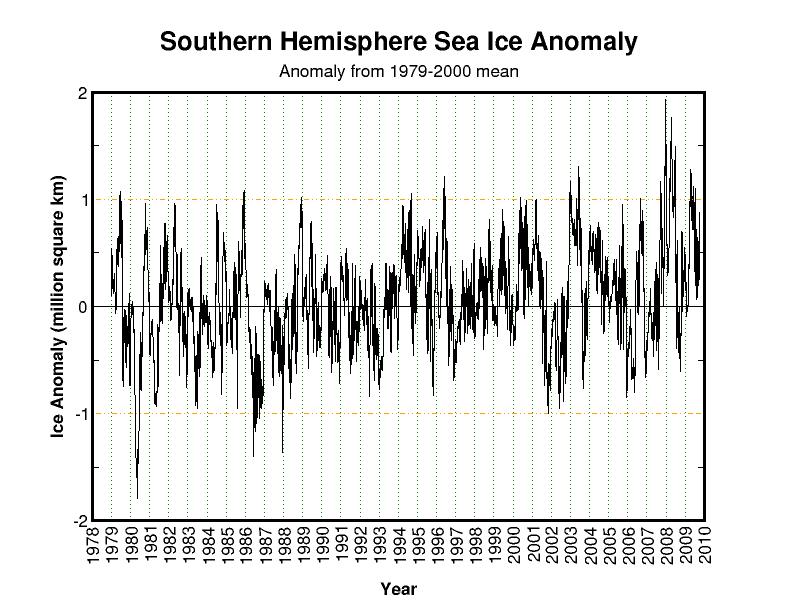
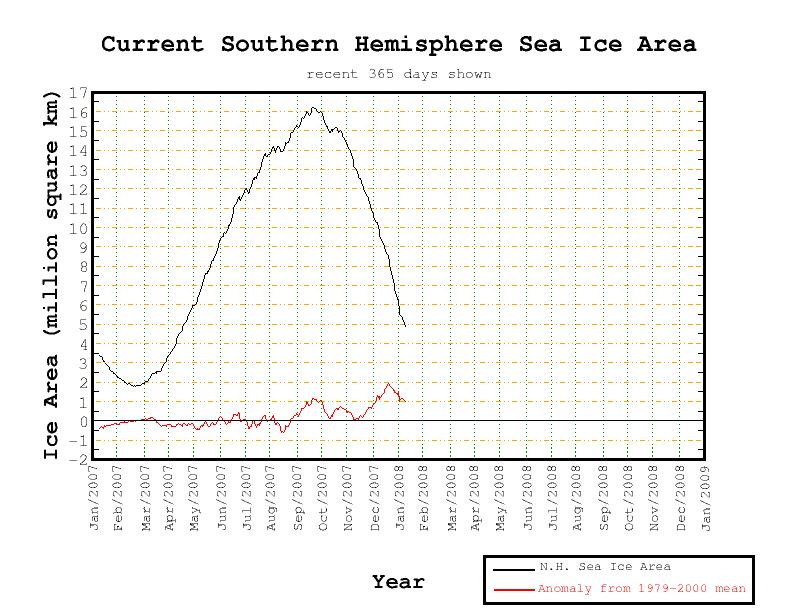
December sea ice extent in the Southern Hemisphere was a remarkable 15% above normal and the highest of the entire record as was the case in the late winter (it is now mid-summer and the sea ice is diminishing but is still well above normal). This graph is from the University of Illinois National snow and Ice data Center and shows the satellite derived sea ice extent in the southern hemisphere for Decembers since records began in 1979.

See full size image here.
By Joseph D’Aleo, CCM
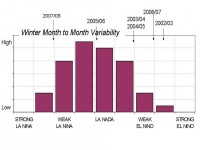
A very stormy few weeks is in the cards as another regime change takes place. La Ninas are notoriously fickle unless they are super strong, We have a moderate La Nina ongoing and a fair amount of variability as I am sure you will agree from a very cold start in early December easing to more seasonable but very snowy conditions. A briefly bitter cold start to January gave way to a record second week warm spell. Frigid air returned in week 3 concentrated in the central states. It has moderated this weekend in the central and will by early week with some rains in the east but another shot of cold will be felt this week mainly across the north.
See full size image here
Intraseasonal variability can relate to episodes of high latitude blocking events (not a factor this year, at least not yet) and to a phenomenon known as the Madden Julian Oscillation; CPC has an excellent FAQ section here that answers questions about this phenomenon. The Australian Bureau of Meteorology tracks this phenomenon closely as it affects the probability and timing of rainfall events there. Tropical forecasters track it for timing enhanced tropical activity in summer and fall. Other forecasters look at it in winter to time stormy periods for the west and central United States and temperature fluctuations elsewhere.
We are entering a phase of the MJO that favors a series of storms for the west and central states that will bring very heavy snows to many areas there (focused mainly on the Midwest in areas like Des Moines, IA, Chicago IL and Madison, WI). You will see stories in the news about these snow events through the next few weeks. These storms will ride up through the northeast but those storm track usually mean rain for the east with the exception maybe in some events for the higher elevations up north and west (northern New York and northern Vermont). With time (in a few weeks) the storm track will shift east and assuming there are bullets left in storm gun, the east would get its shot at more snows, in time for ski areas to recover for the important President’s Day week.
By Joseph D’Aleo, CCM
A while ago, we presented correlations of US annual mean temperatures with carbon dioxide, solar irradiance, and ocean multidecadal cycles. We found the best correlations with the ocean cycles and irradiance and weakest with carbon dioxide, especially in the last decade.
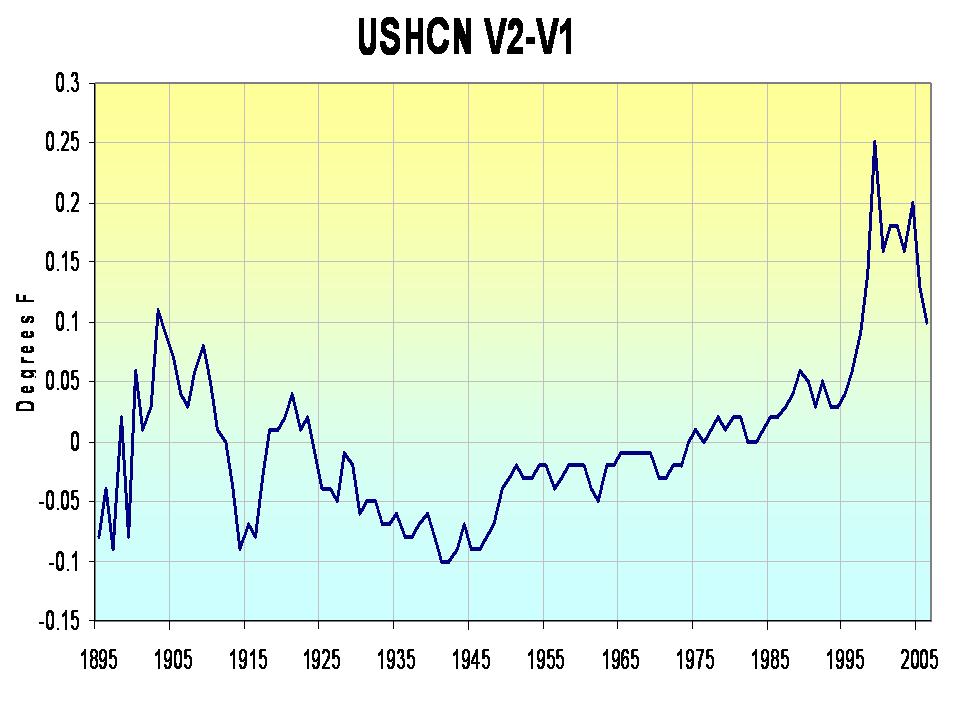
NCDC has released its new climate data set Version 2 of USHCN in which it has replaced some of the prior adjustments (like Karl’s 1988 based urban adjustment) with an adjustment using an algorithm that is designed to find known and previously undocumented inhomogenteities (i.e. station moves, land use changes, etc.). The differences between the two data sets is relatively small but the pattern is hard to understand from a purely scientific basis. The biggest warming is post 2000 which has the effect of elevating recent years relative to the 1930s. It also warms the temperatures in the early 1900s which has the effect of diminishing the warming trend then.
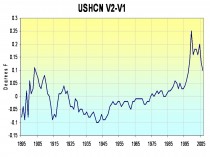
The difference between version 1 and version 2 of NCDC USHCN Annual Mean Temperatures for the US. Full size image here.
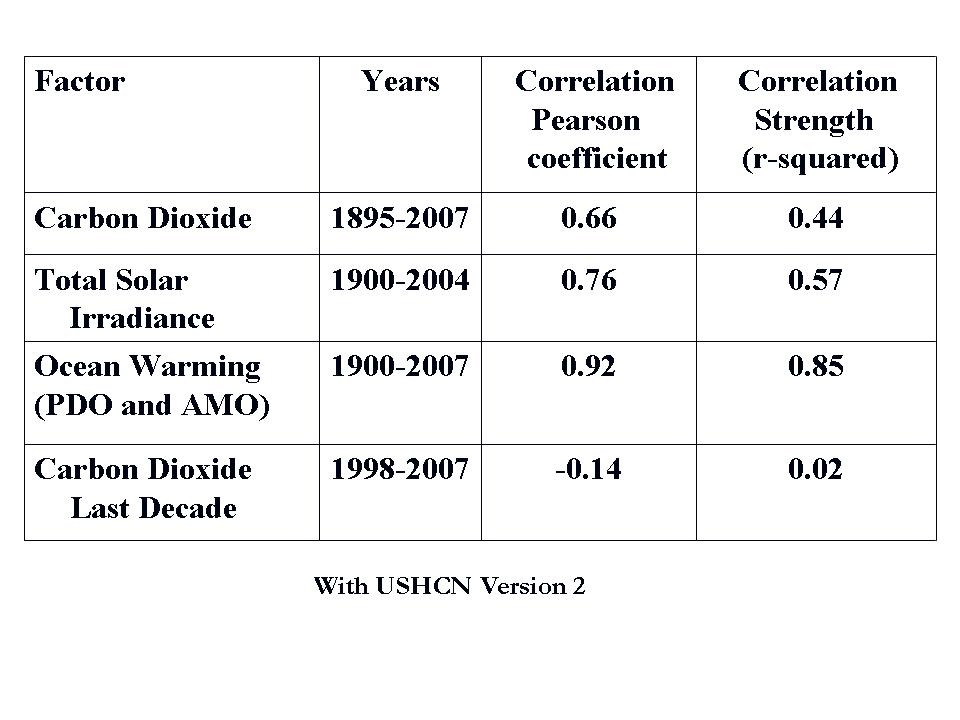
I repeated the correlation analysis with the new data. Again the oceans came out on top followed by the solar irradiance. The new data set had a higher correlation for CO2 for the entire record but when we look at the correlation of CO2 in the last decade it was actually even lower - a small negative.
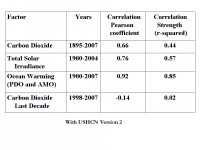
Correlations of the CO2, solar irrradiance and ocean multidecadal cycles with USHCN version 2 temperatures. Full size image here.
See the detailed analysis here. See Anthony Watts’s take on these conclusions in his Warming Trend: PDO And Solar Correlate Better Than CO2
By Madhav Khandekar and Joseph D’Aleo
The news item about the year 2007 as the second warmest (Washington Post 12 January 2008) must be taken with a grain (maybe a whole block) of salt. Such declarations are based on calculating a mean temperature for the earth’s surface area (land-ocean combined) and this seemingly simple task is often full of ‘pitfalls’. Large areas of earth’s landmass were only sparsely monitored in the past, and remain so even today. Ironically the situation has gotten worse since 1990, when two thirds of the world’s climate reporting stations shut down. Add to that the issues of improper accounting for urbanization and land use changes as documented by Roger Pielke Sr. and most recently McKitrick and Michaels and poor siting as documented by Anthony Watts and his network of volunteers and unaccounted for instrument changes as Ben Herman blogged on Climate Science recently about, and you have a little reason to trust the accuracy of any station based data set.
Add to this the problem of calculating a mean temperature over the earth’s water bodies (oceans, lakes, rivers) and the task of calculating a mean temperature, accurate enough for declaring a certain year as “the warmest”, becomes even more challenging. Large ocean areas, especially in the Southern Hemisphere, remain unobserved even today, while over Northern Hemisphere, sea surface temperature data was available primarily over well-traveled ship tracks in the early 1900s and even today many ocean buoys and other temperature platforms are located in and around major shipping routes of the world oceans. And the methods for ship measurement of sea surface changed from canvas to wooden buckets in the 19th century and to ship intake in the World War II and later years, each of which produce different results. Although the changes occurred gradually, adjustments to the data were made arbitrarily in the late 1800s and in 1941. This too helps create uncertainty since the oceans are two thirds the globe. Climate Audit has had numerous posts on this ignored issue including this one.
So when NASA scientists James Hansen and colleagues declare 2007 to be the second warmest year, one has to wonder and ask: How good is their calculation? Is it possible to calculate the earth’s mean temperature accurate to a few tenth’s of a degree? How can NASA scientists then declare that the mean temperature for 2007 was 58.2F which was just 0.1F less warm than the year 1998? Further, NOAA calculated 2007 as the fifth warmest while the Climate Research Unit (CRU) in East Anglia (UK) which is the benchmark for IPCC (Intergovernmental Panel for Climate Change) calculated 2007 as the seventh warmest! So who one is right and who is wrong? Do we know for sure?
We do know, as Roger Pielke Jr. noted in a recent Prometheus blog, NASA’s (Hansen’s) assessment is warmest of all assessments and their forecast for future warming were greater than even the IPCC. He noted “Good scientific practice would have forecasting and data collection used to verify those forecasts conducted by completely separate groups.”
In reality, competing measures of station data and satellite derived data, show the earth’s mean temperature appear to have reached a plateau, which has been even been admitted by Rajendra Pachauri, the head of the U.N. IPPC that shared the 2007 Nobel Peace Prize with former U.S. Vice President Al Gore, saying “he would look into the apparent temperature plateau so far this century. One would really have to see on the basis of some analysis what this really represents” he told Reuters, adding “are there natural factors compensating? (for increases in greenhouse gases from human activities). If the earth’s mean temperature is indeed steady while carbon dioxide has continued to rise, it is time to start to ask some hard questions about the global warming science. Read full blog here
Advocacy Out of Control in the Organizations and MediaBy Joseph D’Aleo, CCM, AMS Fellow
As Andrew Revkin noted on the dot.earth blog today, the American Geophysical Union, the world’s largest organization representing earth and space scientists, put out a fresh statement on the causes and consequences of recent climate change and possible responses. In the last few years, the Royal Society, the National Academy of Sciences (NAS) and the American Meteorological Society (AMS) have also issued statements endorsing the so-called “consensus” view that man is driving global warming. What you don’t hear is that these societies never allowed member scientists to vote on these climate statements. Essentially, only two dozen or so members on ad hoc committees and governing boards of these institutions produced the “consensus” statements.
As a council member of one of the professional societies (the AMS), I can tell you I was extremely disappointed with the process and even the notion of the issuance of a statement supposedly representing the view of the society to policymakers without the full involvement of its members. In the case of the AMS, the statement drafting process involved appointing an ad hoc committee to draft a statement and then have the council review and recommend changes and then post for comment for just 30 days on the society web site home page. Few members frequent the home page often going to the site only to look for papers or register for upcoming conferences. Still the posted statement received a record number of comments back, many of them strongly negative. Despite an exhaustive effort to catalog the comments, in the end little substantive change was made to the statement.
Yet the society proclaimed to Dr. Roger Pielke Sr. when he inquired about the process for creating the statement that the committee simply ‘facilitated the drafting and that the council and the membership owned and controlled the final statement’. Roger pushed for longer review and for a referendum. When little changed from the draft statement and no changes were made to the process, Roger responded by posting the names of the authoring committee on Climate Science. Roger believes “this problem of our professional organizations using their positions as political pulpits is appalling and compromises the scientific process”.
And whatsmore, these societies and as Roger Pielke Sr. posted yesterday even organizations like UCAR have drifted away from objective science towards advocacy. Read much more here.
By Dr. Ben Herman on Roger Pielke Sr.’s Climate Science
There is an issue with regards to U.S. surface temperature trends that seems to have been overlooked, although apparently well recognized. I am referring to the HO-83 thermometers that were installed at many USHCN sites as well as first order stations. It has been well documented (Gall et.al. 1992, Jones et.al. 1995, Karl et. al. 1995) and others.that a warm bias existed, primarily in the daily maximum temperature readings reported by these instruments. The error in the Tucson data was about 2-3 deg F, but this error was apparently different with each thermometer. Karl et. al. (1995) have suggested that the average for this error over the country was on the order of 0.5 deg C on the reported maximum temperatures. Thus, if the maximum temperatures were corrected by this amount, average temperatures in the U.S, would be lowered by about 0.25 deg C, assuming the minimum readings were correct. This would probably pretty much neutralize the reported trend increase during the late 80’s and 90’s in this country. The situation has been covered in some detail in a Climate Audit blog by Steve McIntyre for those wishing more detail on the history of this issue.
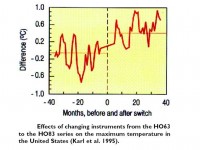
See full size image here
These thermometers have subsequently been replaced, but to the best of my knowledge, none of the station data have been corrected for this problem. In view of the probable magnitude of this error, and the time elapsed since the problems with the HO-83 thermometers have been known, why has this issue not only been not corrected, but also, not even mentioned by those that are determining and publishing these trends? It is true that these faulty instruments were probably used primarily in the U.S. Read more here.
Dr. Benjamin Herman is the former Director of the Institute of Atmospheric Physics and also former head of the Department of Atmospheric Sciences at the University of Arizona. He has been a member of both the Institute for the Study of Planet Earth’s Executive Committee and the Committee on Global Change.
When Science Reporting Was UnbiasedBy Joseph D’Aleo, CCM
We reported that the arctic ice minimum this year was due to natural cyclical fluctuations in the multidecadal ocean cycles and the flow of warm water into the arctic through the Barents Sea and Bering Strait in this blog on September 22nd. NASA too did a story on the changes in the arctic being at least in part due to changes in the arctic ocean circulation.
To show this is nothing new or unusual, take note of this quote from Scientific American reported in the Orleans, Vermont Independent Standard of Nov.28, 1856 found and forwarded by John McClaughry of the Ethan Allen Institute:
“It is well known as a matter of history, that when Greenland was discovered, it possessed a much warmer climate than it does at present. The ice packs have been extending south from the polar regions for some centuries, and the northeast coasts of our continent are much colder than they were three centuries ago. The cause of this is not well understood - the fact only is known. It is believed by some persons that there is a great eddy in some part of the polar ocean which sometimes changes its direction, and by drifting large iceberges from one place to another, changes the climate of those places whence they are drifted by the presence of such masses of ice diffusing their low temperatures to great distances.”
This excellent animation by NSIDC from 1981 to 2007 also shows how arctic ice has been on the move increasingly in recent decades on an annual basis due to the global pattern changes. The numbers/colors represent the age of the ice from 0 (water) to 5 or more (red).

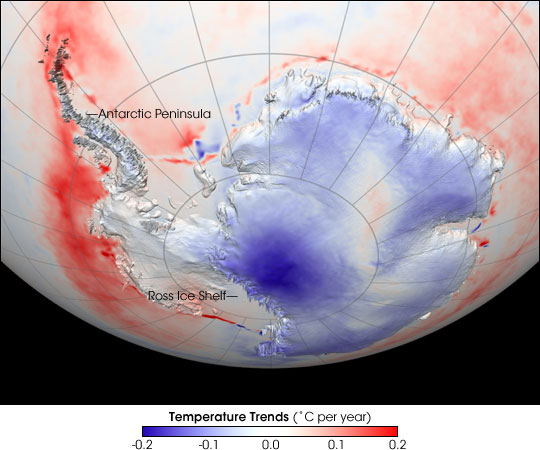
Thanks to John McLean for a link to this site tracking Antarctic temperatures since 1955 by Ole Humlum, UNIS, Department of Geology, Svalbard, Norway. They conclude the existing Antarctic surface air temperature records 1960-1998 reveal periods of persistent (multi-year) and geographically extensive temperature trends towards cooling in the interior and warming in the coastal regions. The spatial and seasonal patterns of these trends are, however, not quite simple and appear to change with time; that is, the temperature relationship between specific locations is not temporally consistent. Within the Antarctic Peninsula a warming trend has, however, persisted, with exception of the spring season. The cooling has been modest in coastal East Antarctic regions, but more pronounced at the Amundsen-Scott Base and at the South Pole.
The observed temperature changes since 1957 has been difficult to simulate by Global Climate Models (Connolley and O’Farrell 1998) and is not yet fully understood. The observed spatial pattern of temperature variations may, however, indicate that the consecutive warming and cooling throughout the decades was part of a large-scale circulation pattern that exhibits long-term persistence. There is some observational evidence suggesting that under present conditions cooler conditions on the Antarctic Plateau are associated with stronger zonal westerlies around the Antarctic continent, causing warmer conditions in the Peninsula regions penetrating north into the zone of enhanced westerlies.
5 Year running annual mean temperatures 1988 to 2002. See full size image here
Western Antarctica and the peninsula is also a region of volcanic activity which may be contributing at times to upwelling of warmed water and icemelt. That was confirmed this week in an article in Nature Geoscience and in the National Science Foundation site.

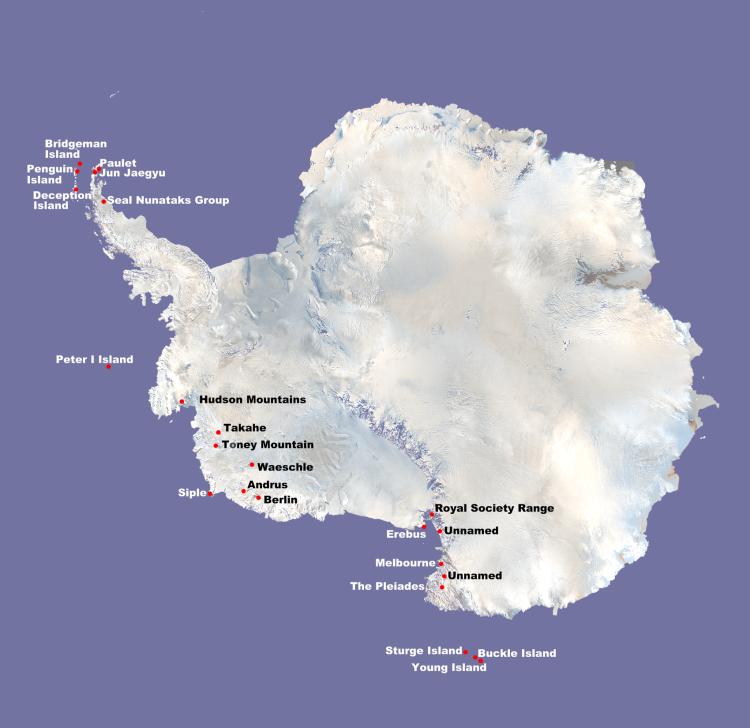
Thanks to Alan Siddons for this image of Antarctic volcanoes. See full size image here. See this spectacular image of the hot spots and the cold continent from satellite from 1982 to 2004 here.
By the way, the Gakkel ridge under the Arctic is volcanically active right now and together with the recent inflow of warm water from the Pacific and Atlantic in their multidecadal warm modes may be contributing factors to recent icemelt there as well in recent years.
By Joseph D’Aleo, CCM
UPDATE SUNDAY AM: The Giants are in Green Bay on the frozen tundra of Lambeau Field for the evening playoffs. Green Bay’s high temperature yesterday was -1F. At this writing in the early morning it is -13F with a wind chill of -32F. After a high of 0 to 2F, by game time, it is likely to have dropped back to zero or below with wind chills of -25 to -30F. In Foxboro where the Patriots take on the Chargers, arctic air is streaming in this morning after a dusting of snow in the area during the pre-dawn hours. temperatures will be dropping through the teens through the game with below zero wind chills. By the way, the cold and snow headed to the deep south.
ICE BOWL 1967
The 1967 National Football League Championship Game between the Green Bay Packers and the Dallas Cowboys was the 35th championship game in NFL history. Popularly known as the Ice Bowl, it is widely considered one of the greatest games in NFL history, due in part to the hostile conditions in which it was played, the importance of the game, the rivalry between the teams, and the dramatic conclusion.
The 1967 game, played on December 31 at Lambeau Field in Green Bay, Wisconsin, remains the coldest NFL game on record. The official game-time temperature was -13F / -25C, with a wind chill around -48F / -44C. The bitter cold overwhelmed Lambeau’s new turf heating system, leaving the playing surface hard as a rock and nearly as smooth as ice. The officials were unable to use their whistles after the opening kickoff. As the referee blew his metal whistle to signal the start of play, it froze to his lips. For the rest of the game, the officials used voice commands and calls to end plays and officiate the game.
Several players, including Dallas defensive tackle Jethro Pugh and Green Bay quarterback Bart Starr, still claim to suffer occasional mild effects of the frostbite they developed that day. Dallas quarterback Don Meredith came down with pneumonia after the game and was hospitalized on his return to Texas. Furthermore, the University of Wisconsin - La Crosse Marching Chiefs band were supposed to perform the pregame and halftime shows. During warmups in the brutal cold, the woodwind instruments froze and wouldn’t play, the mouthpieces of brass instruments got stuck to the players’ lips, and seven members of the band were transported to local hospitals for hypothermia. The band’s performances were canceled. Lambeau Field supposedly got its nickname, “The Frozen Tundra” from that game which Green Bay won 21-17.
The winners head to southern Arizona for the Super Bowl and much more benign conditions in a few weeks.
By Joseph D’Aleo, CCM
Once again today we were told in the media that the antarctic ice is melting at an increasing and alarming rate. The story appeared in many papers including the Washington Post and the UK Globe Mail today based on a research project, led by Eric Rignot, principal scientist for the Radar Science and Engineering Section at NASA’s Jet Propulsion Laboratory in Pasadena, California, and appearing in the current issue of Nature Geoscience. In an e-mail, Dr. Rignot attributed the shrinkage in the ice sheet to an upwelling of warm waters along the Antarctic coast, which is causing some glaciers to flow more rapidly into the ocean. He suspects the trend is due to global warming.
This seemed odd coming shortly after reports that the Southern Hemisphere (Antarctica) set a record for the MAXIMUM extent of ice since satellite monitoring began in 1979 this year. We thought we would take a look at the latest NSIDC graphs for southern hemispheric ice extent.
See full size image here
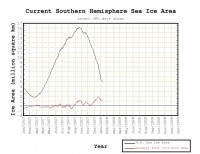
See full size image here
I will remind you it is mid-summer in the Southern Hemisphere. Ice extent remains well (one million square kilometers) above the 28 year average and an impressive 3 million square kilometers above last year at this time!. There is clearly a lot of year to year variability in the record but the demise of the Antartic icecap seems to be anything but imminent. Most of the warming and melt in recent years has been in the vicinity of the Antarctic Peninsula, a small portion of the Antarctic which reaches above the Antarctic Circle and is a choke-point for the circumpolar ocean currents, and is more susceptible to variations. There’s also an active subsea volcano in the area, perhaps leading to the warm water upwelling in the study.