


By Joseph D’Aleo, Icecap
A few weeks back, we looked at July and January in Central Park at the version 1 variances from the raw observed data in a blog on Central Park Temperature Comparisons. Steve McIntyre at Climate Audit did the same with Central Park: Will the real Slim Shady please stand up?
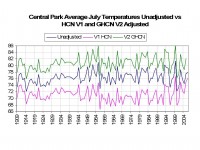
We have discussed how the global data bases are contaminated by station dropout, missing data, poor coverage, inadequate urban adjustment and poor siting issues. NCDC in addition to the HCN maintains a global data base of stations which it uses to track climate change. I decided to compare Central Park in that GHCN data set (the latest V2) with the HCN data set relative to the raw data.
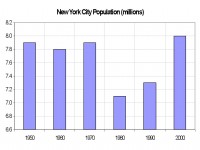
The differences between the data sets is startling large for the July monthly mean through much of the record (11F!). it diminishes since 1990 as HCN adjustments for urbanization have inexplicably diminished even as NYC population grew.
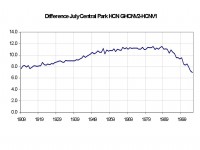
These kinds of variances in the “data” have got to have you question whether we can trust any data set to determine changes the order of a tenth of a degree for climate change assessment. See full pdf with full size images in printable form here.
By Alexandre Amaral de Aguiar, MetSul Meteorologia Weather Center Communications Director
It was June 22nd 1918. Buenos Aires got covered by snow. That last time the Argentineans saw their capital covered in white the world was still fighting the First Great War, the former Russian czar was executed by revolutionaries, the Spanish Influenza started to attack and Woodrow Wilson was in office as the 28th president of the United States of America and the planet was leaving the very cold period of the Little Ice Age.
It was July 9th 2007. Buenos Aires got covered by snow. The Argentinean capital was white again after nearly a century. No superpowers are in conflict, terrorism is the new menace, AIDS and bird flu are the health concerns, George W. Bush is in office as the 43rd president of the United States of America and the planet is warming in a fever of studies pointing to a global catastrophe due to human-induced greenhouse effect.
“Despite all my years, this is the first time I’ve ever seen snow in Buenos Aires”, 82-year-old Juana Benitez was quoted as saying by the Associated Press news agency. That was the overall feeling. Thousands of Argentines cheered in the streets of Buenos Aires as the capital saw the first of its kind since 1918. The initial report of snow came from the Ezeiza International Airport, in the outskirts of Buenos Aires, but minutes later it was also snowing in the densely populated areas of Central Buenos Aires. Wet snow fell for eight hours in the Argentine capital and at sometimes it was heavy. Late in the afternoon snow became heavier and several districts of Buenos Aires were already accumulating snow in the parks and over parked cars.
The frigid weather was not confined to Buenos Aires. It snowed for the first time in 35 years in some cities of the northern Buenos Aires Province. It snowed for the first time in history in some towns of the Santa Fe Province. Southern Santa Fe Province experienced the snowiest day since 1973. Cordoba City the heaviest snowfall since 1975. Mendoza went trough he heaviest snowstorm in decades. Temperature fell to minus 19 degrees Celsius in Patagonia and near all-time record in Bariloche (most famous ski resort in South America). Windchill in Bariloche was record: -minus 22 degrees. Low temperature in Bahia Blanca, Southern Buenos Aires province, fell to outstanding 9 below zero Celsius. Snow also fell in northern Provinces and in Bolivia isolated the capital La Paz from the rest of the country.
The snow event followed a bitterly cold month of May that saw subfreezing temperatures, the coldest in 40 years in Buenos Aires. That cold wave contributed to an energy crisis and dozens of deaths. This 2007 May figured among the coldest in recent decades also in Uruguay and Southern Brazil.
See full story replete with some photographs here
By Peter McGurk, Icecap member and Senior Meteorologist, WSI
Expanding on the work of Bruce Hall in the “Hall of Fame” blog, I took a look at how the state temperature extremes compared when stratifying the data by whether or not the record was set during the first half of the last century (1900-1949) or during the second half of the last century (1950-1999).
Looking at extreme state maximum temperatures, there were 298 recorded during the years from 1900 to 1949 while only 245 records were set during the period from 1950 to 1999. This in spite of the bias, noted by Hall, of listing only the most recent record location in the event of a tie. For extreme min temperatures, the data shows almost the exact opposite. Only 246 extreme record state low temperatures during the period from 1900-1949 while 301 extreme low state records were set during the period from 1950 to 1999.
As far as extreme maxes are concerned, not only is the overall average greater during the first half of the last century, but 2/3 of the monthly averages are also greater during the period 1900-1949. Only for the months of March, June, October and December were they warmer during the period 1950-1999. For the extreme mins, the first half of the 1900s was decidedly colder than the second half, in spite of the fact that the majority of the record mins occurred during the period 1950-1999. Only 1/3 of the months, May, June and July were the monthly averages cooler during the period 1950-1999.
I suspect that if we were truly headed for a Global Meltdown, that this data would vastly different than it is currently. Namely, we would be seeing many more record state maxes occurring more frequently during the recent past that the distant past. Additionally, we should not be seeing more state record extreme mins set during the second half of the past century.
See Pete’s full data analysis and charts here.
By: Joseph D’Aleo, CCM and George Taylor, CCM
The IPCC Fourth Assessment, Working Group I Report R4 devoted many pages to a discussion of mulitdecadal ocean teleconnections and various solar factors but in the end discounted them or concluded their relationship with climate changes were at best uncertain.
Multidecadal Oscillations in the Pacific and the Atlantic are acknowledged to be the result of natural processes. In the attached we show how the warm phase of the Pacific Decadal Oscillation (PDO) leads to more El Ninos and general warmth and the cold phase to more La Ninas and widespread coolness. The warm mode of the Atlantic Multidecadal Oscillation (AMO) also produces general warmth especially across Northern Hemispheric land masses including Greenland and the Arctic and the cold phase colder temepratures over the Northern Hemisphere continents and Polar Regions. When you combine the two effects, you can explain much of the temperature variances of the past 110 years for the United States, Greenland and the Arctic.
Similarly increased solar activity when you consider more than just the solar brightness or irradiance and include other more indirect solar warming factors such as ultraviolet which through ozone chemistry warms the high and middle atmosphere in low and middle latitudes and the decrease in cosmic rays which reduces low clouds, also correlates extremely well with temperature changes in the United States and the Polar Regions.
Though correlation does not always imply causation, the strength of these relationships suggest the oceans and sun play a far more important role in climate change than the IPCC admits to.
See full paper here.
By Joe D’Aleo, Icecap
We compared historical Central Park, NY data from the National Weather Service site in New York City as taken from the periphery of the park from 1909 to 1919 at the Arsenal Building 5th Ave (between 63rd & 64th) and then since 1920 at the Belvedere Castle on Transverse Rd (near 79th & 81st) with the Central Park data from NCDC Climate at a Glance USHCN database with HCN adjustments made to the NYC observations. We picked the two extreme months (January and July) for the comparison. The two data sets for July are plotted below.
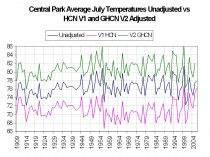
Note the adjustments were significant (a cooling exceeding 6 degrees from the mid 1950s to the mid 1990s.) Then inexplicably the adjustment diminished to less than 2 degrees. The result is what was a flat trend for the past 50 years became one with an accelerated warming in the past 20 years. It is not clear what changes in the metropolitan area occurred in the last 15 years to warrant a major adjustment to the adjustment. The park has remained the same and there has not been a population decline but a spurt in the city’s population in the 1990s.
See full story including the January differences here.
UPDATE: Also see Steve McIntyre’s interesting follow-up analysis on Climate Audit Central Park: Will the real Slim Shady please stand up?
By Joe D’Aleo, Icecap
Because of a report that was blogged by Joe Bastardi of Accuweather that indicated no record daily June highs for Iowa were in recent decades, we took a look for ourselves at the Des Moines records and look what we found for number of record highs by decade for June and July.
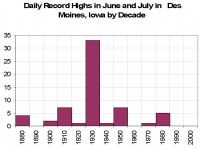
It is very clear that the 1930s stand out with a total of 33 days during the two month period. Both the 1910s and 1950s had 7 days. 1988 made an impressive showing in June with 5 days. July was hot that year but the 1930s were hotter. There were more records set in the 1880s (4) than in the last 20 years (0). For Des Moines, Iowa at least record daily June and July highs show no propensity for increasing in this so-called global warming era.
For a report with larger images and a total for June and July graphic see Des_Moines_June and July_Records
By Joe D’Aleo, Icecap
Version 1 of HCSN developed in 1990 has been for the past 16 years the data base of choice when examining climate change because it was the most stable and had the best adjustment for urbanization (Karl et al. 1988) based in part on the landmark work of Oke and Landsberg. It has had over the years some siting/land use change issues recently brought to light in blog postings too numerous to list by Roger Pielke Sr. on Climate Science, Stephen McIntyre on Climate Audit, and now on a new site that will be a repository for photographs of the stations by Anthony Watts.
The USHCN has always been a point of contention with those managing the global data bases as the USHCN’s warming has been muted and clearly cyclical.
See the comparison to one of the global data bases GISS below.
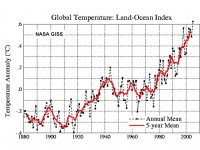
NCDC has announced they are coming out with a new version of the USHCN data base in July which has been described as a “paradigm shift with some significant adjustments due to previously undocumented inhomogenities.” The version 2 documentation is now available and in it it indicates they have eliminated the urbanization and other land use adjustments claiming the new approach makes them unneceessary.
You can bet that if in July the new version plots look a lot like the bogus global plots with their overstated warming due to understated urban adjustment, the Iraqi war will not be the only war in the news.
To their credit, NCDC and NOAA is working on a new network of high quality, properly sited stations called NERON. They currently have 114 or so stations mainly in New England, eastern New York and Alabama. About 50 stations will be added per year under the current plan with a goal of 1000 or more. It will be a awhile before there will be enough coverage and history to make this network useful in climate change assessment but it is clearly a step in the right direction.
By Joe D’Aleo, Icecap
As La Nina slowly comes on, the prospects of a droughty and hot summer are increasing. Historically this has especially been the case after El Nino winters. Drought and heat would of course be blamed on global warming but the historical plots of drought show there is no tendency for a steadily increased frequency of drought during the last century.
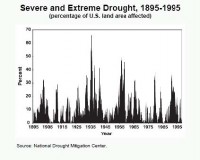
See what La Ninas after El Ninos winter have meant and more on why ocean temperatures are more likely behind changing drought frequency than greenhouse gases here Summer07_Heat_Drought.pdf
By Joseph D’Aleo
The U.S. House’s Select Committee on Energy Independence and Global Warming hearing was held atop 4,180-foot Cannon Mountain in the White Mountains of New Hampshire, requiring all to ride an aerial tram to the lodge where it was held. last weekend to discuss global warming. They heard from some of the local alarmists who predicted there would no longer be a ski industry left in New England, not a single maple treee would survive, so bye-bye maple syrup industry and fall foliage tourism. They heard an orchestrated fictional account of how New England would become more like the Carolinas.
You will recognize those who testified and those who participated in the panel discussion. They will be the ones with the long noses. Not since Paul Bunyon or Prairie Home Companion have such tall tales been told, this time in the beautiful hills of northern New England where I have enjoyed many enjoyable years.
They claim it never snows in the northeast anymore due to global warming. Tell that to the folks further south where in New York City and Boston they set new single snowstorm records the last 3 years. Or Boston where the 12 years ending 2004/05 had more snow than any 12 years in their history back into the 1870s or New York City with 40 inches of snow for the first time ever ending in 2006 and the highest 4 year total in their history back to the 1860s. Or to the 60 cities of the east and midwest that set all-time seasonal snowfall records in the snow blitz season of 1995/96 or in southeast new England in 2004/05.
Now it is true there are always winners and losers in the ‘who gets the snow’ jackpot and northern New England has not fared well most years precisely because the storm track favored snow further south. That was true because after the Great Pacific Climate Shift of the Pacific Decadal Oscillation in 1978, El Ninos were favored and El Ninos favor southern track storms.
By the way, the Pacific appears to be shifting back and this La Nina that appears to be coming on may be the first of many more in the decades ahead. La Ninas mean colder weather further north and the return of the northern storm track. That will mean the ski areas will see much more snow again (remember the tease in the La Nina of 2000/01 when a preview of this change occurred when northern areas were buried?). That will mean better maple runs again and spectacular fall foliage. Also if not this solar cycle certainly the next will be a super dud like those of the mini-age age which will reinforce the cold and have them talking again about putting a dome over Winooski, Vermont like they did in 1979 after the super cold winters of the late 1970s.
Oh and by the way I just looked in the mirror...not crazy about what I saw as the years are showing and my hair is graying… but my nose didn’t grow.
The Heartland Institute has begun a petition drive to get Al Gore to accept the challenge to debate Lord Monckton which Lord Monction issued March 14, 2007. Lord Moncton is a Scottish Peer, former advisor to Margaret Thatcher, and international business consultant. He has responded to An Inconvenient Truth (see Uncorrected errors by Al Gore) and did battle with Mr. Gore in the UK print media. No matter where you stand currently on this issue, this debate would enlighten both sides and many undecided in the middle.
See the debate challenge petition here and sign if you agree.
By Eugenio Hackbart, Chief Meteorologist for MetSul Weather Center in Sao Leopoldo, state of Rio Grande do Sul, Southern Brazil
May 2007 will go to history as one of the coldest starts to climatic winter ever observed in South America. A brutal cold wave brought record low temperatures, widespread frost, snow and major energy disruption. The death toll for the 10-day cold wave was the highest for any single weather event in Argentina in recent history. Authorities confirmed 34 deaths directly or indirectly linked to the polar air incursion. Some of the fatalities were caused by hypothermia, but the majority of the victims died in consequence of fires and gas inhalation. The below-freezing temperatures prompted residents to turn on defective heaters using gas, wood and kerosene. The toxic but odorless carbon monoxide fumes and other lethal gasses were blamed for many of the deaths. In Cordoba, seven children died in a fire initiated by an improvised heater device. In the southernmost state of Rio Grande do Sul in Brazil one child died due to hypothermia.
The cold snap led to electricity and natural gas shortages, idling factories and taxis and causing sporadic blackouts in Argentina, according to press reports. Millions of residents fired up space heaters, straining Buenos Aires’ electrical grid for three nights and forcing authorities to slash power supply nationwide and briefly cut domestic natural gas provisions and exports to Chile. Many factories went idle when distributors shut off or reduced gas supplies to give priority to homes. Government regulators also ordered an 800-megawatt electricity cut nationwide for four hours, which led to sporadic blackouts in the capital Buenos Aires. Grumbling taxi drivers waited for hours in lines stretching several blocks to fill up their black-and-yellow cabs with scarce compressed natural gas. The shortages also had a ripple effect in neighboring Chile, where authorities scrambled to provide energy after Argentina slashed natural gas exports.
Temperatures hit the freezing point or dipped below for three successive nights in the Argentinean capital. Such cold is rare for the southern-hemisphere autumn in Buenos Aires, which normally sees temperatures in the 40s and 50s Fahrenheit or higher this time of year. According to the Servicio Meteorologico Nacional (Argentina’s National Weather Service), the low temperature of 0.3ºC registered in Downtown Buenos Aires was the lowest for the month of May since May 29th, 1962. The city also suffered the lowest windchill value observed in May for the last 36 years. On May 28th, the temperature at midday in Buenos Aires was only 3.7ºC, an unprecedented value in recent history. Read more and see some amazing photographs here.
By Joseph D’Aleo, CCM
A story in the UK Independent reported on three papers or stories timed to urge more drastic action by the G-8 in their upcoming Climate Change summit. The story said the changes occuring were far worse than even the most extreme IPCC scenario and thus warranted immediate and strong action. Lets take a look at the claims made.
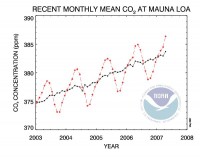
One study, published by the US National Academy of Sciences, shows that carbon dioxide emissions have been increasing by about 3 per cent a year during this decade, compared with 1.1 per cent a year in the 1990s. Despite this reported increase in emissions, the atmospheric concentrations have NOT accelerated. The rate of change in 2006 was 0.44% which is virtually unchanged through the entire Mauna Loa record since 1959. This is proof that sinks such as the oceans and the land vegetation are able to fully sequester most of man’s input, which is minute compared to the natural sources (2.75% of the 0.0038% global atmospheric content of CO is just 0.12%). For a 100 story building, man’s input is the equivalent to the thickness of the linoleum on the bottom floor. It has been shown by Segalstad that even if you burned all of the fossil fuels on the planet at once, the CO2 would not increase more than 20%, it could never double. See Tom’s story and Tom’s PPT.
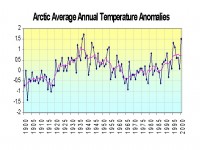
The story also quoted a study by the University of California’s National Snow and Ice Data Center shows that Arctic ice has declined 3 times faster since the 1950s than shown by the models. The actual temperature changes as measured by Polyakov and Dmintrenko (2003) are cyclical and along with the ice thinning and shrinking is similar to that last warm period in the 1930s and 1940s. Even the IPCC noted the changes were similar to the warming of the 1930s and 1940s. Even if all the arctic ice were to melt, it would not accelerate sea level rises because the ice is floating. That is why your glass of ice tea doesn’t overflow when the ice melts. The cycles in arctic temperatures (and US and Greenland) have been observed to extend back centuries. We showed in this blog paper and this paper the cyclical and primarily natural factor driven behavior of temperatures in these regions.
Without major Greenland melting and Antarctic melting (both largely discounted even by the IPCC AR4), there will be no accelerated sea level rise. Indeed Holgate and Woodworth (2004) calculated that the mean rate of global sea level rise was “larger in the early part of the last century (2.03 ± 0.35 mm/year 1904-1953), in comparison with the latter part (1.45 ± 0.34 mm/year 1954-2003).”
By Joseph D’Aleo, CCM
Climatologists may disagree on how much the recent global warming is natural or manmade but there is general agreement that volcanism constitutes a wildcard in climate, producing significant global scale cooling for at least a few years following a major eruption. However, there are some interesting seasonal and regional variations of the effects. Robock (2003) and others have shown that though major volcanic eruptions seem to have their greatest cooling effect in the summer months, the location of the volcano determines whether the winters are colder or warmer over large parts of North America and Eurasia.
In the blog story from the All About Climate link on Volcanism_and_Climate, we also show how unusually low volcanic aerosol activity after a long period without a major volcano as we are experiencing currently, produces a global warming with greatest warming in polar regions just as high aerosol content seems to lead to cooling maximized in the polar regions.
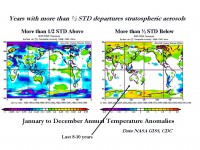
Image shows annual mean temperature anomalies in degrees celsius for all years with abnormally (>1/2 STD) high and low aerosol content. For larger images and more details see the full story here
By Joseph D’Aleo
Bill Gray has been telling us since the Atlantic turned warm in 1995, that the Atlantic would be more active, with more storms, more intense storms and more landfalls on the U.S. mainland all the way from Brownsville to New England. The first areas to feel the brunt were the southeast coast and the Gulf and then in 2004 Florida. New York and New England has had simply to put up with heavy rain and locally damaging winds with storms that had come inland and weakened long before reaching the area.
History tells us during the warm Atlantic, New York and New England is also more vulnerable to a direct hit. History also tells us this is more likely during La Nina summer. In fact in the 11 La Nina summers when the Atlantic was warm since the middle 1930s, there was at least one landfalling storm from the east coast of Florida to New England in every year with a total of 15 storms, 11 of them major CAT 3-5 storms. 9 of the storms affected the northeast directly or indirectly.
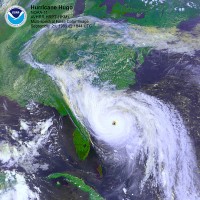
It appears this summer will be a La Nina summer and the Atlantic is still solidly in its warm mode. This suggests New York and/or New England may be especially vulnerable this summer and fall (and if La Nina persists through this winter again in 2008). Indeed Bill Gray has put the probability of a landfalling major CAT 3-5 storm along the east coast from Florida to New England at 50% (average in the 20th century was 31%). The following is account of one such system, The_Great_Hurricane_of_38.pdf. For a more complete analysis of the threat and history of northeast storms, see East_Coast_Hurricanes.pdf.
Of course a major landfall on the populated northeast would be blamed on global warming although major landfalls occurred in the cold early and late 1800s.
Echoing a story we posted last week on a new NASA model showing much hotter summers in the east in the Icing the Hype section, James Spann in the climatebrains.com website in a blog story entitled “NASA We Have a Problem” challenges the ability of models to get it right short and long term, of using just 30years of data (editor’s note: conveniently the 30 years of the warm part of the longer term cycles since the Great Pacific Climate Shift in 1978 - see Ocean Induced Temperature Cycles) and of the so-called consensus of meteorologists and climatologists, and other scientists
He also notes “...how refreshing it was to hear Dr. Roy Spencer of the University of Alabama in Huntsville on the Rick and Bubba show earlier this week, who calmly presented the viewpoint that the warming in recent years is mostly natural. His facts and presentation were excellent, and all I can say is AMEN. And, by the way, I stand by the statement I wrote back in January.
He goes on “I don’t know of another television meteorologist who buys into the catastrophic, man-made global warming hype. I am sure there are some out there, but I sure can’t find them.”